
MSP – Match Speaker Tool#
Introduction#
The Match Speaker Tool is a data post-processing tool for high-end loudspeaker system or headphone manufacturers. The main purpose is matching pairs of speakers with similar characteristics from a pool of measured units. Those characteristics can be the frequency response curve or the impedance magnitude.
The implemented algorithm finds the best matching pairs or the maximum number of pairs at a minimum quality (maximum deviation) by comparing the characteristics of all provided speakers.
The Match Speaker Tool is an additional tool for the Klippel QC system. To be able to use this tool, the following components are required:
Data measured by the Klippel QC System
KLIPPEL dB-Lab software (QC or R&D)
Match Speaker Tool license
For a detailed introduction refer to section Tutorial .
The algorithm and mathematics behind this tool are described in the specification S15_QC_Match_Speaker_Tool.pdf.
Furthermore, this document describes how to use the algorithm as a CAL Module in dB-Lab in order to compare
multiple DUTs to a target curve,
curves created with third party software,
QC measurements with different X-axis setups,
any type of curve (not only SPL and IMP).
Tutorial#
The Match Speaker Tool tutorial is a quick guide through this software module.
Before Using the Tool#
First of all, it is necessary to measure a certain number of loudspeakers using the Klippel QC System. If you are unfamiliar with that topic, refer the QC User Manual first. All measured loudspeakers characteristics are stored in a database (one for each speaker). The data needs to be based on an identical measurement setup.
When you have a measurement result pool available in one folder, start the Match Speaker Tool using the desktop icon.
The Input Tab#
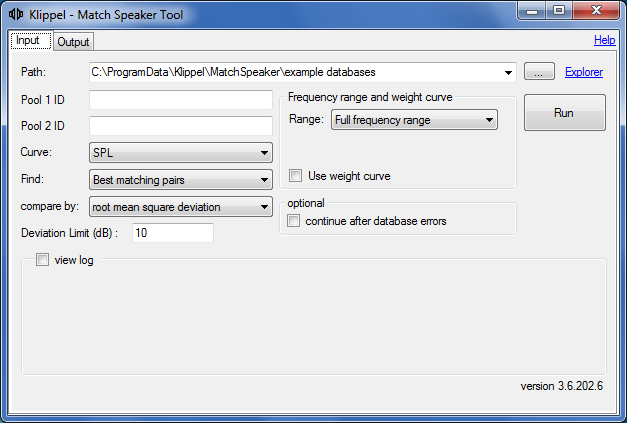
After the program has started you will see the input tab.
Selecting Data#
Data Folder#
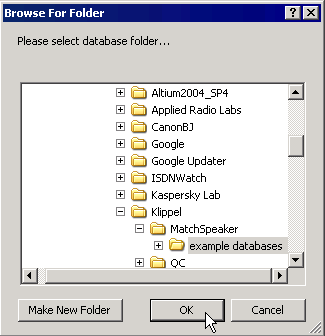
First select the folder where your databases with the measurement results are located. Click on the “[…]” browse button and navigate to the folder.
It is recommended to restrict the number of database files to about 500 to keep the processing time reasonable.
Pool Filter#
For some applications (e.g. headphones) it is required to match devices from two separated pools (e.g. dedicated units left and right channel). For this purpose, pool filters IDs may be defined that are applied to the file names of the source files. All file names that contain the specified ID token are assigned to the corresponding pool.
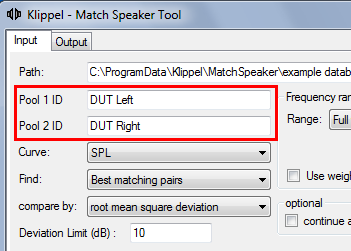
You may either specify ID tokens for one pool (non-matching files are assigned to other pool) or for both pools (only files matching either of the IDs are analyzed).
Note
Pool filter feature is only supported for Mode setting Best matching pairs.
Settings#
Curve#
Now choose the characteristic you want to compare. Select SPL (Frequency Response) or Impedance from the drop-down list named Curve.
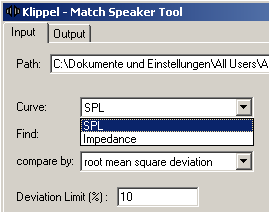
Having done that it is now necessary to configure the parameters for the algorithm. There are three different parameters that need to be set:
Find
compare by
Deviation Limit
Find#
Choose whether you want to find the maximum number of pairs or the best matching pairs by selecting the option from the Find drop down list.
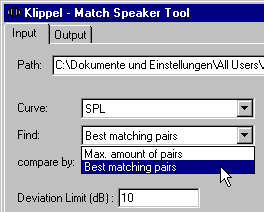
Max. number of pairs will find as many pairs as possible under the condition that the characteristics of two speakers deviate not more than the Deviation Limit parameter. Use this mode if quantity is more important than quality. Quality can still be assured by setting Deviation Limit to a relatively small value.
Best matching pairs is slower than Max. number of pairs and might return less pairs. It is the right mode if you are looking for optimally matching pairs.
Note
Select Best matching pairs in case you are working with Pool IDs.
Compare by#
Define whether you want to compare the selected characteristics by their
mean deviation
root mean square deviation or
maximum deviation
using the compare by drop-down list.
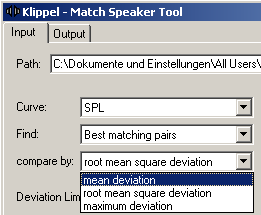
This is how the options affect the comparison between the curves:
mean deviation - all points of the curves are taken into account equally
root mean square deviation - all points of the curves are taken into account but smaller deviations between the curves are less important than bigger ones
maximum deviation - only the point of maximum deviation (where the distance between the curves is the largest) is taken into account
Deviation Limit#
Enter the Deviation Limit parameter to define the greatest acceptable deviation between two speakers. Now all required base parameters are set up to start the matching algorithm.
But before doing that we should have a look at the frequency range, weight curve and optional settings.
Frequency and Weight Curve Settings#
Using the Range select box you can select whether you want to compare the whole range of the curves or only a part of them.
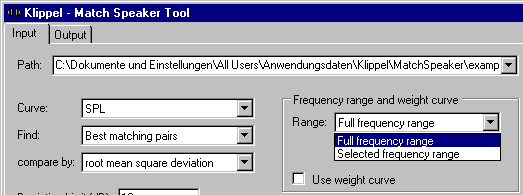
Full frequency range - the whole range of the curves will be compared equally
- Selected frequency range
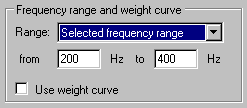 By choosing Selected frequency range it is possible to define a frequency range, curves will only be compared in that range.
Furthermore, it is possible to apply a weight curve to the curves. Use weight curve - by selecting this option the Define weight curve link is shown. Click on that link to open the Weight Curve Entry Box.
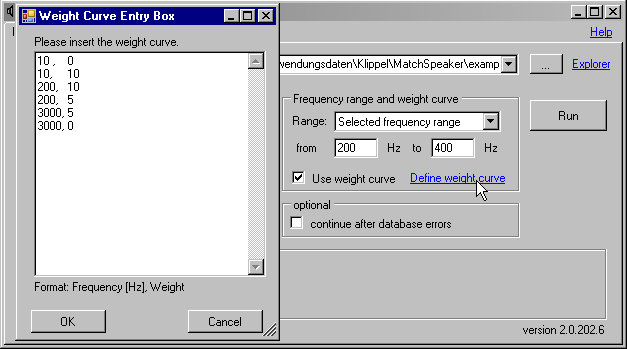
Using the textbox it is possible to define a weight curve. Define a weight curve as shown in the example. The left column is for the frequency in Hz and the right column is for the weight value. In the example, all frequencies lower than 10 Hz will be ignored as they are weighted with 0, from 10 Hz to 200 Hz all values will be weighted with 10. Form 200 Hz to 3000 Hz all values are weighted with 5 and higher frequencies will be ignored again as the weight value is 0.
As the weight vector is normalized in the way that the greatest value is 1 (this is done by dividing all values of the weight vector by the maximum value in the weight vector), the whole setting can be interpreted as follows. The deviation in the frequency range between 10 Hz and 200 Hz will be compared as usual but the deviation in the range between 200 Hz and 3000 Hz will be multiplied by 0.5 (as if the curves would only deviate half as much in this area than they actually do). In all other ranges the algorithm acts as though the curves would not deviate in that range (Deviation is multiplied by 0). Using a weight curve means that the calculated deviation do not represent the actual deviation between the curves but have rather informative character.
Optional Settings#
To explain the functionality of the check box called continue after database errors it is the best to use an example:
Let’s assume you have measured 500 loudspeakers and therefore 500 database files. For some reason one of those files is corrupted or does not contain the required data. In this case the Match Speaker Tool would prompt an error and quit working. To avoid this, you may activate the check box and the Match Speaker Tool will ignore any corrupt databases and continue.
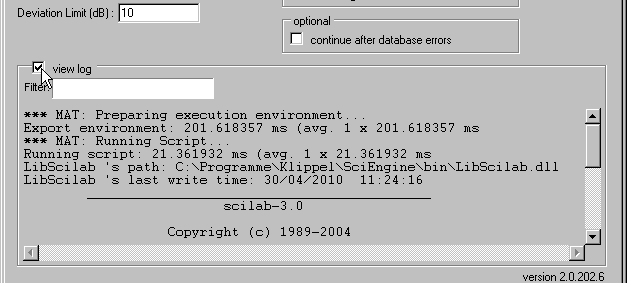
There is another optional check box named view log, by checking it you can get information about the state of the processing script running in the background and a log file is written to the database folder.
Start the Matching#
Click the RUN button to start the data extraction and matching algorithm. A message box will indicate the progress of loading the available databases. After that first step, a Klippel CAL Module is executed in the background performing the actual matching.
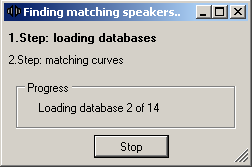
After extraction, the algorithm is finding the pairs. The required amount of time to finish that task depends on the number of speakers (databases) you are comparing. The more speakers you have, the more time it takes (the recommended max pool size is about 500).
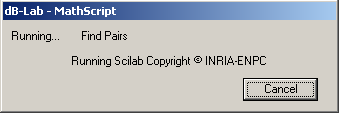
After finishing that task, the Result Overview is shown. It shows how many speakers have been matched and informs about possibly occurred problems (e.g. databases that do not contain the required curve or curves that do not have the same x-axis setup as the others).
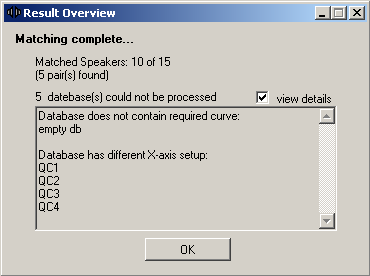
Click OK or press Enter to automatically switch over to the Output tab.
The Output Tab#
Viewing the Results#
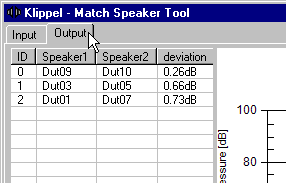
In the Output tab, you can find the list of pairs according to their original database file names. In the right column of the list, the deviation values are displayed. The list is sorted by the deviation value in descending order. Therefore, the best matching pairs are to be found at the head of the list.
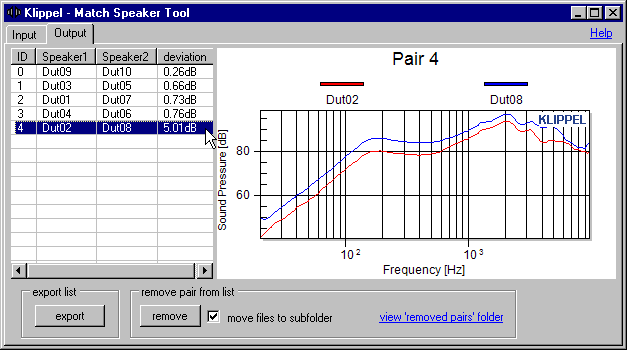
On the right-hand side, you see a chart showing the curves of the selected pair. By selecting another pair from the list, you can easily view and compare the corresponding curves.
If you are using a weighting curve you can display it in the chart as well.
double-click on window
select tab “Subsets”
select Weight Curve
Select Tab Axis
Select Y Axis: Auto + X-Axis: Auto
Press ok and zoom if required with mouse.
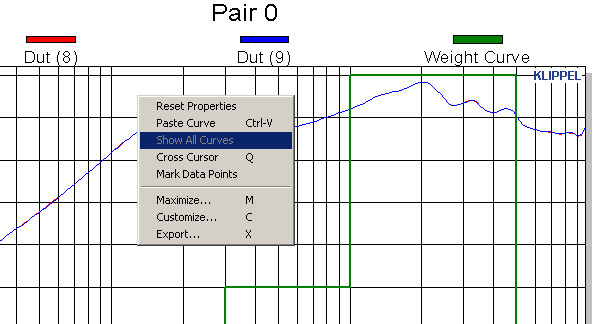
The weight curve is displayed as entered in the “Weight Curve Entry Box”.
Working with the List#
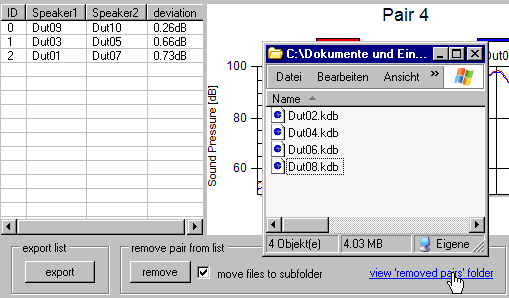
Let’s assume you have measured hundreds of speakers but now you are only looking for two pairs. You can select those from the list and remove them by clicking on the remove from list button. This will only remove the pairs from the displayed list but the databases are still in the folder you selected on the input tab. The next time you search for pairs in the same folder you will find the same databases again. This might be wanted in some cases but often you want to mark removed pairs as “removed” to be sure not to use them again. In that case you can check the move files to subfolder check box.
If you click the remove from list button now, pairs are not only removed from the list but also the databases are moved to a subfolder called “removed pairs”, which is created in the folder you selected on the input tab. To easily open that folder in the Windows Explorer by clicking on the link view ‘removed pairs’ folder.
Using the export list button, it is possible to save the currently displayed list as a text file (columns are separated by tabs).
If you need further explanation for certain properties, refer to section Properties.
Properties#
- Input tab
The input tab is the visible panel after starting the application. It contains all items to configure and start the Match Speaker algorithm.
- Path
Shows the path of the databases to be matched. Fill in the correct path or select the path using the browse button. Note: All databases must be located in this folder, no subfolders are scanned.
- Pool ID 1 & 2
These parameters specify the pool ID tokens applied to the source file names. If the source data shall be separated into two pools before matching, defined at least one ID. All file names that contain the specified ID are assigned to the corresponding pool. If only one ID is specified, all non-matching files will be assigned to the second pool.
- Curve
Selects which curve shall be compared:
SPL (Frequency Response) or Impedance
- Find
Selects whether the algorithm shall find the best matching pairs of all or for the maximum number of pairs at a given minimum quality (Deviation Limit)
- compare by
Selects whether to compare the selected curves by their mean deviation, their root mean square deviation or their maximum deviation.
Refer to the specification S15_QC_Match_Speaker_Tool for details on the calculation.
- Deviation Limit
Defines the maximal deviation between two speakers to form a pair. The lower this value, the more similar the curves need to be to form a pair.
- Range
Selects whether to compare the whole frequency range of the curves or only a part of it.
- Use weight curve
Check, to apply a frequency weighting curve for the matching algorithm.
- continue after data base errors
Ticking this check box will avoid that the Match Speaker tool quits working if some databases are corrupted.
- RUN
Starts the data extraction and matching algorithm.
- view log
By selecting this check box, it is possible to view the log file of the processing script executed in the background and a log file is written to the database folder (useful for error tracking and reporting).
- Output tab
The output tab shows the results of the last run of the match speaker tool. It contains a list of all found pairs and a chart to display the curves of each pair.
- export list
Clicking that button allows saving the currently displayed list of pairs as a text file. Columns are separated by tabs.
- remove from list
Removes all selected pairs from the list. If “move files to subfolder” is checked, the database files corresponding to the pairs are moved to the “removed pairs” folder. That sub folder is located below the original folder where the database files were located before.
- move files to subfolder
see remove from list
- view ‘removed pairs’ folder
Clicking that link will open the Windows Explorer to show the folder ‘removed pairs’.
