
MTON – Multi-Tone Measurement#
The MTON Multi-tone Measurement is a Klippel RnD module that provides a complete measurement of the device under test (DUT) using a multi-tone stimulus. Multi-tone stimuli are quite useful test signals due to their music-like properties with the advantage of direct distortion measurement at the non-excited spectral bins. Therefore, multi-tone distortion provides a much more realistic picture than a pure sine tone measurement and the corresponding harmonic distortion analysis.
The MTON module offers different measurement modes to provide high flexibility in measurement procedures, including stepping and cycling tests, which allow automatic thermal and non-linear compression measurements.
This flexibility in the measurement and stimulus configuration allows the MTON module to perform measurements related to standards IEC 60268-21 [1], ANSI/CEA-2010-B [2], and ANSI/CEA-2034-A [3] among others.
MTON Tutorial#
Viewing MTON Results#
Example data used in this manual is stored in the Web Example database. If not downloaded already, get it from the latest R&D release <https://www.klippel.de/go/current-rnd-release> and open the web-based database.
See also
View Results for general information on how to download this database, open and view results in dB-Lab.
Select the folder Frequency Response + Distortion (TRF, DIS, TBM, SPL, ALD, 3DL, MTON) and within the driver object Transducer – Multi-tone Measurement (MTON, MTD). Please refer to the dB-Lab manual section for navigating within or selecting databases.
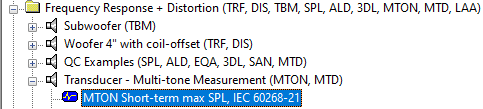
After double-clicking on the operation MTON Short-term max SPL, IEC60268-21 the default result windows will be opened.
Summary#
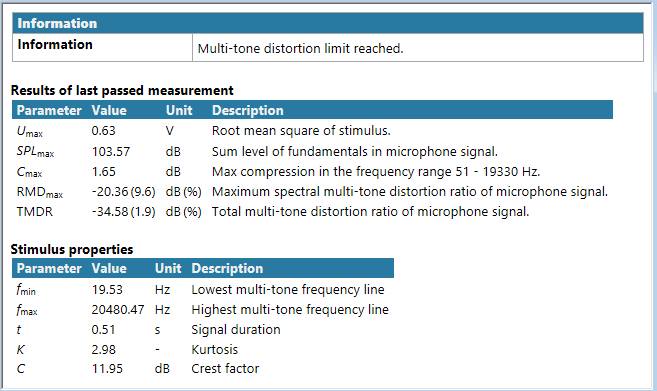
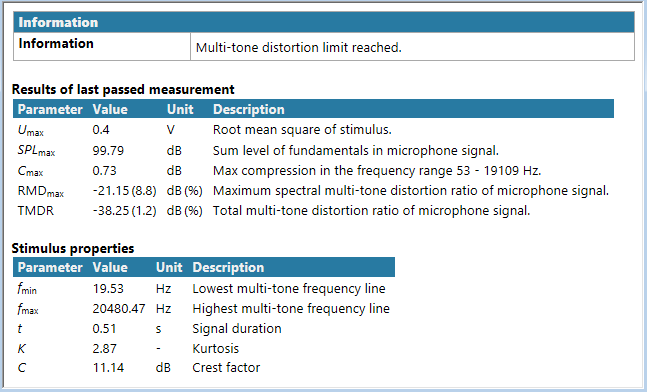
Several tables collect the measurement results and settings, as well as the warnings and errors produced during the measurement. The maximum SPL value as well as the maximum input value among other results of the last passed measurement (measurement below limits) are shown.
H (f) Transfer Function Magnitude#
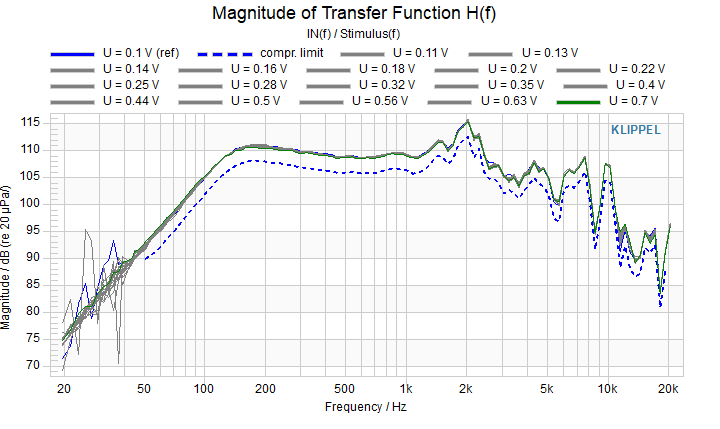
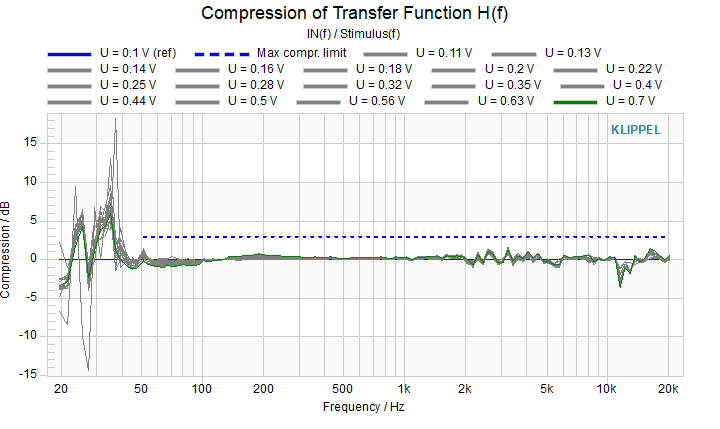
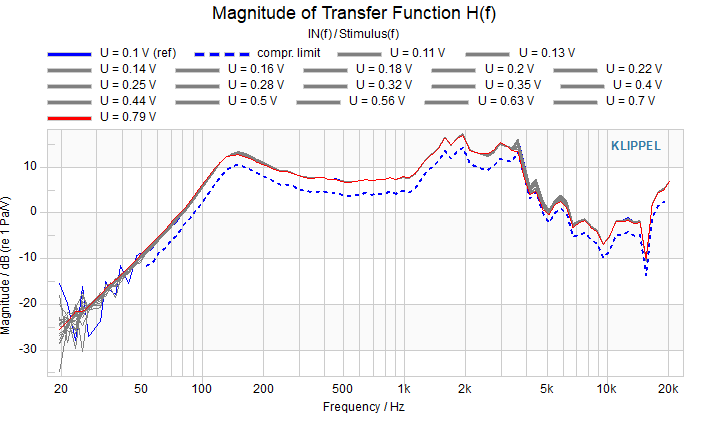
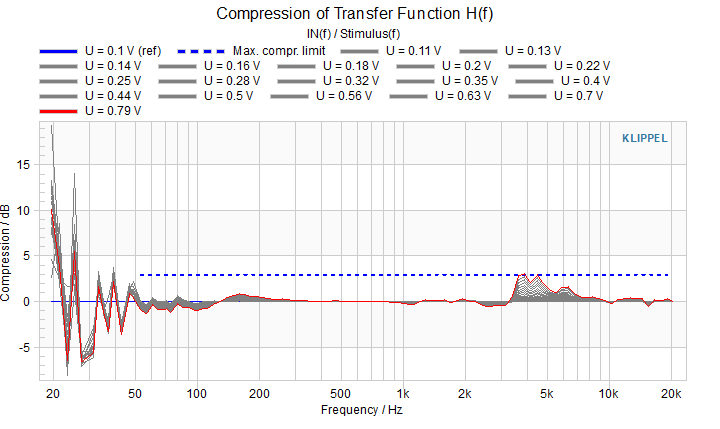
The window H(f) Transfer Function Magnitude collects the transfer functions measured at each input level. Moreover, the compression limit curve is shown. In addition, the chart C(f) Compression collects the transfer functions normalized to the reference measurement (1st measurement) to ease the visualization of compression along the voltage profile.
Multi-Tone Distortion#
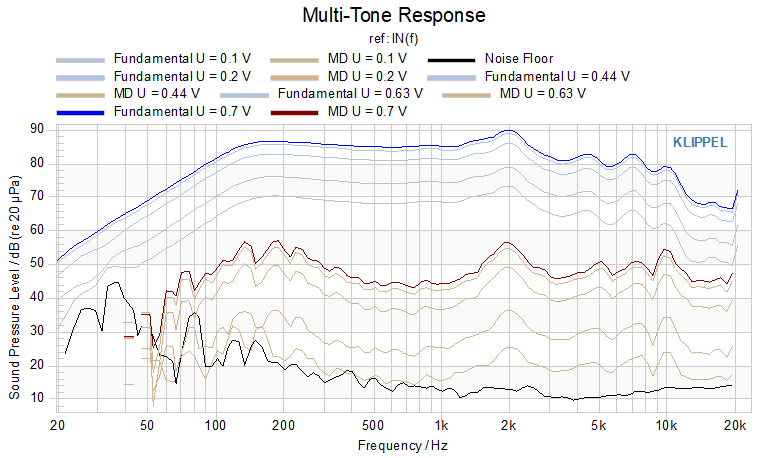
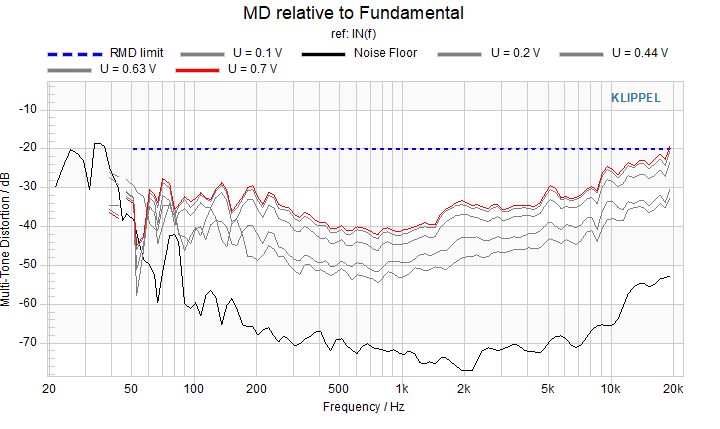
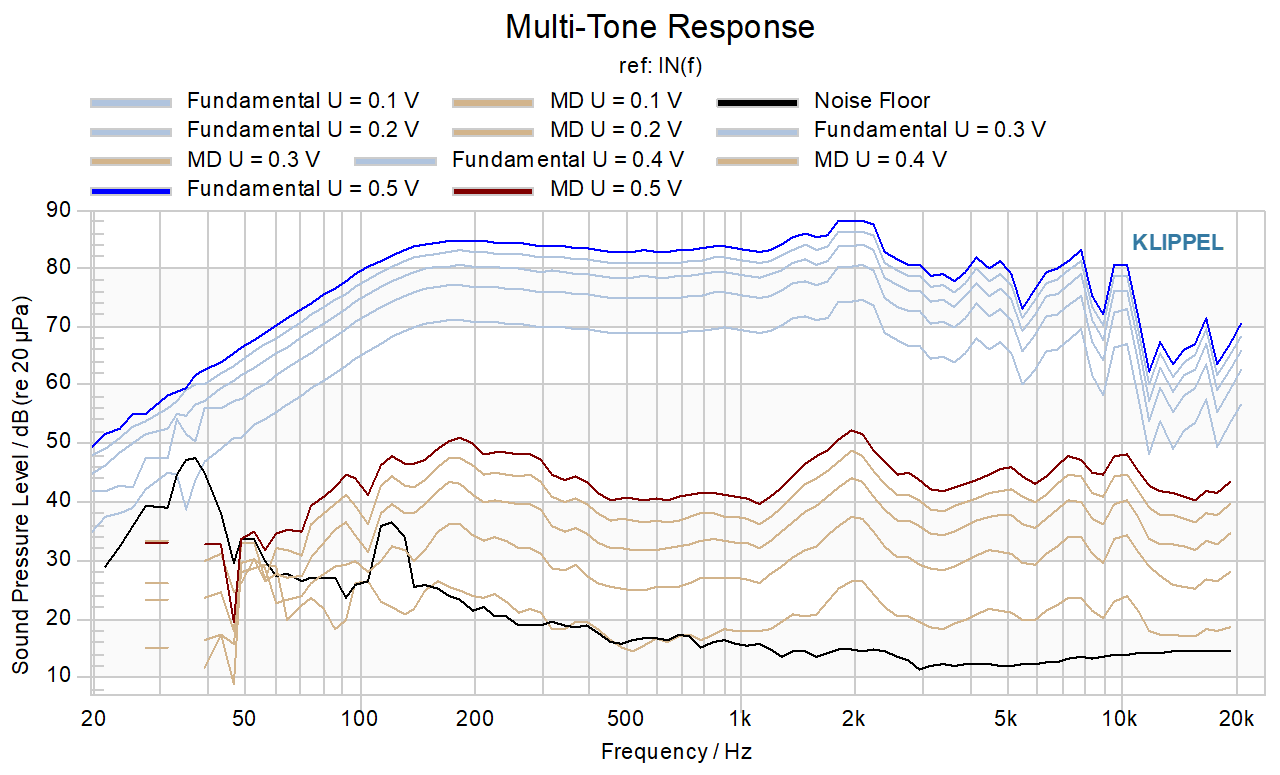
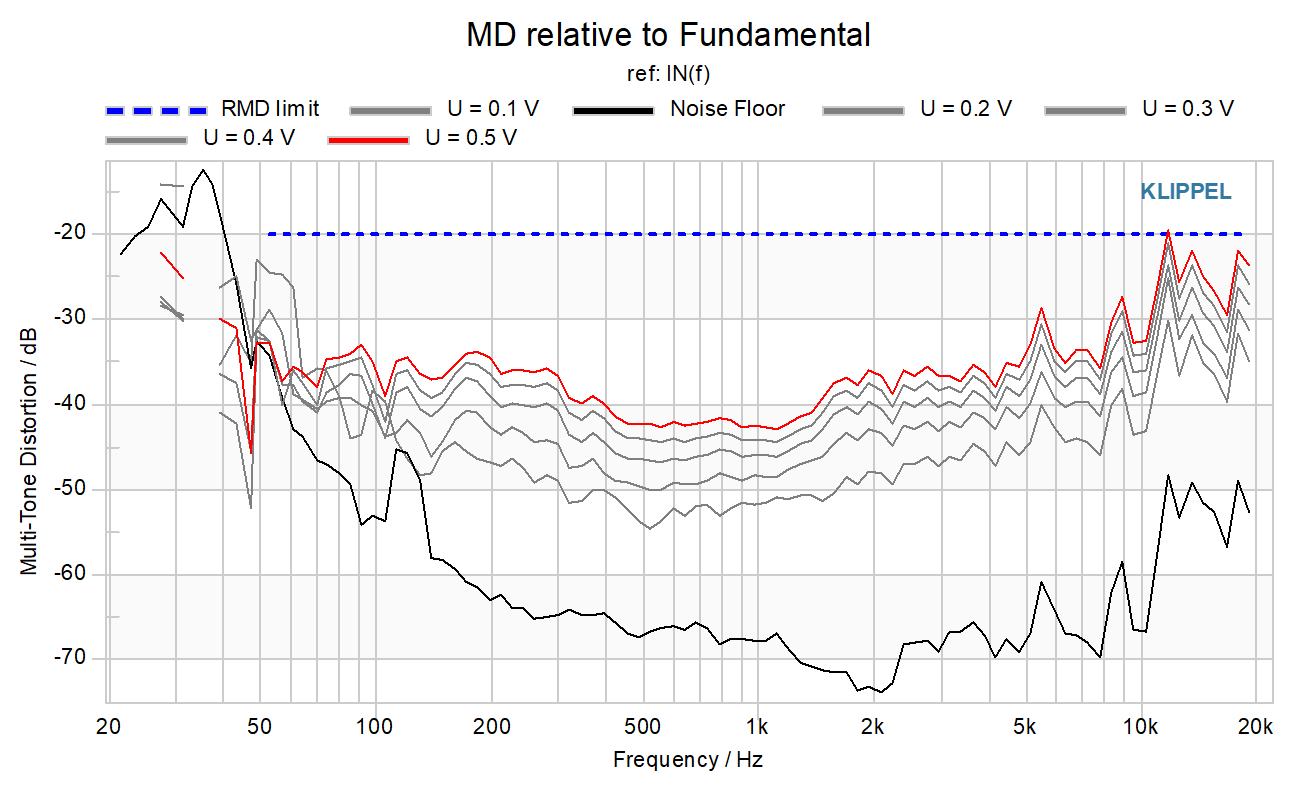
MTON module uses a multi-tone signal as a stimulus, which allows the measurement of the sum of harmonic and intermodulation distortion (multi-tone distortion). This distortion curve can be seen as a fingerprint of the nonlinear loudspeaker characteristics. The windows Multi-Tone Response and Multi-Tone Distortion collects the Multi-Tone Response and Multi-tone Distortion curves measured at each input value as well as the noise floor if it is activated.
Performing a Measurement#
This part of the tutorial guides through a first measurement. As a typical example, the default MTON operation corresponding with a simple measurement will be used.
Hardware Setup#
The measurement requires the Distortion Analyzer 2 or the Klippel Analyzer 3 hardware. Connect the cables with the following setup according to the type of device under test.
Passive Speaker#
Connect the Klippel Analyzer with the external amplifier (OUT1 to Amplifier Input, Amplifier Output to Amplifier Connector of the analyzer) or use the internal amplifier of KA3 if AMP card is available.
Connect the Analyzer with the driver. Use a Speaker cable and connect Speaker 1 output with the driver terminals.
Connect a microphone to IN1.
Connect the Analyzer via USB to a Computer.
Connect the power supply to Analyzer.
Switch the hardware unit on.
Active Speaker#
Connect the Analyzer with the DUT. (OUT1 output with Input of the speaker).
Connect microphone signal output to IN1.
Connect Analyzer via USB to a Computer.
Connect the power supply to Analyzer.
Switch the hardware unit on.
Note
For active speakers, it is not possible to measure the increase of voice coil temperature.
Create a Multi-Tone Measurement Operation#
Create a new database. Create an empty object (Edit => New Object…).
MTON Measurement Setup#
Create a new MTON Multi-Tone Measurement operation and select the MTON (default settings) template.
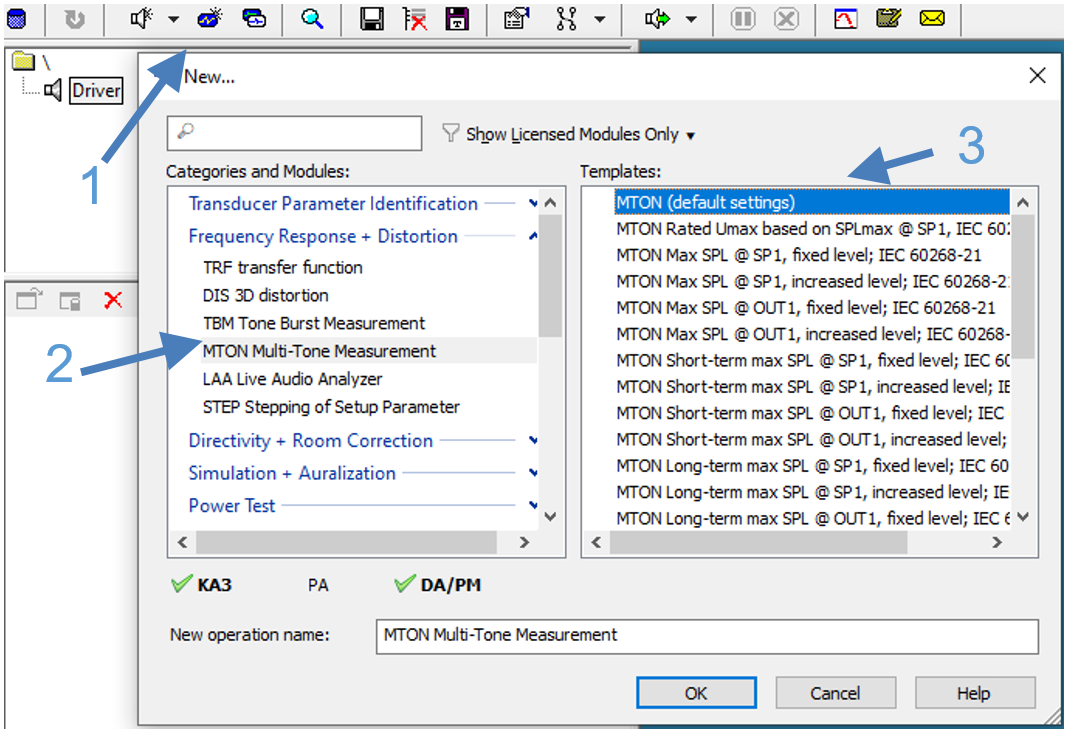
Open the Properties Page to configure the operation. To run a successful measurement, please check the output and input routing settings and the measurement voltage according to your setup.
Start Measurement#
After checking all connections, start the measurement by clicking on the start button  . If
control level is done at Out, a warning is shown that the voltage defined is applied at the input
of amplifier.
. If
control level is done at Out, a warning is shown that the voltage defined is applied at the input
of amplifier.
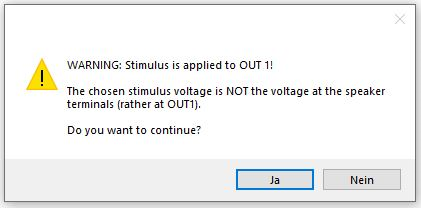
After clicking OK the operation will start.
MTON Reference#
Overview#
MTON module offers different measurement modes and stimulus settings to provide a high flexibility of test signals and measurement procedures.
While the Single Measurement mode performs a single multi-tone measurement, the Multiple Measurements mode produces an automatic test sequence to obtain the maximum signal values limited by user-defined thresholds considering driver compression, multi-tone distortion, and temperature increase.
Measurement Modes#
Single Measurement#
The single measurement mode performs a single multi-tone measurement. SPL value as well as the spectra of all input signals, frequency response, transfer function, and multi-tone distortion are measured in this mode.
Multiple Measurements#
The multiple measurements mode provides an automatic test sequence limited by user-defined thresholds considering driver compression, multi-tone distortion, and temperature increase of the voice coil. The measurement is finished when at least one threshold is reached or the maximum voltage is measured.
The thermal compression and the compression between the first transfer function and the next measurements are measured in addition to the spectra of all input signals and the multi-tone distortion. Several result values as SPL, voltage measured at terminals or maximum compression measured are summarized in a table.
The voltages applied during the test sequence to the DUT can be defined using different configurations:
- Fix Step Size
User defines the minimum and maximum voltages as well as voltage step size between measurements. Both logarithmic (in dB) and linear (in V) step sizes are available.
- Repeat
User defines a constant voltage and how many repetitions are done.
- Fast Search uMax
Voltage search to reach a specified SPL value. The search is done according to the chapter 17.1.3 of standard IEC 60268-21: Indirect measurement based on SPL max [1]. Search is initialized at 20 dB below the maximum voltage allowed at the operation.
- User Defined
User defines a vector with all the voltage values to be measured.
Different protection limits are available to avoid the destruction of DUT and the measurements according to different Standards. The measurement will be stopped automatically if at least one limit is reached:
- Transfer function compression
Transfer function between two chosen signals is calculated for every measurement. Using the first measurement as the reference, the transfer function compression is calculated as:
Max compression: max value within the selected frequency range.
Mean compression: mean value calculated in the selected frequency range.
The limit according to the maximum transfer function compression can be activated and defined as a constant value for the full band or as a curve.
For more details, please refer to the section Compression Calculation.
- Multi-tone distortion
Multi-tone distortion is calculated as the energy measured in the frequency bins which are not excited by multi-tone stimulus. Two different metrics are available:
Relative multi-tone distortion: Multi-tone distortion curve relative to multi-tone response.
Total multi-tone distortion ratio: Ratio of total multi-tone distortion and total multi-tone response.
Relative multi-tone distortion protection can be defined as a constant value for the full band or as a curve, while total multi-tone distortion ratio is defined as a single value.
For more details, please refer to the section Multi-Tone Distortion.
- Increase of voice coil temperature
Re-monitoring is available for passive DUTs if voltage and current are measured. Changes in Re can be interpreted as a variation of the voice coil temperature according to a thermal model. The limit is defined as the maximum increase of the voice coil temperature allowed before stopping the measurement.
For more details, please refer to the section Temperature Monitoring.
Stimulus Signal#
Stimulus Types#
The MTON module offers two different types of multi-tone stimulus:
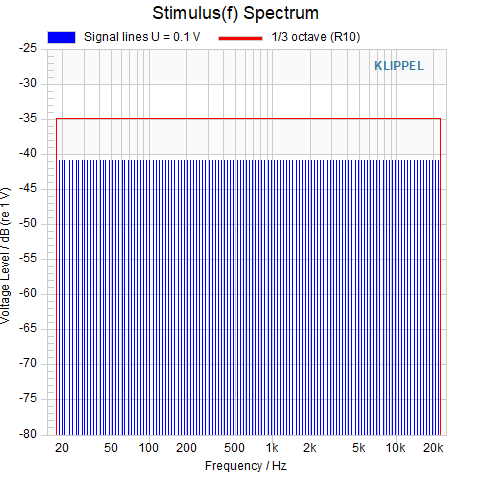
Sparse Multi-Tone#
The default sparse multi-tone is defined according to IEC 60268-21 Standard [1]. It allows the measurement of the multi-tone distortion in the frequency bins which are not excited.
The number of signal lines which comprises the sparse multi-tone depends on the resolution per octave and both the lowest and the highest stimulus frequencies.
Since the line density of the sparse multi-tone spectrum is defined according the resolution per octave, the lines are spaced logarithmically along the frequency axis. Consequently, the sparse multi-tone has a band spectrum similar to the pink noise.
Dense multi-tone#
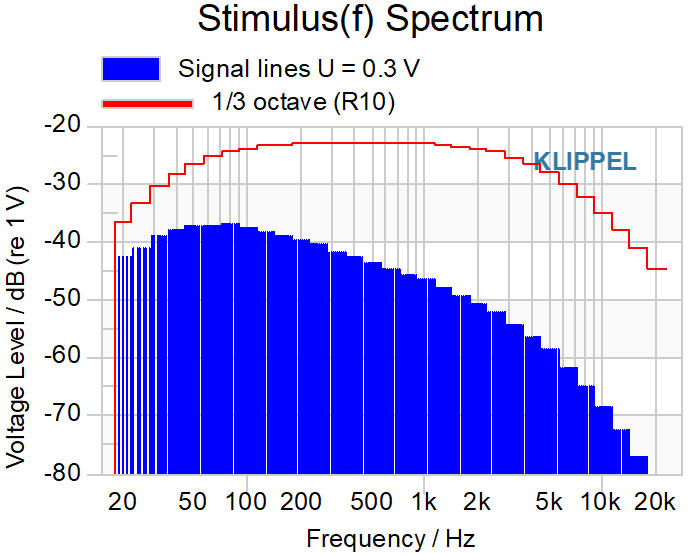
The dense multi-tone fills all the frequency bins between the lowest and the highest stimulus frequencies, which corresponds with a white noise spectrum. Since the whole frequency range of the stimulus is excited, it is only possible to measure the distortion in the frequency range above the highest stimulus frequency.
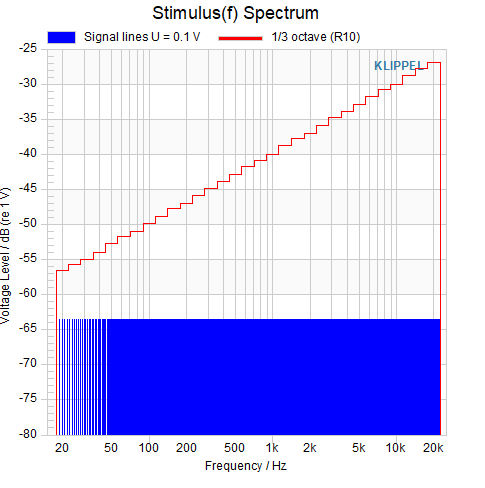
For more details about multi-tone stimulus, please refer to the section Stimulus definition.
Multi-Tone Properties#
The multi-tone signal is characterized by a high flexibility on its parameters, which offers a wide range of possibilities to custom the stimulus. As an example, a slight variation in the amplitude shaping of the signal lines, the insertion of low-energetic distortion at some free bins or the optimization of the pseudo-random phase generator can be applied to modify some specific signal characteristics as the crest factor or the kurtosis.
The MTON module offers several ways to customize the measurement stimulus:
- Default
Multi-tone stimulus is defined according to IEC 60268-21 Standard [1].
- Import LCG Parameters
Parameters of the Linear Congruential Generator (LCG) required to generate the pseudo-random phase of the tones can be modified.
- Search Optimal Seed
Automatic search for the optimal LCG seed to reach a desired crest factor value. This mode is only available for sparse multi-tone signals.
- General MT Generator
Amplitude of multi-tone signal lines is slightly modified and new low-energetic lines are added to the stimulus to reach the desired crest factor.
Input Signals#
Supported signals are:
Input Signal |
Simultaneous Captured |
Connector |
|---|---|---|
Line / Microphone |
1 |
IN |
Voltage |
1 |
SPEAKER |
Current |
1 |
SPEAKER |
Displacement |
1 |
Laser IN |
Note
Line / Microphone Signals share input connectors. Line signals can be configurated for microphone usage.
For more details regarding the routing, please refer to the Hardware Manual.
Property Pages#
Property Pages and Setup-Categories#
Select the MTON operation in the project window, and click the  “View properties”
button. Here is a short summary of the Property Pages and Setup-Categories:
“View properties”
button. Here is a short summary of the Property Pages and Setup-Categories:
- Info
The Info page allows the user to add a comment to the measurement. For details, please refer to the dB-Lab manual.
- Configuration
The MTON Measurement Mode is selected on this page.
- Stimulus
Stimulus-specific settings, such as frequency range, signal duration, voltage, and amplitude shaping.
- Input / Processing
Defines the input channels and processing-related parameters (such as transfer function, multi-tone distortion, and others).
- Limits
Limits settings available in Multiple Measurements Mode.
- Display / Export Signal
The Display / Export Signal Page allows the user to save the multi-tone stimulus in a WAV file and to configure the display functionality
- Im/Export
The Im/Export Page allows the user to import the setup of another MTON operation.
Configuration#
- Measurement Mode
Possible values:
Single Measurement
Multiple Measurements
MTON Measurement Mode. For details, please refer to section Measurement Modes.
Stimulus#
Frequency#
- Min Frequency
- Min Frequency in HzRange: \(0 < f_{\text{min}} < f_{\text{max}}\)
Lowest tone of multi-tone stimulus
- Max Frequency
- Max Frequency in HzRange: \(f_{\text{min}} < f_{\text{max}} < 0.418 \cdot f_{\text{sample}}\)
Highest tone of multi-tone stimulus. Since multi-tone is generated according to IEC 60268-21, highest tone is the nearest tone to this value. For details, please refer to the section Stimulus definition.
- Relative Resolution
- Range: > 0
Number of excited spectral lines of multi-tone stimulus per octave. If deactivated, a dense spectrum is generated. For details, please refer to the section Stimulus Signal.
- Sample Rate
- Sample Rate in Hz
Sample rate used for the measurement. The WAV file generated if the stimulus is exported used this sample rate too. Possible values:
48000
96000
192000
- Clock Drift Tolerance
Activates processing to avoid disturbance caused by clock drift of wireless measurements. For details, please refer to the section Wireless Measurements & Clock Drift.
- Tolerance Factor
- Range: 0 \(< \text{tolerance factor} <\) 100
Tolerance factor to minimize the leakage effect caused by clock drift of wireless measurements. For details, please refer to the section Wireless Measurements & Clock Drift.
Amplitude#
- Output Channel
Output of the signal. Possible values:
Out1
Out2
- Control Level
Specifies the type of level control. Possible values:
@ Terminals: Applies the target voltage at the speaker terminals.
@ Out: Applies the target voltage at the out connector.
- Terminal
- Range: Speaker 1, Speaker 2
If Control Level is set to @ Terminals, this defines the speaker connector where the voltage shall be applied. Possible values:
Speaker 1
Speaker 2
- Voltage
- Voltage in VRange: > 0
Voltage rms applied to speaker terminals or out connector depending on Control Level. This parameter is only available if Measurement Mode is Single Measurement or Measurement Mode is Multiple Measurements and Voltage Range Definition is Repeat.
- Voltage Range Definition
Voltage range definition if Measurement Mode is Multiple Measurements:
Fix Step Size: Voltage raises according to a fix step size.
Repeat: Multiple measurements are done using a fix voltage.
Fast Search u Max: Automatic search to reach a SPL target according to section 17.1.3 of standard IEC 60268 - 21 [1].
User Defined: User defines directly the voltage values in a vector.
Please refer to the section Measurement Modes for more details.
- Minimum Voltage
- Minimum Voltage in VRange: > 0
Lowest Voltage of the measurement sequence test if Voltage Range Definition is Fix Step Size.
- Maximum Voltage
- Maximum Voltage in VRange: > umin
Highest Voltage allowed if Measurement Mode is Multiple Measurements or Fast Search u Max. This voltage is always applied to the DUT if the measurement limits or SPL target value are not reached before.
- Voltage Step Definition
Voltage step size definition if Voltage Range Definition is Fix Step Size:
Logarithmic [dB]: Logarithmic increase of voltage specified in dB.
Linear [V]: Linear increase of voltage specified in V.
- Voltage Step Size
- Voltage Step Size in dB or VRange: ≥ 0.1 dB; ≥ 0.001 V
Voltage step size in dB or V depending on Voltage Step Definition.
- Voltages
- Voltages in VRange: > 0
One column vector of voltages if Voltage Range Definition is User Defined.
- Shaping
Shaping type applied to multi-tone stimulus:
1/3 Octave Bands (R10): Shaping is defined in third-octave bands. Relative Resolution shall be ≥ 3 to assure at least one line per band. In addition, the lowest and highest lines of multi-tone stimulus are set at edges of F Min und F Max bands.
Continuous Shaping: Shaping curve.
Not used: Amplitude shaping is disabled. The shaping curve is shown at Stimulus Shaping chart, which is available if Shaping is enabled.
- Shaping 1/3 Octave Band
Available shaping curves if shaping is 1/3 octave Bands (R10):
Pink Noise
White Noise
IEC 60268 [1]
CEA 2034 – A [3]
EIA 426 – B [4]
User Defined
- Shaping Curve
- Shaping Curve in [Hz, dB]
User’s defined stimulus shaping curve if Shaping is Continuous Shaping or Shaping 1/3 Oct. Band is User Defined. Shaping is specified as a 2-columns matrix. The first column corresponds with frequency in Hz and the second column is shaping in dB. If Shaping is Shaping 1/3 Octave Band, curve is interpolated to 1/3 octave bands.
Note
The frequency range of the shaping curve restricts the stimulus bandwidth. Avoid this by defining an identical or wider range for the shaping curve than for the stimulus.
A shaping curve must not contain any non-numerical data such as comments. When using copied curve data from other charts, delete the curve header before applying the data.
See also
Timing#
- Time
- Time in sRange: 0.04 \(< t \leq\) 5
Stimulus length.
- Preloops
- Range: ≥ 0
Note
Measurements with Klippel Distortion Analyzer (DA2) require at least 1 preloop.
- Skip Preloops in 1st Measurement
Skip loops in 1st measurement to avoid the heating of the DUT if Measurement Mode is Multiple Measurements.
- Averaging
The number of measurement repetitions averaged to reduce measurement noise.
- Noise Floor and DC
Activate noise floor and DC offset measurement. Its duration depends on Time and Averaging parameters and is identical to the test measurement duration. See Noise Floor and DC offset measurement.
- Pause
- Pause in sRange: ≥ 0
Pause between measurements to cool down the DUT if Measurement Mode is Multiple Measurements.
Multi-Tone#
- Multi-Tone Properties
Special multi-tone signal properties:
Default: Pseudo-random phase of tones defined according to IEC 60268-21 standard [1].
Import LCG Parameters: User defines the parameters of Linear Congruential Generator (LCG) to generate the phase of tones.
Search Optimal Seed: Automatic seed search to reach a defined crest factor target.
General MT Generator: Non-linear process to reach a crest factor target.
For details, please refer to the section Multi-Tone Properties.- LCG Multiplier (a)
- Range: 0 \(< a < m\)
A multiplier of pseudo-random phase generator. Only available for sparse multi-tone stimulus if Multi-Tone Properties is Import LCG Parameters.
- LCG Increment (c)
- Range: 0 \(\leq c < m\)
Increment of pseudo-random phase generator. Only available for sparse multi-tone stimulus if Multi-Tone Properties is Import LCG Parameters.
- LCG Modulus (m)
- Range: > 0
Modulus of pseudo-random phase generator. Only available for sparse multi-tone stimulus if Multi-Tone Properties is Import LCG Parameters.
- LCG Seed (n0)
- Range: 0 \(\leq n_{0} < m\)
Seed of pseudo-random phase generator if Multi-Tone Properties is Import LCG Parameters.
- Search Duration
- Search Duration in sRange: > 0
Duration of seed search if Multi-Tone Properties is Search Optimal Seed.
- Crest Factor
- Crest Factor in dBRange: 3 \(\leq C \leq\) 18
Crest factor target if Multi-Tone Properties is Search Optimal Seed or General MT Generator.
- Search Seed
Button to initialize search of optimal seed if Multi-Tone Properties is Search Optimal Seed. It is only active if stimulus properties are valid.
- Max. Signal to Distortion
- Max. Signal to Distortion in dBRange: 0 \(\leq max\: S/D \leq\) 40
Maximum signal-to-distortion ratio allowed in non-linear signal generator to reach crest factor target.
- Display Stimulus
- Max. Signal to Distortion in dBRange: 0 \(\leq max\: S/D \leq\) 40
Button to generate measurement stimulus if stimulus properties are valid and Multi-Tone Properties is General MT Generator.
Input / Processing#
Input#
- Voltage / Current
Activates monitoring of Voltage & Current.
- Input
Speaker channel input for Voltage & Current capturing. Can only be set if Control Level was not set to @ Terminals. Possible values:
Speaker 1
Speaker 2
- Displacement
Activates monitoring of the Displacement.
- Input Sensor
Activates monitoring of input sensor IN.
- Channel
Channel of input sensor if signal monitoring is activated. Possible values:
IN1
IN2
- IN Room Correction
- IN Room Correction in [Hz, dB]
Transfer function to compensate room in microphone measurements. It is defined according to IEC 60268-21 standard [1].
Transfer function#
- Determine Transfer Function
Activates / deactivates transfer function determination.
- Numerator Signal
The numerator signal for the determined transfer function is only available if Transfer Function is activated. Possible values:
U
I
IN
X
- Denominator Signal
The denominator signal for the determined transfer function is only available if Transfer Function is activated. Possible values:
Stimulus
U
I
IN
X
- Compression Calculation
Method to calculate the compression value used to protect the DUT and displayed in the table results:
Max, Full Band: Max compression value measured in the full measurement band.
Mean, Full Band: Mean compression value calculated in the full band.
Max, User Defined Band: Max compression value measured band defined between Compression: fmin and Compression: fmax.
Mean, User Defined Band: Mean compression value calculated in the band defined between Compression: fmin and Compression: fmax.
This parameter is only available if Measurement Mode is Multiple Measurements and Transfer Function is activated.
Please refer to the section Compression Calculation for more details.
- Compression: f min
- Range: 0 \(< f_{\text{Cmin}} \leq f_{\text{Cmax}}\)
The lowest frequency of compression band if Compression Calculation is Max, User Defined Band or Mean, User Defined Band.
- Compression: f max
- Range: \(\geq f_{\text{Cmin}}\)
Highest frequency of compression band if Compression Calculation is Max, User Defined Band or Mean, User Defined Band.
- Smoothing
- Range: > 0
Part of octave used for transfer function smoothing if Transfer Function is activated.
Multi-Tone Response#
- Activate Multi-Tone Response
Activates / deactivates multi-tone response measurement.
Please refer to the section Multi-Tone Distortion for more details.- Multi-Tone Signal
Multi-tone distortion signal only available if Multi-Tone Response is activated. Possible values:
U
I
IN
X
- Fundamental - Smoothing
- Range: > 0
Part of octave used for smoothing of multi-tone response only available if Multi-Tone Response is activated.
- Calculation of Relative MD
Method to calculate the spectral multi-tone distortion (MD) only available if Multi-Tone Response is activated:
Band Level relative to Fundamental: Energy ratio of multi-tone distortion to fundamental in bands defined by resolution.
Smoothed relative to Average Level: Smoothed spectral multi-tone distortion relative to the fundamental average.
Please refer to the section Multi-Tone Distortion for more details.
Resistance Monitoring#
- Monitoring Mode
Mode used for tracking of voice coil resistance Re only available if Measurement Mode is Multiple Measurements:
Custom: Configurable by the user
Off: Do not monitor voice coil resistance
Please refer to the section Temperature Monitoring for more details.- Level
- Level in dBRange: ≤ 0
Level of the pilot tones relative to measurement voltage. This parameter is only available if Monitoring Mode is set to Custom.
- Frequency
- Frequency in HzRange: > 0
Tracking frequency of the first pilot tone.
This parameter is only available if Monitoring Mode is set to Custom. - Voice Coil Material
The kind of material used for the voice coil has to be specified if known. This information is used to identify the increase in voice coil temperature from the variations of the voice coil resistance. Possible values:
Copper
Aluminum
Custom
This parameter is only available if Monitoring Mode is set to Custom.- Temperature Coefficient
- Temperature Coefficient in 1/KRange: > 0
First-order temperature coefficient used to determine the heating of the voice coil based on the voice coil resistance.
This parameter is only available if Voice Coil Material is set to Custom.
- \(R_e (\Delta T_v = 0 K)\)
- \(R_e (\Delta T_v = 0 K)\) in \(\Omega\)Range: > 0
Voice coil resistance at DC. If not known, the resistance will be determined in the first measurement.
This parameter is only available if Monitoring Mode is set to Custom.
Limits#
Transfer Function Compression#
- TF Compression Limit
Activates / deactivates transfer function compression limit only available if Measurement Mode is Multiple Measurements.
Please refer to the section Compression Calculation for more details.- Max. Compression
- Max. Compression in dB OR [Hz, dB]
Maximum transfer function compression which is allowed during the measurements if TF Compression Limit is activated. Compression is calculated as the difference in dB between the transfer function of the first measurement and the next one.
If Compression Calculation is Max, it can be defined as a single value,which is the maximum compression allowed in the full compression band or as a curve definedin a 2-columns matrix: [frequency (Hz), compression (dB)]If Compression Calculation is Mean, it is a single value, which is themaximum mean compression allowed in dB.
Relative Multi-Tone Distortion#
- Relative MD Limit
Activates / deactivates spectral multi-tone distortion limit.
Please refer to the section Multi-Tone Distortion for more details.- Max. Relative MD
- Max. Relative MD in:
dB OR % for single value results
[Hz, dB] OR [Hz, %] for curve
Maximum spectral multi-tone distortion limit only available if Relative MD Limit is activated. It can be defined as a single value, which is the maximum distortion allowed in the full band or as a curve defined in a 2-columns matrix: [Freq, MD]
The unit in dB or % depends on Multi-Tone Response parameter Unit.
Total Multi-Tone Distortion Ratio#
- Total MD Ratio Limit
Activates / deactivates total multi-tone distortion ratio limit.
Please refer to the section Multi-Tone Distortion for more details.- Max. Total MD Ratio
- Max. Total MD Ratio in dB OR %
Maximum total multi-tone distortion ratio limit only available if Total MD Ratio Limit is activated.
The unit in dB or % depends on Multi-Tone Response parameter Unit.
Increase of Voice Coil Temperature#
- Voice Coil Temperature Limit
Activates / deactivates voice coil temperature increase limit only available if Measurement Mode is Multiple Measurements.
Please refer to the section Temperature Monitoring for more details.- Max. Increase of Voice Coil Temperature
- Max. Increase of Voice Coil Temperature in KRange: > 0
Maximum increase of voice coil temperature based in Re measurements allowed if Activate Voice Coil Temperature Inc. Limit is activated.
Display / Export Signal#
Export wavefile#
- Repetitions
- Range: > 0
Number of stimulus repetitions in exported WAV file.
- RMS Level WAV File
- RMS Level WAV File in dBFSRange: ≤ 0
RMS Level of WAV file.
- Path WAV File
Export path of WAV file.
- Name WAV File
Name of exported WAV file.
- Export WAV File
Button to export WAV file only active if stimulus properties and path and WAV file name are valid.
Display#
- Display Stimulus
Button to calculate and display measurement stimulus if stimulus properties are valid.
- Multi-Tone Distortion - Unit
Unit of relative multi-tone distortion and total multi-tone distortion ratio measurements only available if Multi-Tone Response is activated. Possible values:
dB
%
- Show Intermediate Results
All measurement results are displayed if this parameter is activated. Otherwise, only the first and last measurements are shown.
This parameter is only available if Measurement Mode is Multiple Measurements.- Show Results vs
- Range: Voltage; Step
Define the X-Axis of result charts “XXX vs Measurement”. This parameter is only available if Measurement Mode is Multiple Measurements and Voltage Range Definition is not Repeat.
Result Windows#
Summary#
The general results of the measurements and stimulus properties are summarized in this window. If Measurements Mode is Multiple Measurements, the results of the last measurements are shown. In case one or more limits are reached during the measurement, the results of the last passed measurement are displayed.
H(f) Transfer Function Magnitude#
The magnitude of the transfer function which is defined by the input parameters Numerator Signal and Denominator Signal. If a compression limit is activated, it is shown. The last measurement is displayed in green color if the limit is not reached, otherwise, it is red. In addition, intermediate measurement results are shown if parameter Show Intermediate Results is activated. This result window is only visible if the parameter Determine Transfer Function is activated.
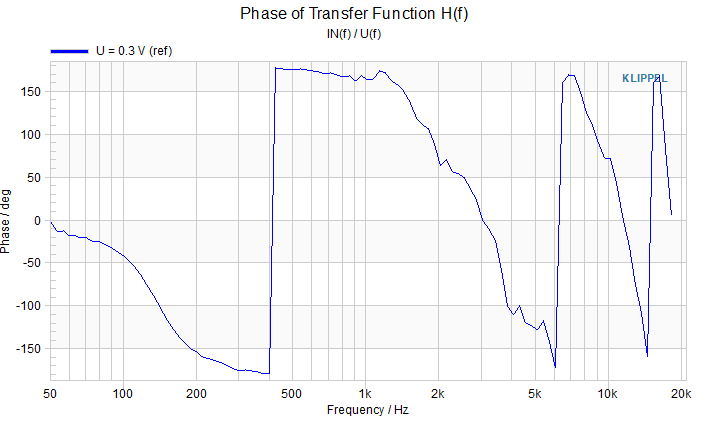
H(f) Transfer Function Phase#
The phase of transfer function defined according to input parameters Numerator Signal and Denominator Signal. This result window is only visible if the parameter Determine Transfer Function is activated.
C(f) Compression#
Compression of transfer functions referenced to the first measurement is shown if parameter Measurements Mode is Multiple Measurements and Determine Transfer Function is activated. If the compression limit is activated, the compression limit is shown. The last measurement is displayed in green color if the limit is not reached, otherwise, it is red. In addition, intermediate measurement results are shown if parameter Show Intermediate Results is activated.
Multi-Tone Response#
All absolute curves related to multi-tone response are displayed in this window: fundamental, multi-tone distortion, and noise floor if activated. In addition, intermediate measurement results are shown if parameter Show Intermediate Results is activated. This window is only visible if the parameter Activate Multi-Tone Response is activated.
Multi-tone Distortion#
Relative multi-tone distortion and noise floor curves are displayed. If Relative MD Limit is activated, the limit curve is shown. The last measurement is displayed in green color if limit is not reached, otherwise, it is red. In addition, intermediate measurement results are shown if parameter Show Intermediate Results is activated. This window is only visible if the parameter Activate Multi-Tone Response is activated.
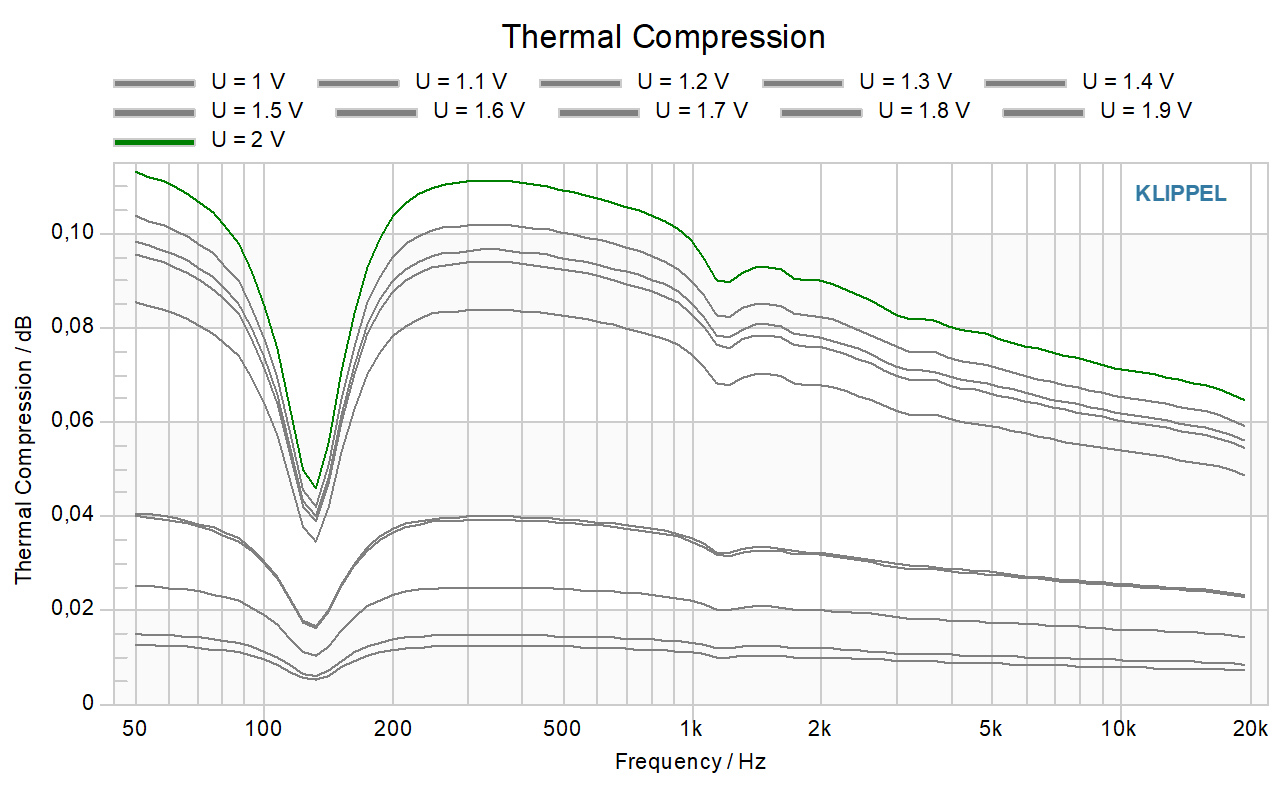
TC(f) Thermal Compression#
Thermal compression curves based on resistance monitoring are displayed in this window, which is only visible if parameter Monitoring Mode is Custom.
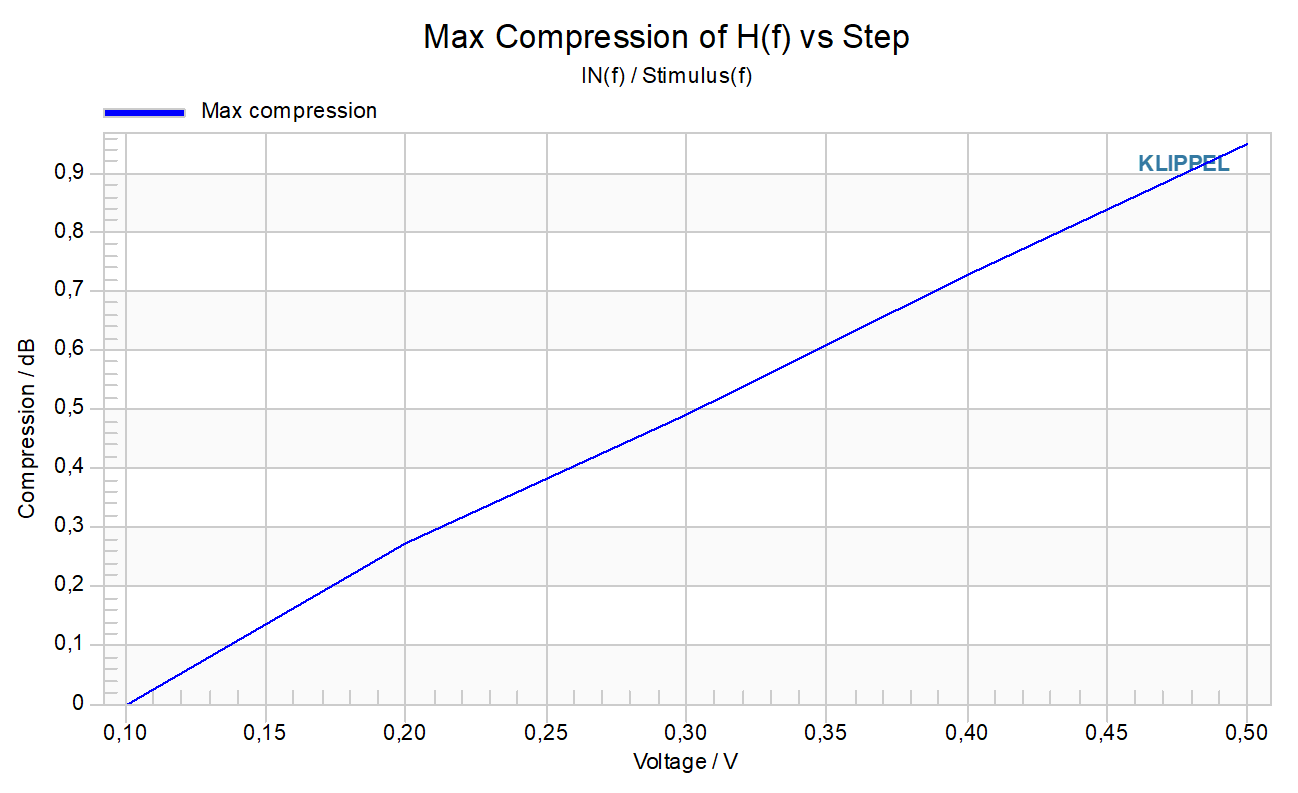
Max Compression vs Step#
The maximum compression value of each measurement is displayed to track the compression progress. X-axis can be defined as stimulus voltage or measurement iteration according to parameter Show Results vs. This window is only visible if parameter Measurement Mode is Multiple Measurements and Determine Transfer Function is activated.
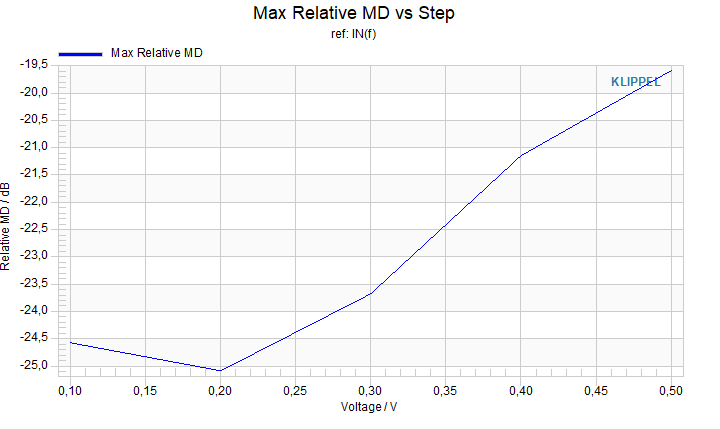
Max Relative MD vs Step#
The max value of the relative multi-tone distortion of each measurement is displayed to track the distortion variation. Y-axis is defined according Multi-Tone Response parameter Unit, X-axis can be defined versus stimulus voltage or measurement iteration according to parameter Show Results vs. This window is only visible if parameter Measurement Mode is Multiple Measurements and Activate Multi-Tone Response is activated.
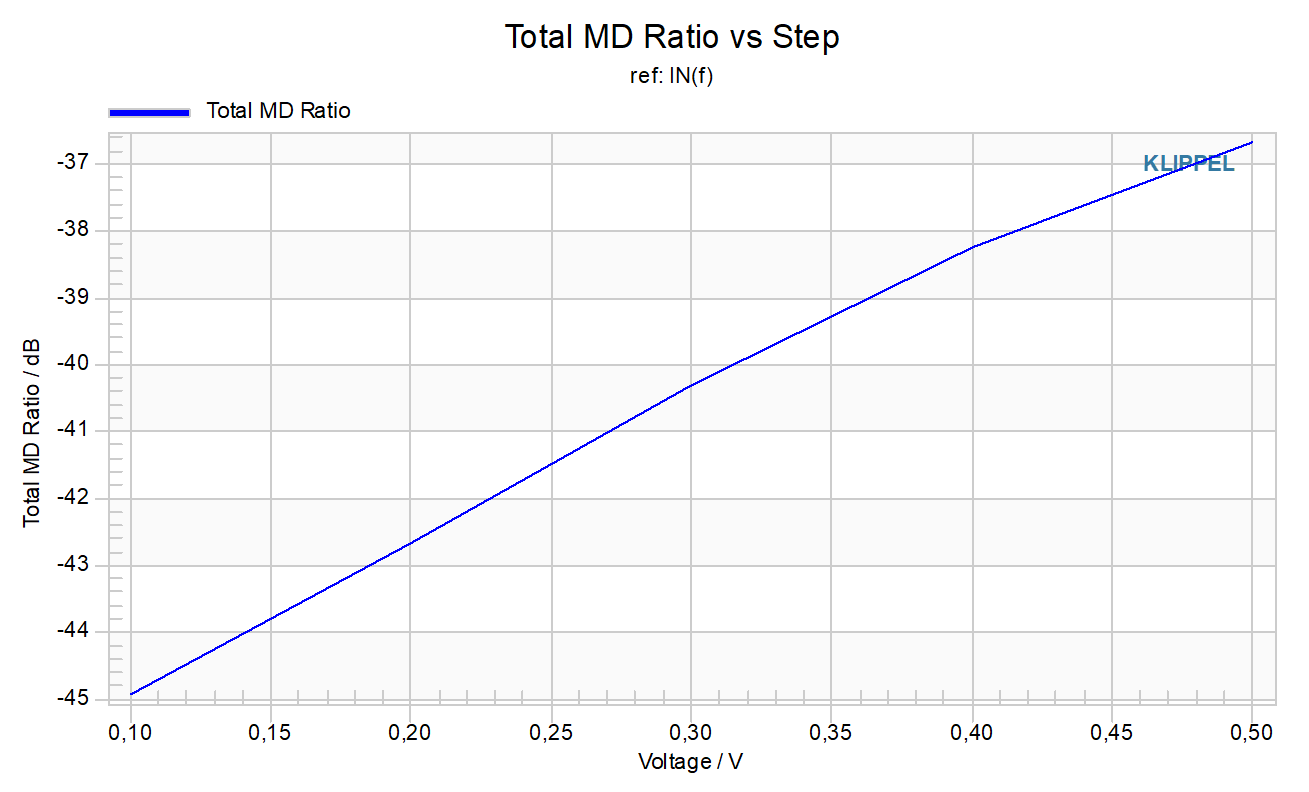
Total MD Ratio vs Step#
The total Multi-Tone Distortion Ratio of each measurement is displayed to track the distortion variation. Y-axis is defined according Multi-Tone Response parameter Unit, while X-axis can be defined versus stimulus voltage or measurement iteration according to parameter Show Results vs. This window is only visible if parameter Measurement Mode is Multiple Measurements and Activate Multi-Tone Response is activated.
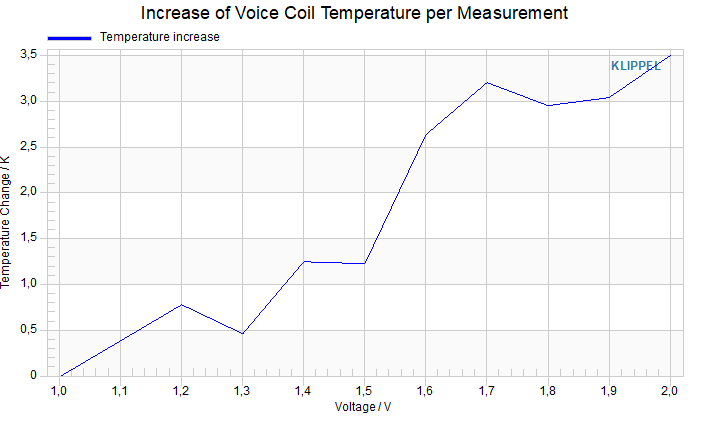
ΔT Temperature Increase#
An increase of voice coil temperature based on resistance monitoring is displayed versus stimulus voltage or measurement iteration according to parameter Show Results vs. This result window is only visible if parameter Monitoring Mode is Custom.
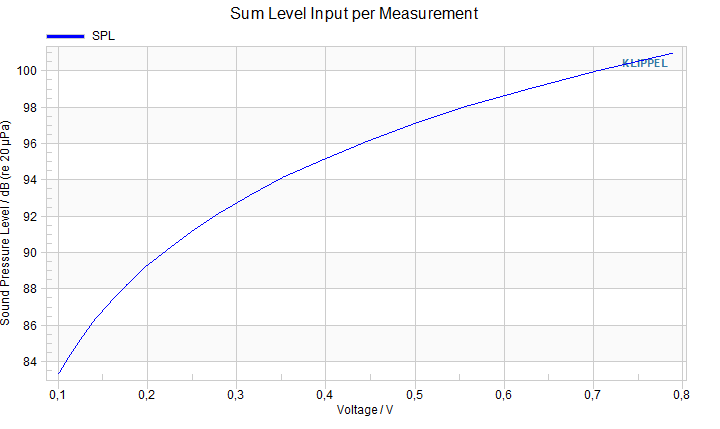
Sum Level Input#
Sum level values of input sensor are displayed versus stimulus voltage or measurement iteration according to parameter Show Results vs. Y-xis depends on sensor connected to IN input of hardware: SPL if microphone sensor, V if no sensor is available. This result window is only visible if parameter Measurement Mode is Multiple Measurements and Input Sensor is activated.
Max Displacement vs Step or voltage#
Maximum displacement is displayed versus stimulus voltage or measurement iteration according to parameter Show Results vs. This result window is only visible if parameter Measurement Mode is Multiple Measurements and Input / Displacement is activated.
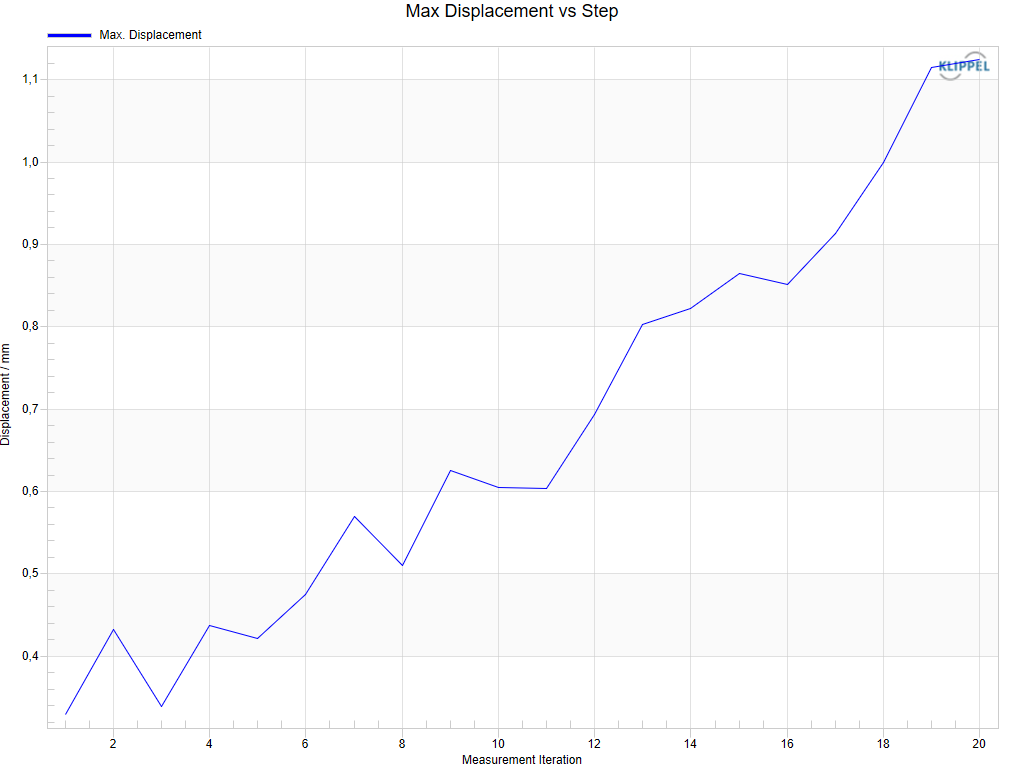
The plot may be shown versus stimulus voltage or measurement iteration (step) according to parameter Show Results vs.
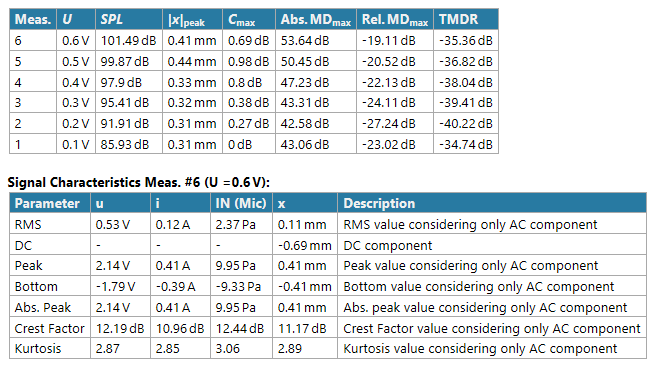
Table Detailed Results#
Collect result values of all measurements. This table is especially useful if Measurement Mode is Multiple Measurements. DC Component is available only for displacement measurements in current MTON.
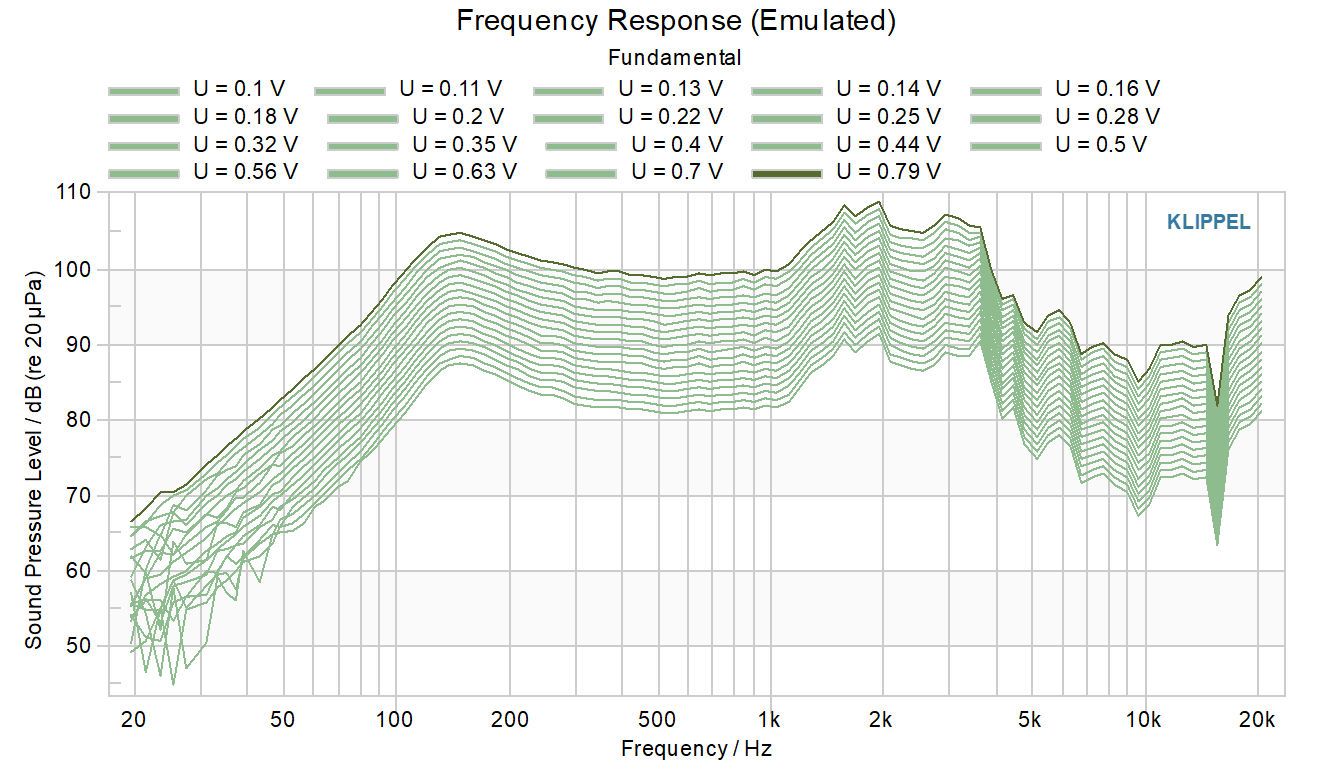
Frequency Response (Emulated)#
Strictly speaking, the frequency response according to IEC 60268-21 reflects the fundamental (sound pressure level) response to a narrow band excitation signal with varying frequency (e.g., sinusoidal sweep) at constant excitation level. Since this parameter is commonly known and easy to interpret, it can be emulated based on the transfer function between the microphone signal and the stimulus normalized with the RMS stimulus Voltage.
Although the emulated frequency response neglects any stimulus-dependent, nonlinear effects such as compression, the results are comparable to a sinusoidal measurement for the same stimulus RMS level at small amplitudes.
In addition, from the frequency response is calculated the effective frequency range according to IEC 60268-21. This frequency range is defined as the range of frequencies, for which the frequency response is not more than 10 dB below the mean sound pressure level. The effective boundaries of the frequency range are shown in the tables displayed in the Summary and in the Table Detailed Results windows.
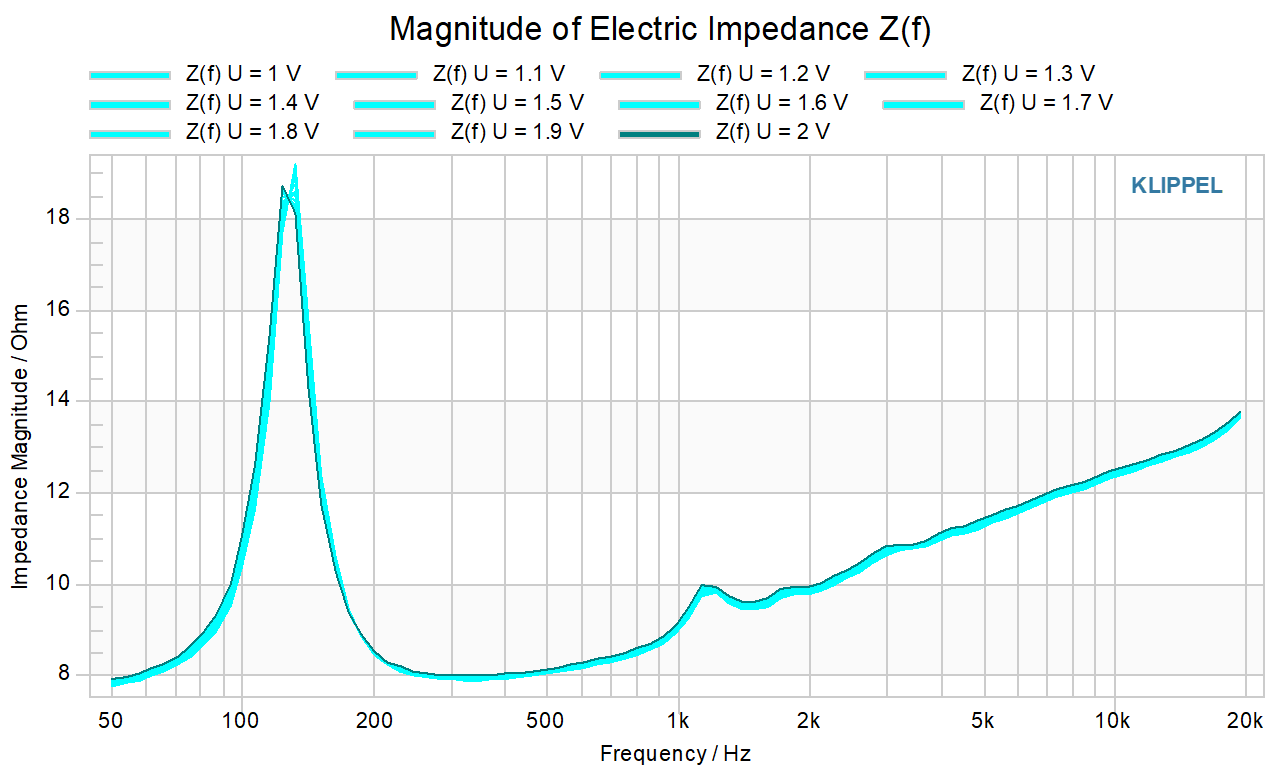
Impedance Magnitude#
The magnitude of electric impedance is calculated from voltage and current measurements at terminals. This result window is only visible if parameter Voltage / Current is activated.
Stimulus, I(f), U(f), In (f), X(f) Spectrums#
Measured signals are displayed in the frequency domain in these results windows. In addition, noise and distortion and noise floor (if measured) are displayed for each signal. The result windows of deactivated signals in the input parameter page Input / Processing are not shown.
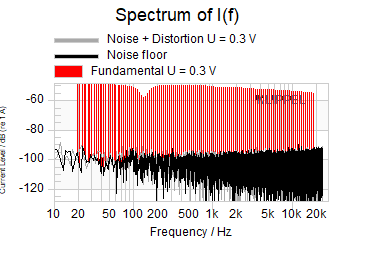
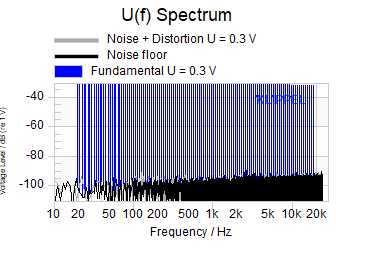
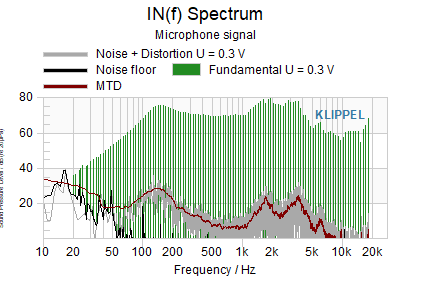
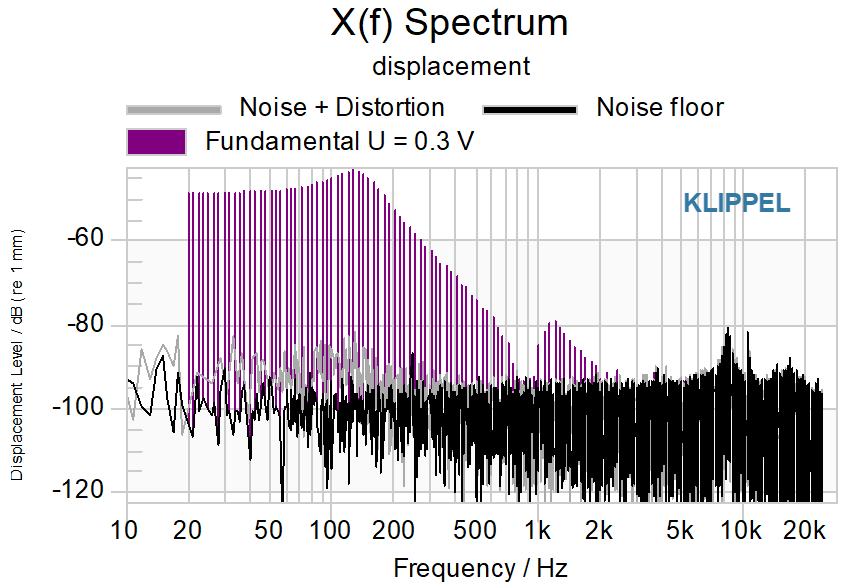
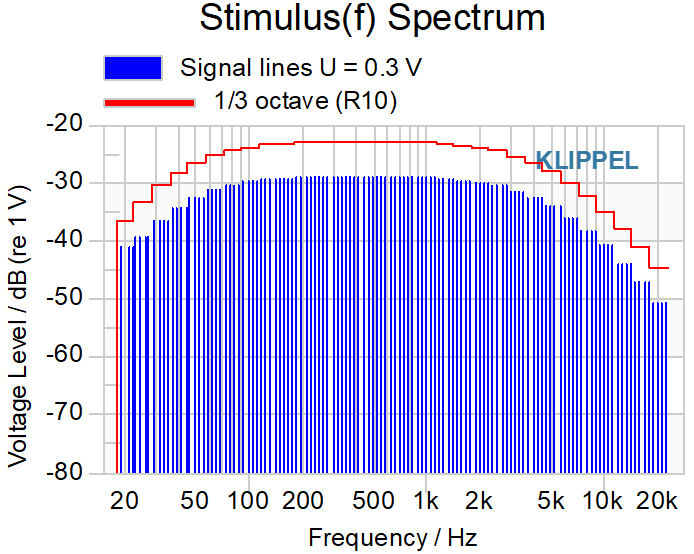
In addition to the stimulus spectrum as signal lines, the spectrum in 1/3 octave bands (R10) as well as the pilot tones if Monitoring Mode is Custom and the signal distortion if the Multi-Tone Properties parameter is General MT Generator are displayed. For details, please refer to the section Stimulus definition.
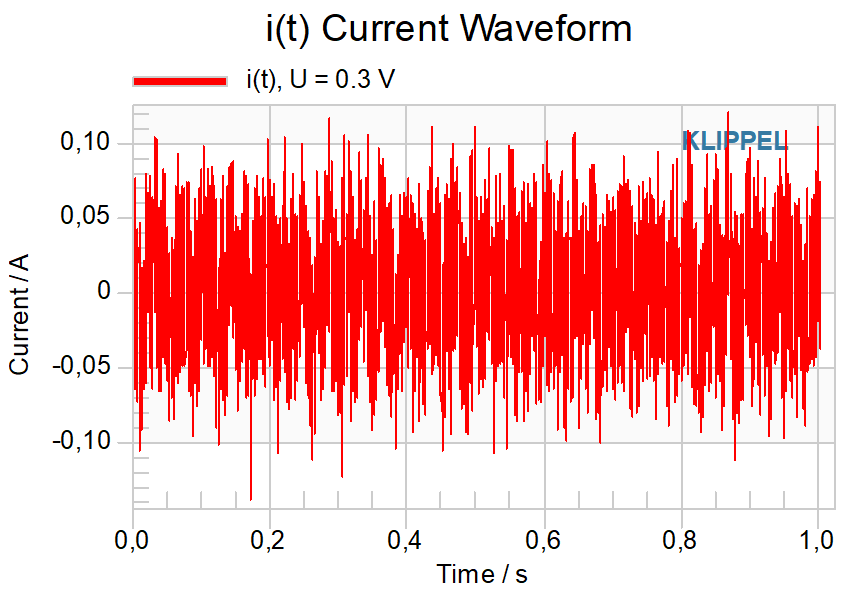
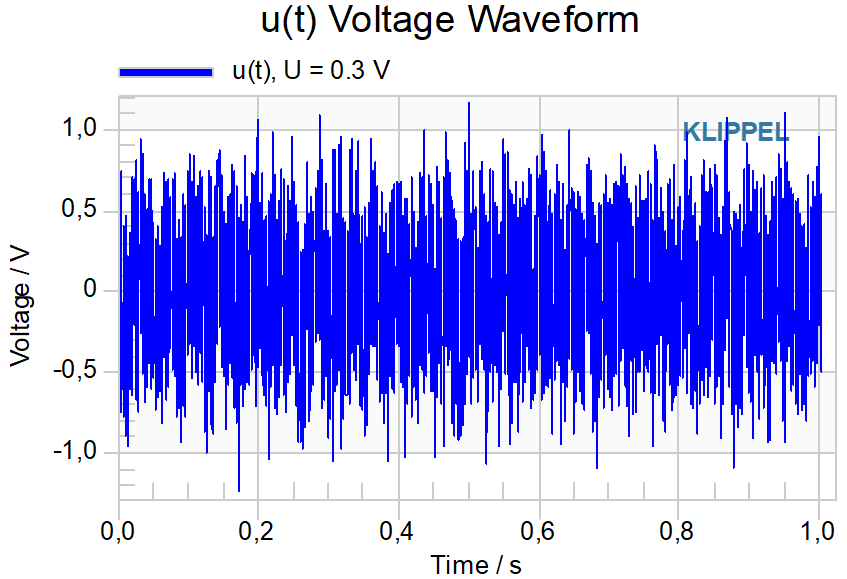
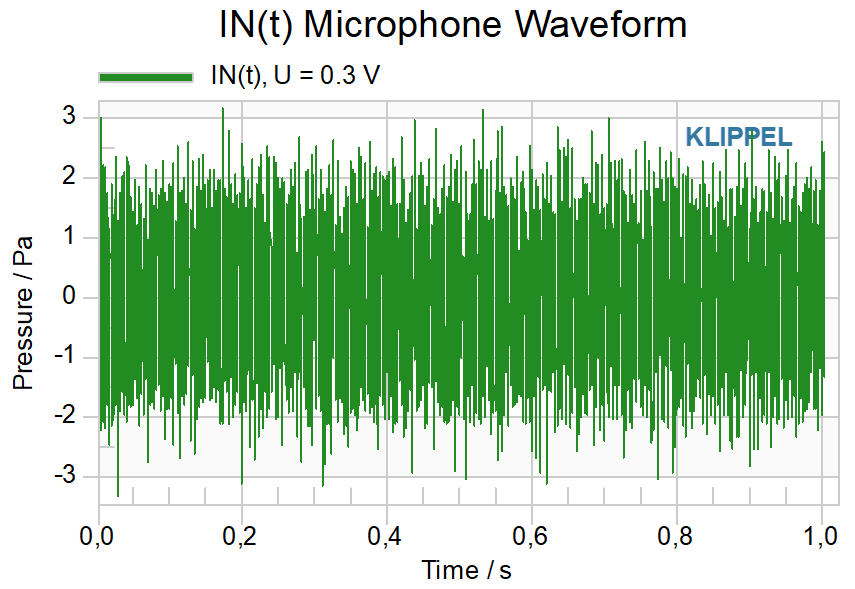
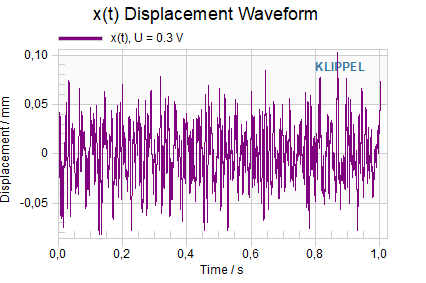
Stimulus, IN(t), i(t), u(t), x(t) Waveforms#
Stimulus as well as measured signals are displayed in the time domain in these results windows. Result windows of deactivated signals in the input parameter page Input / Processing are not available.
PDF Signals#
Normalized probability density functions of stimulus and last measured signals are displayed.
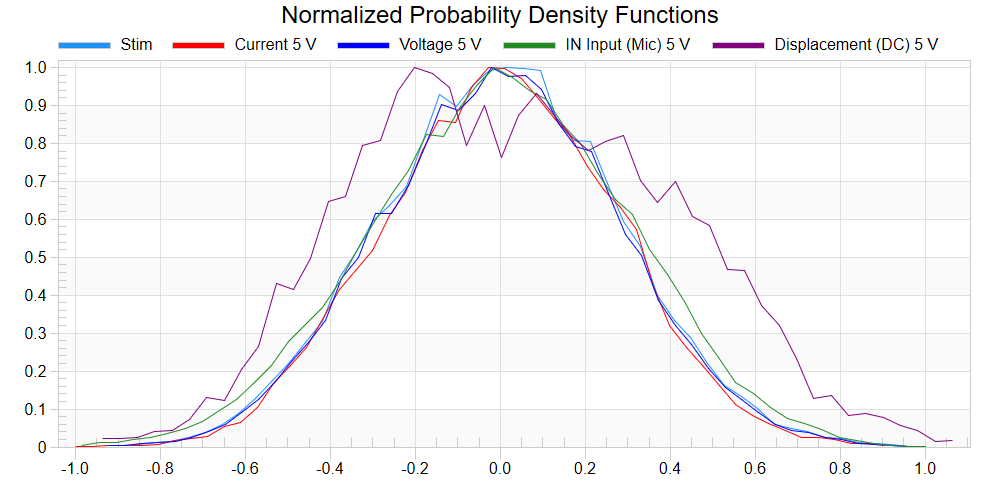
Especially the PDF of displacement may reveal important information:
- With Noise Floor and DC Measurement:
The mean excursion from the noise floor measurement is considered as the rest position (\(x=0\)). Relative to this value the PDF(x) is centered. The curve label contains (DC) in this case. See the example above. Note, that the PDF(X) is still normalized in displacement to allow comparison with other states and their PDF. A DC-Shift during the measurement which might be caused by nonlinear processes in the test object is therefore visible as an asymmetric PDF(X) or as an offset in the PDF(X).
- Without Noise Floor and DC Measurement:
The excursion range is normalized in such a way, that the excursion minimum is mapped to \(-1\) while the excursion maximum is mapped to \(+1\). The curve label contains (AC) in this case. A DC-Shift during the measurement which might be caused by nonlinear processes in the test object is not visible.
Room Correction Curve#
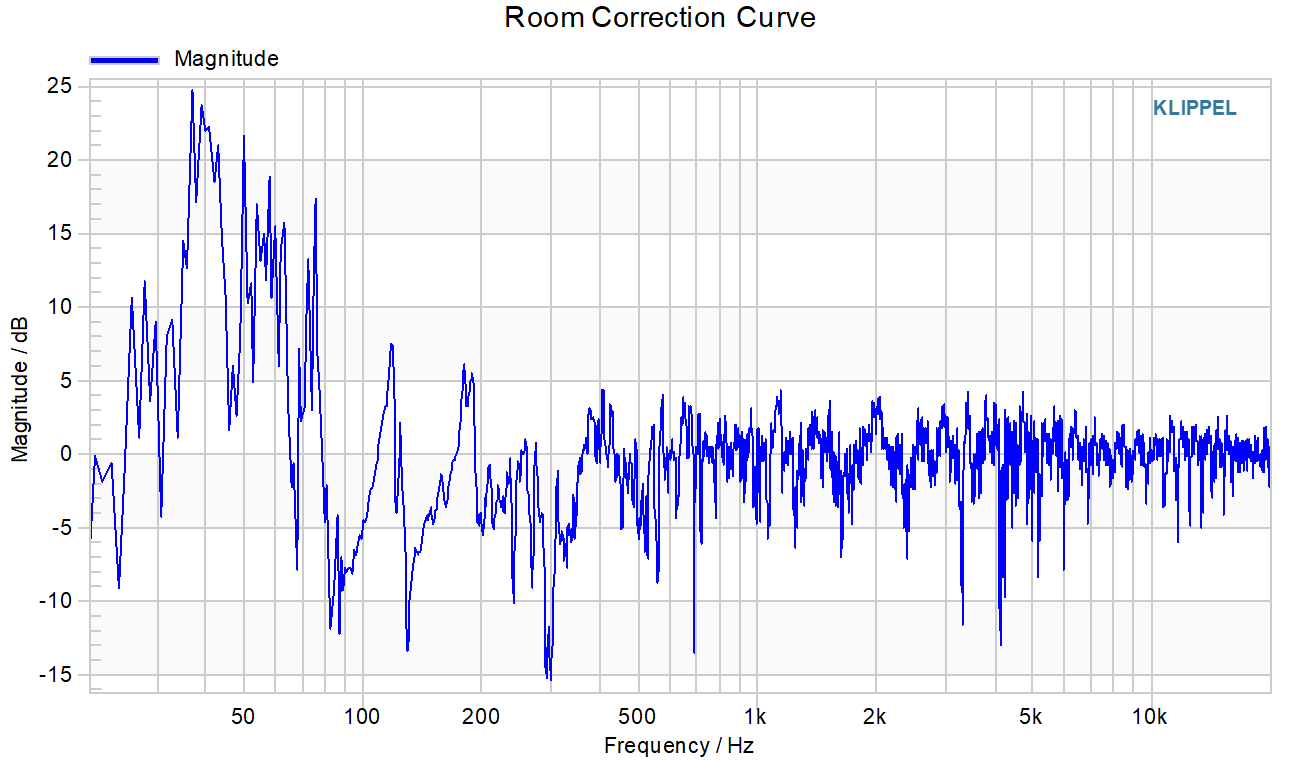
The magnitude of the room correction curve is displayed. This window is only visible if parameter Room Correction Curve is not empty.
Stimulus Shaping#
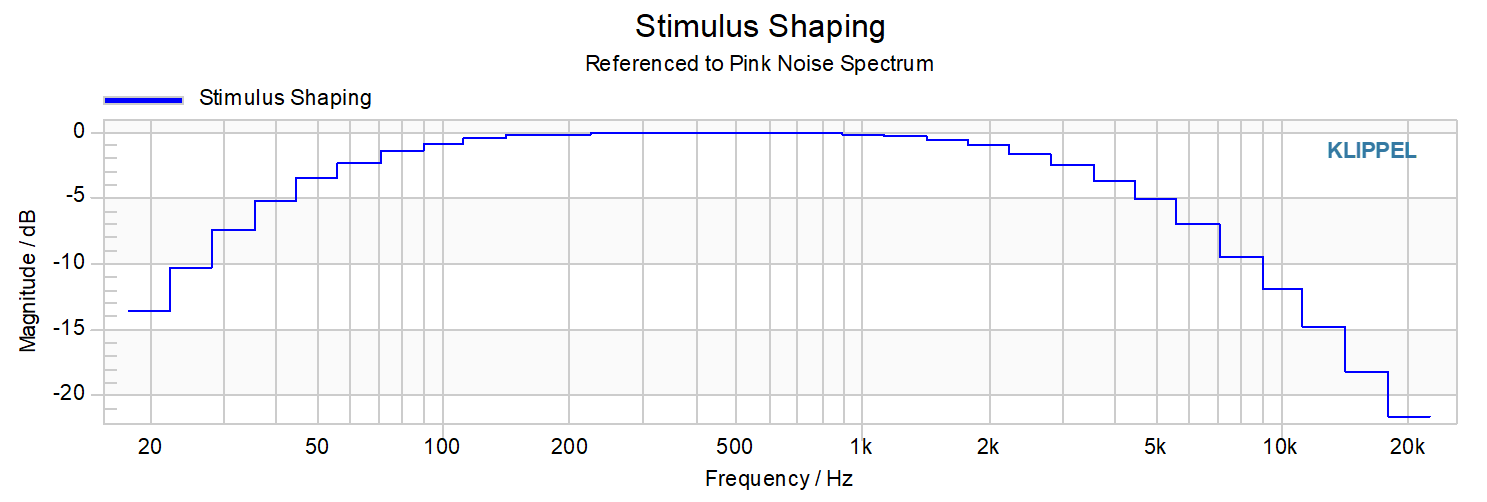
Shaping curve applied to stimulus referenced to pink noise spectrum. This window is only visible if parameter Shaping is 1/3 Octave Bands (R10) or Continuous Shaping Curve.
For any shaping applied, the stimulus is scaled in such a way that the specified rms voltage is applied at the output (speaker terminals or line output). As a consequence, some frequency ranges may be amplified when using stimulus shaping related to an unshaped setup.
Note
A user defined shaping curve is always down-sampled to a 3rd octave resolution, independent from the actual resolution of the imported curve. So it cannot be used to control higher resolution of the stimulus.
Shaping is calculated as constant 3rd octave steps for 1/3 Octave Bands (R10) while it is interpolated between 3rd octave center frequencies for Continuous Shaping Curve.
A shaping curve must not contain any non-numerical data such as comments. When using copied curve data from other charts, delete the curve header before applying the data.
Since the sparse multi-tone stimulus has a power spectral density similar to the pink noise, the amplitude shaping of the stimulus is similar to the shaping curve. Otherwise, the dense multi-tone stimulus has a power spectral similar to the white noise therefore the stimulus amplitude is lower at higher frequencies (where more signal lines per octave are excited). For details, please refer to the section Stimulus definition.
See also
See also Amplitude Definition.
Malfunction and Troubleshooting#
Overview#
This chapter will provide information that can help you solve common problems that occur with the Klippel Analyzer and the MTON module. The software generates a variety of warnings automatically if the signals are badly conditioned or a malfunction is detected. Some warnings may be neglected but it is always recommended to find out the cause of the problem.
If you cannot find a description here that matches your problem, check the Malfunction and Troubleshooting section in dBLab Manual or contact us via KLIPPEL support.
Error Messages#
Input Parameter Error#
If the operation is run when there are errors in the input parameter page, the error message of the parameter will be shown in a window and the operation will be aborted.
Measurement aborted by user#
Error displayed if operation is aborted manually by user.

Hardware Configuration / Limitation#
Klippel Analyzer KA3:#
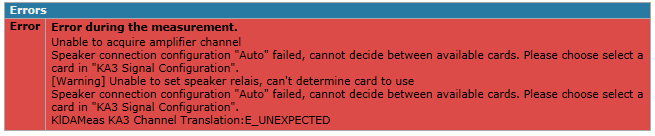
- KA3 Signal Configuration Output is set to automatic
KA3 cannot decide between the available cards.

- KA3 Signal Configuration Speaker Connected Via: is set to automatic
KA3 cannot decide between the available cards.
- The amplifier output is not connected to KA3 AMP port
The error is produced if the control level of measurement voltage is done at speaker terminals, and the AMP port does not measure any signal. This error appears if the amplifier and/or the KA3 output connections are wrong.

Klippel Distortion Analyzer DA2#
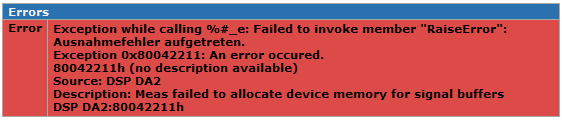
- DA2 cannot allocate the measurement data.
Reduce the measurement time or deactivate unnecessary sensors.
Warning Messages#
Frequency axis of compression out of range#
The frequency range defined for compression is out of the stimulus range. Compression cannot be calculated and its limit is deactivated.

Inaccurate Voice Coil Temp. Monitoring#
The signal to Noise (S/N) ratio of added pilot tone for Re Monitoring is too low. It can produce inaccurate thermal compression measurements and a wrong calculation of the voice coil temperature increase.

Max. Voltage / Max. Iterations reached#
Warning displayed if maximum Voltage or number of iterations are reached in fast search of uMax.

Appendix / Theory#
Stimulus definition#
The (sparse) multi-tone signal is defined according to standard IEC 60268-21 [1] section 8.4:
The stimulus comprises \((N + 1)\) logarithmically spaced tones with an amplitude \(A\left( f_{i} \right)\). Frequencies are calculated according to the multi-tone resolution:
Where:
\(f_{0}\): lowest tone
\(R\): Resolution (tones per octave)
\(f_{b}\): frequency basis:
A linear congruential generator (LCG) generates the pseudo-random phase of the tones:
With:
Where:
\(a\): LCG multiplier
\(c\): LCG increment
\(m\): LCG modulus
\(n_{0}\): LCG seed
Compression Calculation#
Compression is calculated from the magnitude of the transfer function, using as a reference the first measurement done:
Where:
\(C\left( n,k \right)\): Normalized magnitude of the transfer function of k-th measurement.
\(L_{H}\left( n,0 \right)\): Magnitude of transfer function of reference measurement.
\(L_{H}\left( n,k \right)\): Magnitude of transfer function of k-th measurement.
\(n\): signal line in the frequency domain
The magnitude of the complex transfer function of the fundamental lines between any measured signal is defined as:
Where:
\(L_{H}\left( n,k \right)\): Magnitude of transfer function.
\(H\left( n,k \right)\): Transfer function.
\(\text{ref}\): level reference calculated from numerator and denominator signals of transfer function:
pressure: \(1\) Pa
displacement: \(10^{- 3}\) m
voltage: \(1\) V
current: \(1\) A
Multi-Tone Distortion#
Multi-tone distortion spectrum is calculated as the energy measured in the frequency bins which are not excited by a multi-tone stimulus:
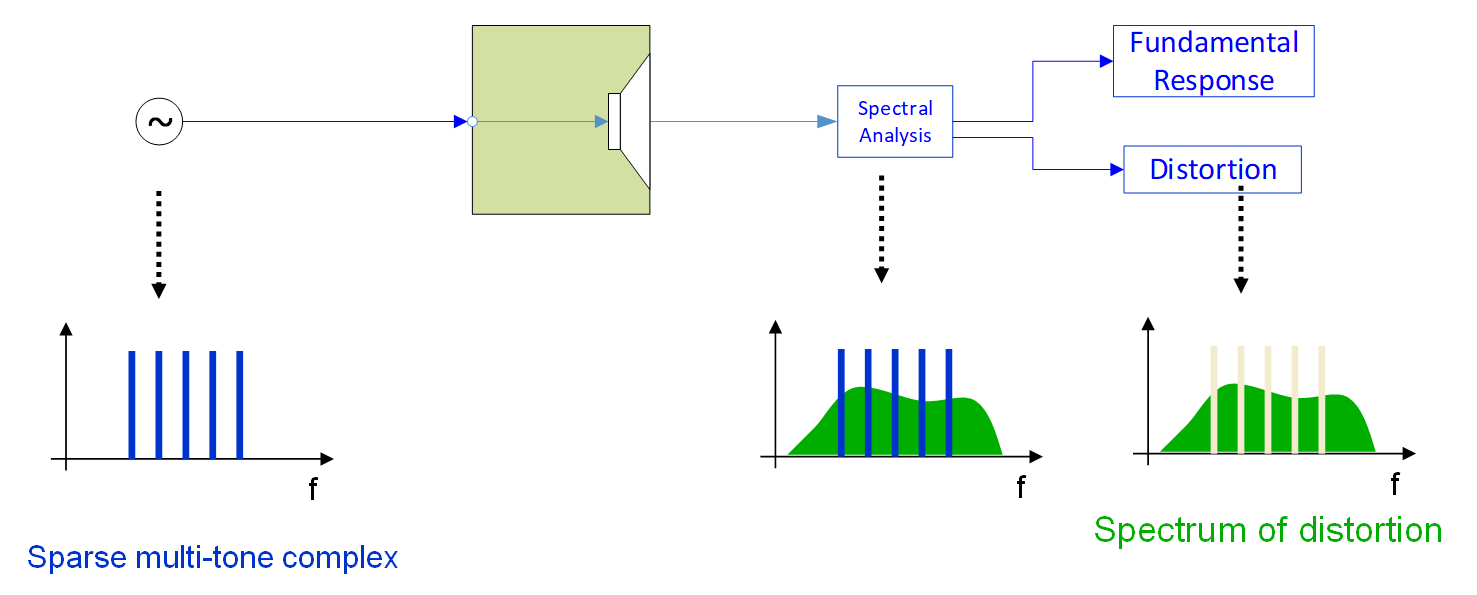
This curve, which contains the energy of external noises in addition to the distortion generated by the speaker is plotted keeping the full resolution together with the spectrum of all measured signals.
To simplify the interpretation of the multi-tone distortion spectrum (MDS), two different calculation methods are available in MTON.
Relative MD Calculation: Band Level relative to Fundamental#
The multi-tone distortion spectrum (MDS) is reduced to band levels by integrating the energy of the unexcited neighboring frequency bands around the fundamental frequencies, which results in the absolute multi-tone distortion in dB:
Where:
\(\text{MDS}\left( f \right)\): Multi-tone distortion spectrum.
\(i\): index of fundamental components.
\(N\): total fundamental components.
\(\text{ref}\): level reference depending on multi-tone response signal:
pressure: \(20 \cdot 10^{- 6}\) Pa
displacement: \(10^{- 3}\) m
voltage: \(1\) V
current: \(1\) A
Based on the defined absolute spectral multi-tone distortion, the relative spectral multi-tone distortion (RMD) is defined as the energy ratio of the integrated multi-tone distortion bands and the fundamental (multi-tone response) components:
The relative multi-tone distortion can also be expressed in percent:
The band integration as well as the calculation of the relative curve can be applied not only to the multi-tone distortion curve but also to the noise floor spectrum to assure that the measurement is not noise corrupted.
Relative MD Calculation: Smoothed relative to Average Level#
The multi-tone distortion curve is smoothed by averaging the distortion lines in a rectangular “sliding window” [5]:
Where:
\(f_{i}\): window’s centre frequency
\(D_{k}\): amplitude of distortion
\(K\): number of spectral components (window’s size). In MTON it is a fixed value: \(K = 40\).
\(d_{0}\): level reference depending on multi-tone response signal:
pressure: \(20 \cdot 10^{- 6}\) Pa
displacement: \(10^{- 3}\) m
voltage: \(1\) V
current: \(1\) A
The relative multi-tone distortion curve is calculated by dividing the smoothed multi-tone distortion by the average level of the fundamental components (multi-tone response). This curve can be presented in dB as well as in percent.
The soothing as well as the calculation of the relative curve can be applied not only to the multi-tone distortion curve, but also to the noise floor spectrum to assure that the measurement is not noise corrupted.
It is important to note, that the amplitude of the multi-tone distortion curve depends on the measurement time in this calculation method. The length of the measurement time defines the FFT frequency resolution (\(\Delta f = 1 / T_{meas}\)) and therefore the number of bins between the stimulus lines. In the following example it is clearly visible that the number of bins in the Noise + Distortion curve is higher when the measurement time is 2 seconds in comparison with a 0.2 s measurement:
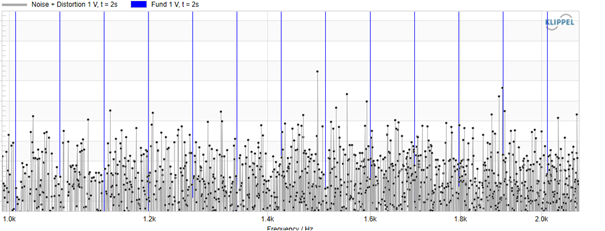
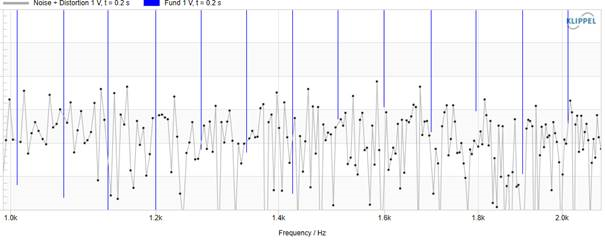
Since the stimulus comprises so many tones, the interaction of all these tones together (HD + IMD of different orders) composed the distortion, which is distributed along the whole frequency band. For longer measurements, the energy of the distortion will be distributed along more bins, which reduces the amplitude of the curve. This dependency between distortion and FFT length is avoided by using the Band Level relative to Fundamental calculation since all bins between signal lines are summed.
Total Multi-Tone Distortion Ratio#
The total multi-tone distortion ratio (TMDR) is defined as a ratio of RMS value of the total distortion and the rms value of the total multi-tone response (fundamentals) signal:
The ratio can also be expressed in decibels:
Note
For more information to the multi-tone distortion measurements, please refer to the Application Note 16: “Multi-Tone Distortion Measurement” [6], which describes in detail the multi-tone distortion, its application and several measurement examples.
Temperature Monitoring#
Reference Resistance#
The voice coil temperature is calculated by comparing the measured DC resistance Re(t) (corresponding to the absolute voice coil temperature Tv(t)) at the measurement time t with a reference resistance Rref measured at a reference temperature Tref. The reference temperature corresponds to the ambient temperature when the driver is in thermal equilibrium.
In MTON module, the DC resistance is estimated by measuring the electrical impedance at two consecutive and sufficiently small pilot tone frequencies. The reference resistance is measured during the first measurement, if it is not entered in the parameter Re(ΔTv=0 K).
Increase of Voice Coil Temperature#
The increase of the voice coil temperature ΔTv during the measurement is expressed in Kelvin. It is calculated by using the reference resistance \(R_{\text{ref}} = R_{\text{e}}(t_{0})\), measured during the first measurement \(t = t_{0}\), the resistance during the next measurements Re(t), and the temperature coefficient α for the voice coil material.
Why Adding Pilot Tones?#
The measurement of voice coil temperature is based on assessing the electrical input impedance at a specified frequency fp. This method requires voltage and current monitoring only. The DC resistance measured at the loudspeaker terminals by a 4-wire cable (there is no current in two wires used for voltage measurement) is the most accurate way for estimating the voice coil temperature.
However, using low-frequency tones fp (2 Hz … 8 Hz) is more convenient than a DC stimulus because an AC signal can pass the high-pass of the power amplifier. Loudspeaker systems with integrated amplifiers or active or passive crossovers require at least a pilot tone at higher frequencies. Setting the pilot tones in the minimum of the impedance curve gives a temperature estimate which is less accurate than monitoring the resistance at low frequencies close to DC.
Noise Floor and DC offset measurement#
Noise Floor and DC offset measurement can be activated by the Noise Floor and DC option.
In a pre-measurement, the noise floor and DC offset (bias) are measured for each input channel separately. The stimulus has the same duration as the main measurement but no output signal. Thus, the noise floor spectrum of the sensors indicates the lowest possible level for measurement. It is shown in the input spectrum charts as a black curve. This floor can be used to assess the accuracy of fundamental and distortion measurements. As a rule of thumb, a signal-to-noise floor ratio of about 15 dB is the minimal distance.
During the noise floor measurement, the sensor’s DC offset is measured and used as a reference for any time domain charts and the PDF chart. Thus, when the Noise Floor and DC option is enabled, a dynamic DC offset produced by the DUT or test stimulus can be evaluated. Especially, the PDF chart is well suited for such investigations.
Note
In case the Noise Floor and DC option is disabled, the DC component in the time signal is removed for display in waveform charts. For any DC investigations, this option shall be enabled.
Wireless Measurements & Clock Drift#
Measuring wireless systems such as Smart Speakers and other multimedia devices introduces specific problems like variable and long delays or clock drift.
Note
The Application Note 72: “Testing wireless audio devices with Klippel R&D System” [7] describes these particularities.
Long delay issues can be easily solved by adding enough pre-loops to the measurement stimulus. Regarding the clock drift issue, it smears the energy of the excited signal frequencies into the adjacent (non-excited) frequencies, which leads to a massively wrong assessment of multi-tone distortion. The Clock Drifts Tolerance processing identifies the fundamental components and compensate for the smearing effect. In case the smeared energy is not completely corrected, the tolerance factor can be increased to correct it.
For more information, please refer to the paper “Mastering Wireless Multi-Tone Testing” [8] available on the Klippel website.
Note
In addition, the Application Note 16: “Multi-Tone Distortion Measurement” [6] includes an example of a wireless measurement.
Literature#
[1] IEC 60268-21: Sound system equipment – Part 21: Acoustical (output-based) measurements
[2] ANSI/CEA-2010-B: Standard Method of Measurement for Subwoofers
[3] ANSI/CEA-2034-A: Standard Method of Measurement for In-Home Loudspeakers
[4] EIA-426-B: Loudspeakers, Optimum Amplifier Power
[5] A. Voishvillo, A. Terekhov, G. Czerwinski, S. Alesandrov: Graphing, Interpretation and Comparison of Results of Loudspeaker Nonlinearity Measurement
[6] AN16: Multi-Tone Distortion Measurement
[7] AN72: Testing wireless audio devices with Klippel R&D System
