
PWT – Power Test#
PWT Tutorial (Part 1)#
What is the goal of the tutorial?#
The tutorial of the power test module consists of three parts. Part 1 examines the results of an existing measurement in the Web Example Database. Part 2 shows how to run a power test using the default settings. The third part explores the full functionality of the PWT software.
The principle and the features of the PWT, together with all possibilities of customizing the setup, are described in the reference chapter. You can find details about the basics of the large signal speaker modeling and the adaptive identification technique in the LSI manual.
Viewing Results (Part 1)#
Example data used in this manual is stored in the Web Example database. If not downloaded already, get it from the latest R&D release <https://www.klippel.de/go/current-rnd-release> and open the web-based database.
See also
View Results for general information on how to download this database, open and view results in dB-Lab.
Open the operation Endurance + Power Testing (KET,PWT)PWT - Power Test (deprecated)PWT woofer identification, internal IEC 60268 NOISE stimulus. Open the result window Temperature, Power
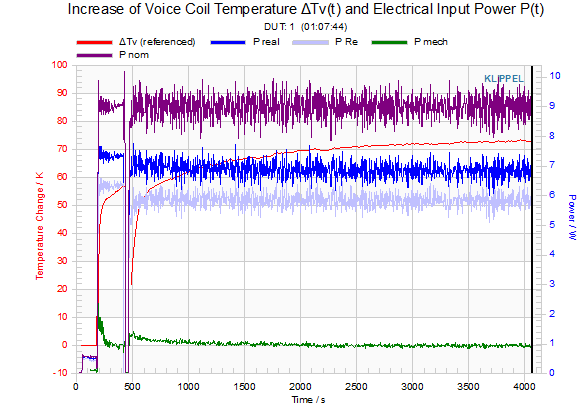
The upper (blue) curve in the diagram represents the real electrical input power versus measurement time. At the beginning of the measurement the thermal, mechanical and electrical parameters of the driver are determined in an initial identification. After this phase the regular power test starts where the input power is varied according to a user defined cycle and amplitude stepping scheme. The cycling is realized by two modes. In the first mode PWT interval on the full power is supplied to the speaker for \(1 min\), then in the alternating second mode PWT interval off the input amplitude will be reduced by \(20 dB\) for \(1 min\). Each time entering the mode PWT interval on the amplitude is increased by \(1 dB\). The voltage stepping is finished after the accumulated increase exceeds a predefined value of \(18 dB\), or as in this case the measurement was stopped manually.
The lower (red) curve shows the instantaneous voice coil temperature during the measurement.
- Open the windows of the nonlinear parameter Bl(x), Kms(x) and Le(x).These characteristics are also determined during the initial identification.
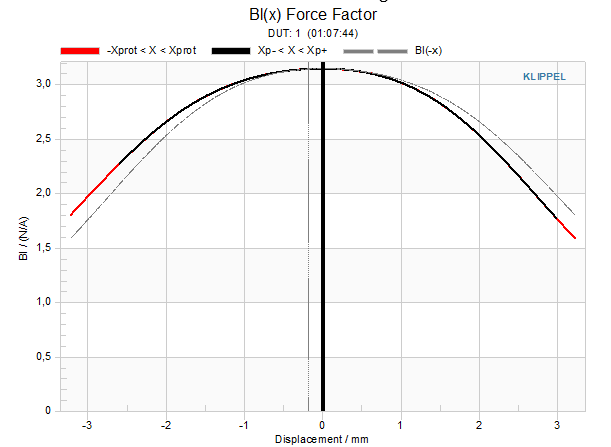
For details of how to interpret these parameters please refer to the LSI – Large Signal Identification reference.
Open the window Displacement
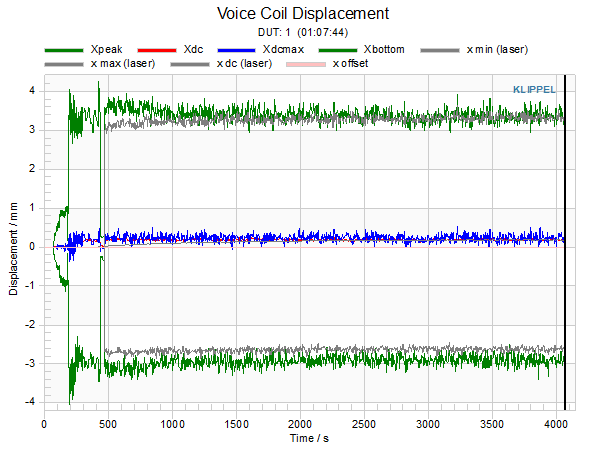
The outer (green) curves show the peak and bottom value of the voice coil displacement. The blue and red curves are useful criteria for detecting a DC-component generated dynamically by driver nonlinearities. Whereas the noisy blue curve shows the instantaneous center point between peak and bottom value, the red curve is the integrated DC-component. Both curves are very close to the zero line indicating that the driver has no problems with instability.
Open the window Voltage, Current.
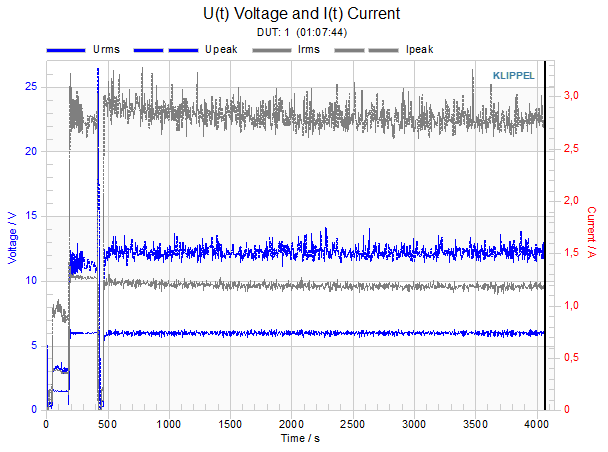
The rms and peak value of both electrical voltage u(t) and current i(t) at the speaker terminals of the particular DUT are displayed versus measurement time t. The particular DUT will be selected on the Property Page / DUTs. The aggregated voltage Urms (agg) displays maximum rms value over all (alive) DUTs currently monitored by the PWT operation. The aggregated voltage Urms (agg) easily indicates differences between the DUTs caused by variation of amp gains between the different channels.
Open the window Efficiency.
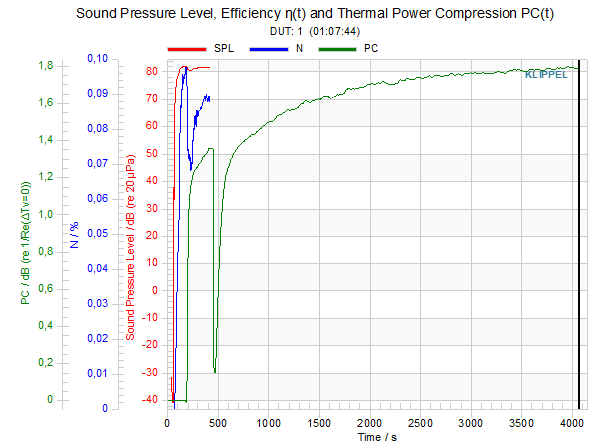
The pass-band efficiency N and the characteristic sound pressure level SPL is shown versus measurement time t. Due to the heating of the voice coil the efficiency N and the SPL decreases by the power compression PC expressed in dB.
During the measurement the parameters are sampled regularly, and stored in the database when the power test is finished.
You may review the development of all parameters over time, you can use the History Cursor (thick solid line) available in all plots where x-axis displays time.
Click into the window and use the following key to navigate the History Cursor:
Key |
Action |
|---|---|
Shift + Cursor Left / Right |
Move to previous / next sample point |
Shift + Home / End |
Move to first / last sample |
Shift Page ↑ / Page ↓ |
Move left / right in larger steps (depends on number of data points) |
Shift + Click into the diagram |
Move the cursor to the nearest sample |
Drag the time cursor from the end of the measurement to earlier instances to view the nonlinear parameters such as force factor Bl(x), stiffness Kms(x) and inductance Le(x) or all of the remaining parameters at the rest position X=0 in greater detail.
Open the result window Setup to get a summary on the current setup parameters corresponding with the entries on the property pages.
You find more information to the remaining result windows in the module LSI – Large Signal Identification.
PWT Tutorial (Part 2)#
What is the goal of the tutorial?#
Part 2 performs a series of measurements using an internal and external stimulus. To make it simple we measure only the voice coil temperature, voltage, current and power at the terminals of one DUT. The identification of the mechanical parameters is discussed in the third part of the PWT Tutorial.
Selecting the source mode#
The PWT provides an internal generator and supports usage of an external excitation signal (music or test signals). There are three different modes depending on the source and signal properties of the stimulus:
Internal#
- Signal
Internally generated signals: - pink and white noise (filtered) - IEC and EIA noise - sweep - two-tone signal
- PWT functionality
voltage control at terminals
stepping
ON/OFF cycling
- Application
stand-alone application (minimal hardware required)
external#
- Signal
External source providing signal with constant amplitude (e.g. noise or tone generator )
- PWT functionality
voltage control at terminals
stepping
ON/OFF cycling
- Application
using an external generator with special filters
Note
Do not use music as stimulus!
bypass#
- Signal
Arbitrary signal from any source
- PWT functionality
ON/OFF cycling
external source of pilot generator
- Application
testing with music,
external asynchronous pilot tone, testing loudspeakers with crossover
Measurement with internal source (Part 2‑1)#
This measurement mode requires minimal additional hardware and is recommended for most applications.
Setting up the Hardware#
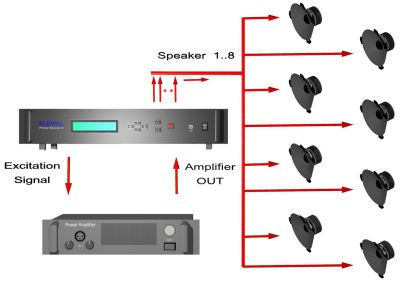
The equipment comprising
Distortion Analyzer (DA1 or DA2) or Power Monitor 8
Power Amplifier (1-8 channels)
Amplifier and speaker cable
Personal computer with USB cable
is connected in the following way:
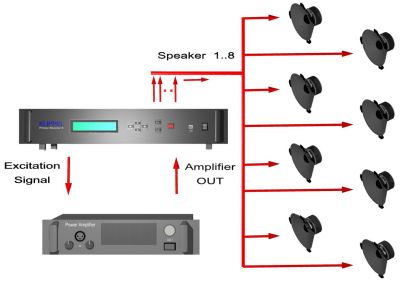
Output OUT1 of the Hardware Unit is connected with the audio input of the power amplifier.
The output of the power amplifier is connected to the input Amplifier using pins 1- and 1+ provided to the Speaker 1. Ensure maximal gain of the power amplifier.
Connect output Speaker 1 to your device under test (DUT). Use a woofer with known small signal parameters.
Connect the computer to the Hardware Unit via the USB interface.
Running the measurement#
Open your database, create an object and select the operation PWT power test.
Before starting the measurement you have to provide some information about the device under test. Open the Import property page. Since the PWT runs without any external sensor (Laser displacement head) you have to import \(Bl(x=0)\) and/or \(Mms\) to express the mechanical states and parameters in absolute quantities. You may also enter the resistance \(R_e\) measured at DC.
Open the property page Stimulus and enter the starting value appropriate for your DUT. Contrary to the LSI module the PWT provides no protection for the DUT but the user determines the maximal amplitude of the excitation signal expressed by the voltage in \(V_{RMS}\) at the speaker terminals.
Use the default setup parameters on the other property pages. You may find more detailed information about customizing in PWT-Reference.
Start the measurement by pressing the start button.
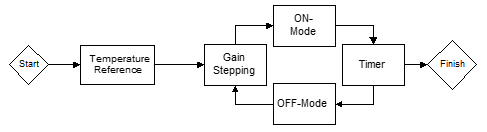
After performing a short amplifier check the electrical resistance \(R_e\) of the voice coil at initial temperature is measured and stored as a reference value for calculating the temperature change during the following test.
At any time you may pause the measurement by pressing the PAUSE button in dB-Lab or the RED BUTTON on the processor unit. Release the PAUSE button or press the ENTER key to continue with the measurement.
During the measurement you may disconnect dB-Lab from the processor unit without stopping the current measurement. | Click
 Save /Finish, and choose “Continue Standalone” from the finish dialog.
Now you may unplug your PC from the USB port of the processor unit.
| To reconnect to the running measurement,
make sure the PWT operation is selected in the project window, and click the
Save /Finish, and choose “Continue Standalone” from the finish dialog.
Now you may unplug your PC from the USB port of the processor unit.
| To reconnect to the running measurement,
make sure the PWT operation is selected in the project window, and click the  Run button.
After the duration t_total defined on the property page CYCLES the system finishes the measurement.
Warning
Using the PWT module the user is responsible for protecting the speaker himself! The PWT can also be used for destructive testing to determine the maximal limits (power, temperature, voltage, displacement) which are permissible for the drive unit. The user is responsible to comply with safety requirements. Note that overload of the driver may cause fire hazard.
Note
To retrieve the data and store it in the database, finish the measurement from dB-Lab. If you use the Hardware Unit front panel to end the measurement, your data will not be saved.
Measurement with external source (Part 2‑2)#
This measurement is recommended for using a noise signal provided by an external source (Signal Generator, CD-player). The noise signal according EIA-426-B recorded on CD (ALMA international www.alma.org, Loudspeaker power Rating Test CD, track #2) is recommended.
Note
For “external source”, the signal provided should have a persistent excitation. For audio signals with fast amplitude changes, use the “bypass” mode.
Setting up the hardware#
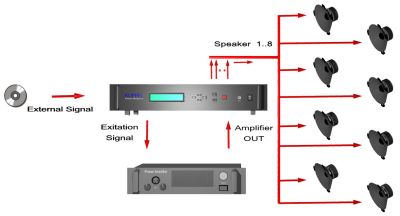
Setup the hardware as described for the measurement with internal signal.
Provide an excitation signal at about 0.2 Vrms from an external source to the input IN 1 of the processing unit. Ensure that the power amplifier is at maximal gain.
Running the measurement#
A measurement can be accomplished by doing the following steps:
Create an object with an operation PWT power test.
Specify Bl(x=0) at the Import property page. (Only needed for PWT Pro application!)
Open the Stimulus property page. Select external as source, and specify the Urms of the voltage at the terminals appropriate for the transducer connected.
Keep the default settings on the other property pages (stepping and cycling disabled)
Start the measurement by pressing the start button.
After the mode Temperature Reference the system supplies the external signal to the speaker. The system generates a warning if the amplitude of the external signal is too low and interrupts the update process.
Finish and save the measurement.
Measurement with bypassed signal (Part 2‑3)#
This measurement is recommended for a power test using an ordinary audio signal (music) or any synthetic test signal as stimulus. To monitor the amplifier input signal a connection from the external source to the IN 1 line level input of the hardware unit is required. The external signal is not affected by the hardware unit. Only a pilot tone with small amplitude will be added for the temperature monitoring.
Any test signal from the Loudspeaker power Rating Test CD (ALMA international www.alma.org) can be used.
Setting up the hardware#
Setup the hardware as described for the measurement with external signal. Ensure that the power amplifier is at maximal gain
Attenuate the output level of the external source to a minimum. The level has to be adjusted after starting the PWT manually (see next section). Connect the external source with input IN 1 of the processing unit.
Note
Even though the signal is not processed by the Hardware Unit, it still needs to be connected to IN 1 for monitoring.
Running the measurement#
To run the measurement:
Create an object with an operation PWT power test.
Import Bl(x=0) on the Import property page. (Only needed for PWT Pro application!)
Open the Stimulus property page and select the source Bypass.
Start the measurement by pressing the start button.
After measuring the resistance of the DUT at initial temperature in the mode Temperature Reference the external signal will be applied to the driver. Adjust the amplitude of the external signal by using the gain controller at the external source. Keep the amplifier at maximal gain.
If the external signal provides not sufficient excitation, the system interrupts updating and gives a message (poor external excitation).
Finish the measurement and save data.
PWT Tutorial (Part 3)#
What is the goal of the tutorial?#
In the third part of the tutorial we explore the full functionality of the PWT module. In addition to the measurement of the voice coil temperature and other electrical state variables we measure the displacement and the nonlinear and linear parameters of a transducer operated under normal working conditions.
Working Modes#
The following list gives an overview on the working modes provided by the PWT Lite
Temperature Mode#
MODE |
Temperature Mode |
||
State Signals |
voltage, current, power, temperature, resistance, displacement and velocity (measured by laser), |
||
Parameters |
no linear and nonlinear parameters available |
||
Updating speed |
\(>= 1s\) per DUT |
||
Laser displacement measurement |
available for 1 DUT only, available for Distortion Analyzer only |
||
Signal properties |
no requirements |
||
Initial Identification |
not required / not provided |
||
On-Line Identification |
The time varying parameters (resistance, stiffness, damping, offset in voice coil rest position) are measured permanently. |
||
Model used |
no transducer modeling used |
||
Transducer Identification Modes#
The following table gives an overview on the transducer identification modes provided by the PWT Pro
MODE |
Woofer Identification |
Vented System |
Microspeaker |
|---|---|---|---|
State Signals |
voltage, current, power, temperature, resistance, displacement (simulated) |
||
Parameters |
Small and large signal parameters (identical to LSI Woofer) |
Small and large signal parameters (identical to LSI Box) |
Small signal parameters + selected large signal parameters |
Updating speed |
\(>= 4s\) per DUT |
||
Laser displacement measurement |
available for 1 DUT only, available for Distortion Analyzer only |
||
Signal properties |
Stimulus should provide persistent excitation (sufficient bandwidth and amplitude) to measure the nonlinear parameters at high accuracy |
||
Initial Identification |
Before entering regular power test (ON-Mode with user defined stimulus) the small and large signal parameters are identified by a broad-band noise stimulus |
||
On-Line Identification |
The time varying parameters (resistance, stiffness, damping, offset in voice coil rest position) are measured permanently. |
||
Model used |
electro-dynamical transducer operated in free air or sealed enclosure (fs < 800 Hz) |
electro-dynamical transducer + an additional mechanical or acoustical resonator (vented enclosure (fs < 800 Hz) |
electro-dynamical transducer operated in free air or sealed enclosure (fs < 800 Hz) |
Note
The PWT Pro module with the transducer identification (woofer, vented box, microspeaker) allows to measure state and parameters while using an arbitrary stimulus. However, the identification of the loudspeaker parameters requires persistent excitation. For example a one sinusoidal tone used as stimulus allows to identify only selected parameters which have a high time variance (e.g. offset in the rest position, resonance frequency,…).
Note
The large signal identification modules (LSI woofer, LSI tweeter) select automatically an optimal noise stimulus to measure the linear, nonlinear and thermal parameters at high accuracy. It provides full mechanical and thermal protection of the loudspeaker during testing and adjusts the spectrum of the noise automatically.
Woofer Identification with internal source (Part 3‑1)#
The Woofer Identification implemented in the PWT module is capable of identifying any electro-dynamical transducer corresponding to a nonlinear second-order system as described in the theory of the LSI module. The resonance frequency should be below 800 Hz.
Running the measurement#
We will use the internal generator for providing the stimulus. Connect the hardware according to Tutorial Part 2-1.
Open your database, create an object and select the operation PWT power test
Open the Import property page. Import \(Bl(x=0)\) and/or \(Mms\) to express the mechanical states and parameters in absolute quantities. Although the PWT uses the pilot tone at \(1, 2\) or \(4 Hz\) for measuring the electrical impedance at a very low frequency you may provide a value for \(R_e\) measured at DC.
Open the property page Stimulus and enter the target value appropriate for your DUT. Note that the Voltage Stepping is not available in this mode, since it may interfere with the identification algorithm.
Warning
Using the PWT module the user is responsible for protecting the speaker himself!
Open the property page Method and select the method Woofer Identification. Use the default setup parameters on the other property pages. You may find more detailed information about customizing in PWT-Reference.
Start the measurement by pressing the start button. At the beginning an initial identification of the transducer parameters are performed using an optimal noise stimulus giving persistent excitation. After processing similar steps as in the LSI – Large Signal Identification the system enters the processing mode PWT interval on using the selected stimulus.
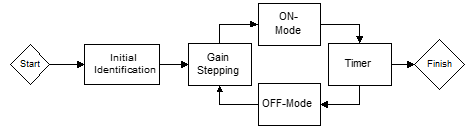
After the duration t_total defined on the property page CYCLES the system finishes the measurement.
Woofer Identification with bypassed signal (Part 3‑2)#
This measurement mode of the PWT exploits the full potential of the adaptive approach. A woofer can be operated with music, noise or any other audio-like signal giving persistent excitation.
Note
The linear and nonlinear parameters of the woofer cannot be identified by using a single ntone as stimulus.
Connect the hardware as described Tutorial Part 2-3.
Open your database, create an object and select the operation PWT power test
Open the Import property page. Import \(Bl(x=0)\) and/or \(Mms\).
Open the property page Stimulus and select the bypassed signal as the source for the stimulus.
Open the property page Method and select the method Woofer Identification. Use the other default setup parameters on the property pages.
Reduce the signal at the output of the external signal source (generator or CD player) while keeping the full gain of your power amplifier.
Start the measurement by pressing the start button.
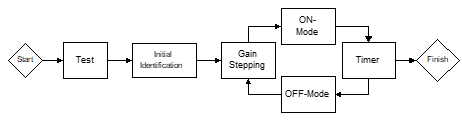
The initial identification uses internally generated noise as stimulus. After processing the steps (Amplifier Check, Linear Mode, Enlargement Mode, Nonlinear Mode) the external signal is supplied to the DUT without changing amplitude and spectral characteristic.
If the external signal provides not sufficient excitation, the system interrupts updating and gives a message (poor external excitation).
After the duration t_total defined on the property page Cycles the system finishes the measurement.
Finish the measurement and save data.
PWT Reference#
Overview#
The software module “Power Test” and the Klippel R&D System hardware units (Distortion Analyzer 1 & 2, Power Monitor 8 ) allow performing destructive testing of transducers with permanent monitoring of electrical, mechanical and thermal state variables and parameter variations. An external or internal generated excitation stimulus may be controlled in amplitude, spectral bandwidth or crest factor and may be supplied to the transducer permanently. To apply a pre-defined time scheme (on/off cycle) gives additional flexibility. The large signal model of the transducer is completely identified by measuring the electrical signals (voltage and current) at the transducer terminals. No acoustical, mechanical or thermal sensor is required.
During the Power Test the instantaneous variables (displacement, temperature, power, voltage) and driver parameters are sampled periodically and stored in a data buffer. Connecting a computer via USB to the hardware platform allows viewing and investigating the destruction process in detail. This information is crucial for finding the physical cause of the failure and to understand the temporal order of the destructive events. This enables to assess the maximal limits of the transducer more precisely.
Basic Principle#
During the Power Test the transducer is excited by an external signal source or by the internal generator of the measurement hardware. The devices under test (DUTs) are supplied via a power amplifier. A signal conditioning network (filter) may be connected between amplifier and Analyzer hardware unit. The amplitude of the stimulus may be controlled by the Hardware Unit according to user-defined values and cycles. Voltage and current sensors measure the electrical signals at the DUTs terminals. Both signals are supplied to the signal processor (DSP) where a digital model of the transducer is implemented. In the mode temperature identification, the voice coil temperature \(T_v\) and the electrical quantities at the speaker’s terminals are permanently monitored. In the mode woofer identification the electrical, mechanical and thermal elements of the equivalent circuit are identified on-line. The identified model reveals all relevant state variables of the transducer such as voice coil displacement \(x\), input power \(P\), voice coil temperature \(T_v\). Statistical values of the state variables (peak and RMS) values and the parameter estimates are sampled regularly and stored in a history buffer. Connecting a computer via USB to the Hardware Unit enables investigating the history of the measurement in detail.
An internal generator may be used to generate noise with adjustable bandwidth, crest factor according to different standards. A small pilot tone at low frequencies is added to the stimulus to maintain the temperature measurement when the stimulus does not provide sufficient excitation.
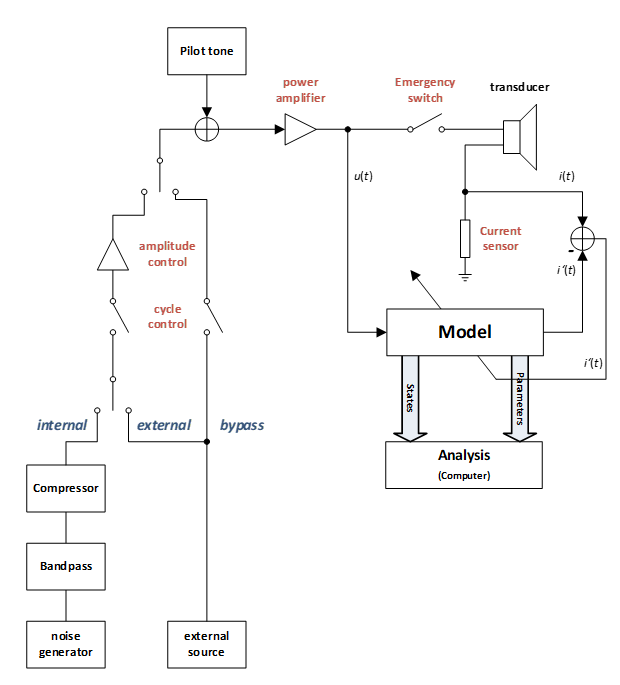
What is the Difference to LSI?#
Although PWT is very similar to the large signal identification module (LSI) there are some special features which makes the PWT more suitable for short- and long-term power testing:
monitors simultaneously up to 8 DUTs (depending on hardware)
user may determine amplitude (rms voltage) of excitation directly
no protection of the driver but failure detection
user defined noise generator, limiter and band-pass filter
user defined amplitude and cycle scheme
generates detailed death report for failed DUTs
measures the voice coil temperature by using a pilot tone which can be customized (frequency, amplitude)
temperature time response at high resolution
slow and fast time constant for temperature measurement
Hardware Setup#
The minimal components required for running a Power Test are:
Distortion Analyzer (DA1 or DA2) or Power Monitor 8
Power Amplifier (1-8 channels)
Amplifier and speaker cable
The minimal setup works without computer as a stand-alone system and dispenses with any acoustical or mechanical sensor. The USB interface allows a permanent or temporary connection to a portable or stationary computer to investigate the results in detail.
Separate Amplifiers#
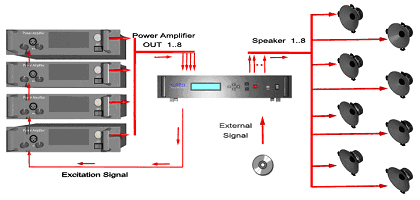
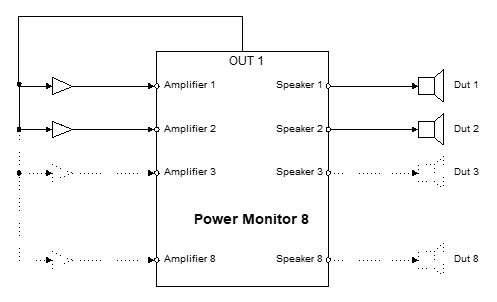
Use a separate amplifier for each DUT if the impedance of the transducers is relatively low and the power amplifier may not provide the current for multiple DUTs connected in parallel. In this case use the following setup:
Connect the output signal at OUT1 at the processor unit with the inputs of all power amplifiers. Using a stereo amplifier please link the right and left channel input.
Set all amplifiers to maximal gain
Connect the output of two mono amplifier (both outputs of a stereo amplifier) with the two input channels (1+, 1- and 2+,2-) at the SPEAKON connector AMPLIFIER at the Distortion Analyzer 1 (or one of the AMPLIFIER 1,2 – AMPLIFIER 7,8 of Power Monitor 8).
You may connect one DUT to each SPEAKON connector (SPEAKER 1, SPEAKER 2, … SPEAKER 8).
Common Amplifier#
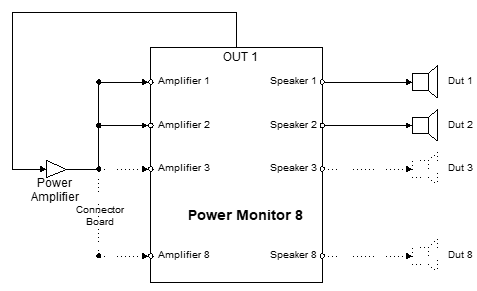
Having an amplifier capable for driving multiple DUTs connected in parallel use the following setup
Connect the output signal at OUT1 at the processor unit with the inputs of the power amplifier.
Set the amplifier to maximal gain
Connect the output of the amplifier with the first (1+ and 1-) and second (2+ and 2-) channel of the SPEAKON connector AMPLIFIER at the Distortion Analyzer 1 or all SPEAKON connectors AMPLIFIER 1,2 – AMPLIFIER 7,8 of the Power Monitor 8. It is recommended to use a connector board to switch all SPEAKON cables in parallel.
You may connect one DUT to each SPEAKON connector (SPEAKER 1, SPEAKER 2, … SPEAKER 8).
Crossover, Filter#
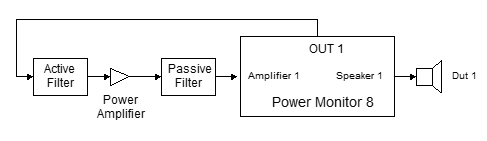
Active and passive crossovers and any other kinds of filter may be used to shape the spectral characteristic of the excitation signal. To measure the voice coil temperature and other electrical or mechanical parameters of the transducer it is recommended to connect all kinds of filters and equalizers between output OUT1 and the input connector AMPLIFIER of the hardware unit (DA, PM8) as shown below:
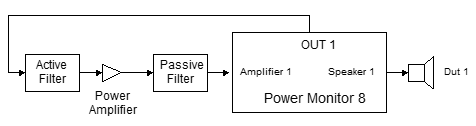
The measurement of the voice coil temperature with the automatic pilot tone adjustment requires that the power amplifier and additional filters are capable of transferring the pilot tone (\(1 …4 Hz\)). If the damping of the amplifier+filter exceeds \(40 dB\) at \(4 Hz\) it is recommended to set the pilot tone manually into the impedance minimum at higher frequencies. See also Application Note 27.
Note
Implementing filters between connector SPEAKER and the terminals of the transducers are not considered in the system model used in the woofer identification and may affect the accuracy of the measured parameters.
Temperature Measurements#
Reference Resistance#
The voice coil temperature is calculated by comparing the dc resistance \(R_e(t)\) corresponding with the absolute voice coil temperature \(T_v(t)\) at measurement time t with a reference resistance \(R_{ref}\) measured at the reference temperature \(T(t_{ref})\). The reference temperature corresponds with the ambient temperature when the driver is in thermal equilibrium either at the beginning of the power test or during a long OFF-Cycle. The electrical dc resistance can be estimated by measuring the electrical impedance \(Z_e(f_p)\) at a very low frequency (\(f_p = 2 Hz\) is recommended for woofers) or at other frequency where the impedance is minimal (recommended for loudspeaker systems with crossover).
Increase of Voice Coil Temperature#
The increase of the voice coil temperature during the power test expressed in Kelvin. It is calculated by using the reference resistance \(R_{ref} = R_e(t_0)\), measured at the starting time \(t = t_0\), the resistance during the measurement \(R_e(t)\), and the temperature coefficient \(α\) for the voice coil material.
Why adding a Pilot Tone?#
The measurement of voice coil temperature is based on assessing the electrical input impedance at specified frequency. This method requires voltage and current monitoring only. The dc resistance measured at the loudspeaker terminals by a 4-wire cable (there is no current in two wires used for voltage measurement) is the most accurate way for estimating the voice coil temperature. However, using a low frequency tone \(f_p (2Hz … 8 Hz)\) is more convenient than a dc stimulus because an ac-signal can pass the high-pass of the power amplifier. Loudspeaker systems with integrated amplifiers or active or passive crossovers require a pilot tone at higher frequencies. Setting the pilot tone in the minimum of the impedance curve gives a temperature estimate which is less accurate than monitoring the resistance at low frequencies close to dc. In both cases the ac pilot tone keeps the temperature measurement operative while the external stimulus is muted.
Automatic Pilot Tone Adjustment#
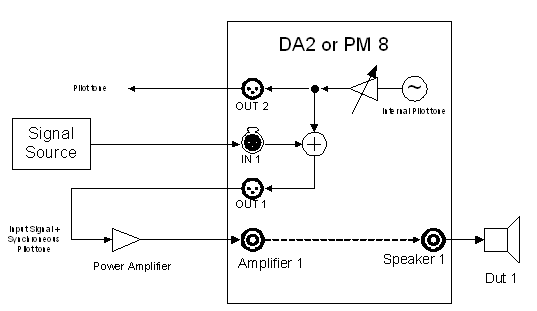
If the checkbox AUTOMATIC PILOT TONE is activated the pilot tone is set to the lowest frequency \((2, 4, 8 Hz)\) which passes the amplifier’s high-pass at sufficient amplitude. The amplitude of the pilot tone is controlled automatically to generate an optimal pilot tone at the speaker terminals. This mode is convenient for testing drive units without crossover.
Manual Pilot Tone Adjustment#
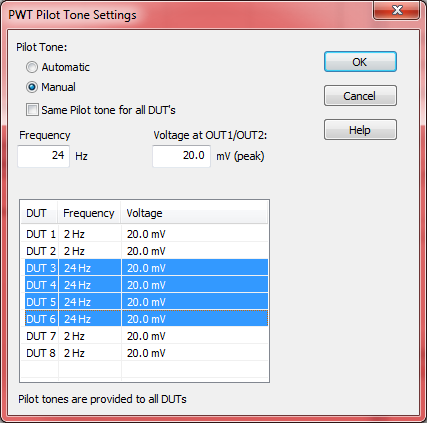
Alternatively, the automatic adjustment may be disabled and the user may specify the frequency and the voltage at the output XLR connectors OUT1 at DA, or PM8 of the pilot tone for each DUT manually. Although the pilot tone used in the TEMPERATURE Mode can be set to any audio frequency \((2 … 20 kHz)\) it is recommended to select a frequency where the electrical input impedance is minimal. The transducer identification (Woofer, Vented box, Microspeaker) requires a low frequency tone \((2, 4\) or \(8 Hz)\) close to dc and the manual pilot tone adjustment is disabled.
The amplitude of the pilot tone at the terminals of the speaker depends on the value specified at the output OUT1 of the hardware unit (DA, or PM8) and on the properties of the filter and amplifier used (e.g. gain, cut-off frequency).
How to find the optimal amplitude of the pilot tone?
Select a small pilot tone of \(20 mV\) at the output OUT1`of the hardware unit (:ref:`DA<kl-hardware-da>, or PM8) which gives a reasonable voltage at the loudspeaker terminals considering the gain of the power amplifier and the cut-off frequency of the amplifier’s high-pass.
Start the measurement and view the amplitude of the pilot tone shown in the result window STATE. The pilot tone should be \(30 - 40 dB\) lower than the stimulus used in the power test.
Stop the measurement and correct the voltage of the pilot tone at the output OUT1 of the hardware unit.
Increase the amplitude of the pilot tone if the measured temperature varies the back EMF generated by the stimulus.
Internal mixing of user-defined Pilot Tone#
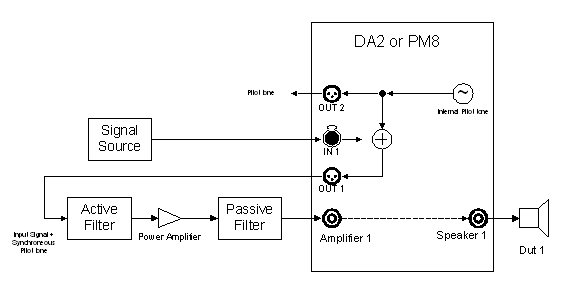
The figure above shows a first application of the manual pilot tone adjustment which is applicable to EXTERNAL, EXTERNAL and EXTERNAL Modes. The user defines the frequency \((2Hz … 18 kHz)\) and the fixed amplitude of the pilot tone at XLR connector OUT1 which is superimposed with the internal or external power test signal. Using a fixed pilot tone speeds up the initial phase of the power test. This setup is convenient for power testing of drive units together with the active or passive crossover.
External Mixing of User-Defined Internal Pilot Tone#
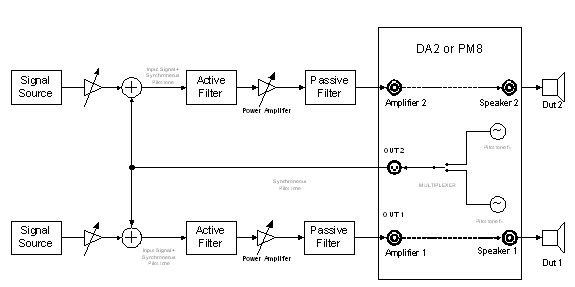
The application in the figure above performs an external mixing of the pilot tone provided at OUT2 of the measurement system with the external power test stimulus before feeding this signal via power amplifier and electrical monitoring to the terminals of the transducer. This setup requires the BYPASS mode and MANUAL PILOT TONE ADJUSTMENT because the stimulus can only be controlled by the gain controllers at the signal source or in the power amplifier. The user defines the frequency \((2Hz … 18 kHz)\) and the fixed amplitude of the pilot tone according to the impedance minimum of the transducer and the gain of the power amplifier.
This setup is convenient for power testing of different types of drive units requiring a special pilot tone frequency for each drive unit and using the special power test signals coming from different sources. The pilot tone at OUT2 is multiplexed after \(1s\) intervals according to the instantaneous device monitored.
User-Defined External Pilot Tone#
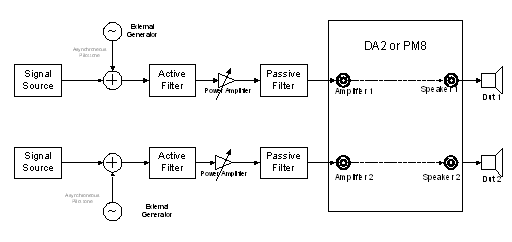
This application shown above uses only external signal sources for power testing. If the stimulus does not provide sufficient spectral density at the frequency \(f_p\) specified in the MANUAL PILOT tone property page then it is recommended to add a separate pilot tone at the same frequency \(f_p\) which is asynchronous to the analysis performed in the hardware.
The manual adjustment of the pilot tone on the Property Page Method allows an adjustment of the expected frequency of the asynchronous pilot tone generated by an external signal source (generator, wave file). The permissible frequency mismatch should be smaller than \(∆f < 1 Hz\) for a pilot frequency \(f_{pilot} < 8 Hz\) and \(∆f < 4 Hz\) for a pilot frequency \(f_{pilot} > 8 Hz\).
Application: Avoiding the feedback of the pilot tone from OUT1 (stimulus + pilot tone) or OUT2 (pilot tone only) to the amplifier.
Detailed Temperature Response#
If Number of DUTs is equal 1 then the results window Temperature Detail shows the voice coil temperature at high temporal resolution (sampled at \(200 ms\)). For multiple DUTs, the detailed temperature measurement may be started automatically or manually and synchronized with the cycling (at the OFF/ON and ON/OFF slope). Detailed curves may be collected in the result window Temperature by using copy and paste curve.
For further information see section Temperature Detail.
Crossover, Filter#
Active and passive crossovers and any other kinds of filter may be used to shape the spectral characteristic of the excitation signal. To measure the electrical impedance at the loudspeaker terminals it is recommended to connect all kinds of filters between OUT1 of the processor unit and the connector AMPLIFIER as shown below:
Ultra-Fast Temperature Measurement#
The PWT software also supports ultra-fast temperature measurement at maximum temporal resolution (\(200 ms\) sampling time) which is important for micro-speakers and headphones having a small thermal time constant of the voice coil. The following factors are important:
Use a short integration time by selecting FAST speed on PP Method
Use manual pilot tone adjustment and set the pilot tone frequency \(f_p > 8 Hz\) for monitoring micro-speakers, tweeters having a resonance frequency \(f_s > 100 Hz\). Note: Subwoofers and woofers need a lower frequency of the pilot tone \((f_p < f_s / 10)\) to suppress the influence of the motional part of the electrical impedance (automatic pilot tone adjustment or manual setting to \(f_p = 2 Hz\) is recommended for subwoofers)
Adjust the amplitude of the pilot tone manually to generate a suppress measurement noise the variation of the measured electrical impedance due to the back EMF.
Performing a Measurement#
Starting Measurement#
To start the measurement, choose a PWT measurement in the project window, verify the setup on the property pages, and click Start.
Alternatively, you can run the PWT without PC connected. For more information, see Standalone Measurement below.
Processing Steps#
The PWT measurement is organized in separate steps processed sequentially. Depending on the selected method (temperature or full woofer identification) and the signal source (bypass, bypass and bypass) some of the steps are skipped. The cross in the table below represents the used steps in the different working modes of the PWT.
Temperature Measurement Processing Steps#
Temp. Reference (2)#
supported with internal, external and bypassed stimulus
PWT Initialize (6a)#
supported with internal, external and bypassed stimulus
PWT gain adjustment (6b)#
supported with internal and external stimulusnot supported with bypassed stimulus
PWT On & PWT Off (7a & 7b)#
supported with internal, external and bypassed stimulus
Transducer Identification Processing Steps#
For Woofer-, Vented-System-, Microspeaker-Identification mode
Amplifier Mode (1)#
supported with internal, external and bypassed stimulus
Temp. Reference (2)#
supported with internal, external and bypassed stimulus
Linear Mode (3)#
supported with internal, external and bypassed stimulus
Enlargement Mode (4)#
supported with internal, external and bypassed stimulus
Nonlinear Mode (5)#
supported with internal, external and bypassed stimulus
PWT Initialize (6a)#
supported with internal, external and bypassed stimulus
PWT gain adjustment (6b)#
supported with internal and external stimulusnot supported with bypassed stimulus
PWT On & PWT Off (7a & 7b)#
supported with internal, external and bypassed stimulus
Initial Identification#
Before performing the long term monitoring the following steps are processed sequentially:
Amplifier Mode#
Before driving the loudspeaker with the excitation signal the additional equipment (power amplifier, cables, clamps) are checked in respect with
connectivity
gain of the amplifier
If the amplifier check is not successful, the Analyzer Unit goes automatically into the Exception Mode where the measurement is aborted and a malfunction message is reported.
Linear Mode#
After performing the \(R_e\)-measurement, the loudspeaker is supplied with a small amplitude excitation signal. Since the variations of the nonlinear parameters and the heating of the voice coil can be neglected, the identified parameters correspond with the results of a traditional small-signal measurement. The voice coil resistance related to the ambient temperature \(T_V = T_A\) measured in this step is used as a reference to estimate the increase of voice coil temperature \(∆T_V = T_V - T_A\) in the following measurements.
Enlargement Mode#
After convergence of the small signal parameter estimation the thermal and nonlinear parameters are estimated in the large signal domain by increasing slowly the amplitude of the excitation signal until one of the protection criteria reaches the predefined limit values and the maximal range of safe operation is detected. In the Enlargement Mode we use the highest learning speed possible in the LMS update algorithm. Please refer to the LSI-Reference to obtain detailed information about the protection system.
Nonlinear Mode#
After finding the optimal range of operation the convergence of the nonlinear parameters at high amplitudes requires some time \((5 min)\) because the occurrence of displacement peaks is relatively rare.
After finishing the initial identification the thermal capacity \(C_{TV}\) of the voice coil is measured by attenuating the speaker’s input power for a short period of \(2 min\) and monitoring the voice coil temperature \(∆T_V\).
Power Test Modes#
After finishing the initial identification the measurement enters the power test mode PWT Interval on alternating with the mode PWT interval off . In both modes the internal, external or bypassed stimulus with specified properties is used.
PWT Interval On#
In the mode PWT interval on the amplitude of the stimulus is set to the specified value. If voltage stepping is activated the amplitude will be increased by factor \(G_U\) when returning from the alternating mode PWT Interval off.
PWT Interval Off#
In the PWT interval off mode, the input power of the driver is reduced by \(20 dB\).
Poor External Excitation#
Using a stimulus source in Bypass or External mode the amplitude of the external signal will be checked during the power test modes. In the case that the amplitude is low or signal gives no persistent excitation of the transducer, the updating of the parameters will be interrupted and the message “poor external excitation” will be displayed.
Pause Measurement#
The measurement procedure can be interrupted at any time by clicking the Pause button on the measurement menu at PC or by selecting the pause state at the Processing Unit. The measurement continues at the same step after clicking the start button in the measurement menu.
If a measurement is running, pressing the red key on the processing unit will disconnect the speaker and set the program into the pause mode. If there is no measurement running (pause mode, not started yet, laser displacement meter) pressing the red key will terminate the current program and reset the control unit. This ability is intended for a fast abruption of the measurement in an emergency case to protect the speaker.
Standalone Measurements#
The power test does not need a PC to be connected. You can:
Start the Operation from the PC, and disconnect from the measurement
Store a setup in the hardware unit, and then start the operation from the hardware unit directly
Starting from PC and Disconnect#
Start the PWT measurement by selecting a PWT operation in the project window, verify and/or adjust the setup, and click the Run button.
When the PWT started, click “Save/Finish”, and choose “Continue Standalone” in the Finish dialog. The PC will disconnect from the measurement, and the PWT will keep running. You can unplug the USB cable, and/or turn off your PC. When you disconnect from the measurement and intend to leave it running for longer time, you should enable the “Clear standalone buffer” checkbox in the Finish/Disconnect dialog. This will save all data sampled until this point in the database, and clear the standalone buffer to make room for new data.
Note
The “Clear Standalone Buffer” checkbox affects how data is stored when disconnecting. If this checkbox remains unchecked (default), all data acquired up to this point will remain stored in the processing unit. Enabling that option is recommended for long-running measurements, as the standalone buffer of the device is limited. In both cases, dB-Lab will store the data acquired up to this point, and merge correctly when you later reconnect to that measurement.
To reconnect to the standalone measurement, start dB-Lab, select the same PWT operation you used to start the measurement, and click the Start button. A dialog will confirm that you reconnect to the running measurement. Click OK, and the PC will retrieve the data. When the PC is reconnected to the hardware unit, it will always retrieve the latest samples for display, and clear the standalone buffer when it’s exhausted.
To finish the measurement, click “Save/Finish”, and choose “Finish measurement”.
Note
If you choose “Finish” on the hardware unit to terminate the measurement, the data acquired in the device is lost.
Storing a PWT Setup in the Device#
Before you start the PWT from the hardware unit directly, you probably want to override the default setup with your custom settings. To do so:
- Choose a PWT with the desired setupIf you don’t have one available, create a new PWT operation, and change the setup according to your needs.
Select the Method property page
In the “Hardware Unit Setup”, type a descriptive name for the setup. You can verify this name anytime you start a PWT from the hardware unit.
Connect the hardware unit to write this setup to
Click Write
Reading a PWT Setup from the Device#
To read the setup stored in a device:
In the project window, select a PWT measurement without data
Select the Method property page
Click Read
Starting from Hardware Unit#
Before you start the measurement from the hardware unit, make sure the correct setup is stored in the device. To start the PWT standalone:
switch on the hardware unit
- press ENTER on the hardware unit to enter standalone modethe unit will display its main menu
using the up and down arrow keys, select PWT-Power Test, and press ENTER
The unit will display the name of the setup, and the date it was written from dB-Lab
press ENTER to confirm the setup
You can retrieve the data anytime during the measurement,
Connect the PC via USB
select an empty PWT operation in the dB-Lab project window
click the Start button
The device selection dialog will confirm that you attach to the running measurement. Click OK.
dB-Lab will retrieve the data from the device.
You can disconnect and reconnect any time during the measurement.
Note
If you choose “Finish” on the hardware unit to terminate the measurement, the data acquired in the device is lost.
Stand-Alone Sampling#
When the Hardware Unit runs standalone, it might run out of memory for storing the sample data. In this case, PWT will overwrite selected samples, effectively reducing the sample rate of older data without completely dropping all information.
The initial identification and a death report in case of driver failure will never be overwritten.
Replacing DUTs#
Power test performed at multiple units of the same type required statistical analysis are usually started and finished at the same time. However, the PWT software also supports measurements of different loudspeaker types started at arbitrary times by the following steps:
Finish the old PWT, remove the DUTs which are defective or have passed the test
Connect the new DUTs.
Press the DUBLICATE button to copy the old PWT operation and paste a new operation with the same setting as the old measurement
Rename the replaced DUTs but keep the name of the DUTs which continue the power test.
Using Multiple PM8 Devices at one PC#
The PWT software is dedicated to testing a huge number of devices at the same time. Since the measurement hardware has only limited number of output channels you have to stack multiple measurement devices at some point.
Assuming you want to measure 32 DUTs at the same time, you may use four PM8 devices, each connected to eight DUTs.
Connect all PM8 devices to the PC via USB (you may have to use a USB Hub) and open four different dB-Lab instances. You can simply do this by clicking multiple times to the dB-Lab .exe (e.g. on your Desktop).
Note
It’s not required to have four different databases for this test but to have at least four different PWT operations in the same database.
Configure the different PWT operations according to your needs.
Start the first PWT operation and select the first PM8 device which should be used for running this power test. Please note that the “Run” button and some other buttons have changed within the dB-Lab instance so you cannot run the other PWT operations from this dB-Lab.
Go to the next dB-Lab instance and run the second PWT operation within this dB-Lab using the second PM8 device. There will be a hint when selecting the PM8 devices for the test that the first PM8 is already running.
Repeat those steps for all other PWT operations and PM8 devices until all tests are running. You can simply check all DUTs by using the different dB-Lab instances. You may also use the Display Spy (go to dB-Lab menu “Tools” -> “Display Spy”) for getting a fast overview of all connected KLIPPEL devices.
On-Line Monitoring#
Regular Sampling#
During the Power Test all of the parameter estimates and important characteristics of the state variables (peak and RMS values) are sampled periodically and stored in a history buffer within the measurement hardware. Connecting a computer via USB interface makes it possible to upload, view and save the history of the measurement and to investigate temporal variations of the parameters due to thermal, reversible and irreversible processes. The user may define the time elapsing between taking samples (regular sample period).
Status Information#
During the Power Test the status of the DUT may be viewed in detail by the software module Power Test hosted by the dB-Lab frame software. Additionally, the most important information are directly shown on the display at the hardware device:
Number of DUTs connected
Status of the DUTs (alive, malfunction)
Malfunction of the amplifier
State variables (peak displacement, temperature, input power, RMS voltage)
Death Report#
In addition to the regular sampling all values are measured internally at a much higher rate and stored in a ring buffer of the Hardware Unit. In case of an identified malfunction this high sampled data of the particular DUT are copied into the history data buffer. This allows a detailed analysis of the time just before destruction. This information is important to find the cause of the failure.
Malfunction Detection#
A malfunction of the driver will be detected during Power Test. In the case that the electrical resistance is beyond the admissible limits defined in the property page Failure (due to shortcut or loose connection) an emergency switch will disconnect the driver from the power amplifier automatically.
Status Information#
Additionally, the most important information are directly displayed on the display at the measurement hardware. Explained with the following examples:
- \(1*******\)
- \(*2******\)
- \(**3*****\)
\(*******8\)
A measurement with 8 DUTs is actually running.The actually captured channel is indicated by its channel number. The display rotates with the recording interval used for the measurement.All 8 DUTs are alive.A star represents an alive DUT.- \(1***++++\)
- A measurement with 8 DUTs is actually running.DUTs 1 - 4 are alive, DUTs 5 - 8 had a malfunction.A cross represents a malfunction of a DUT.
- \(1***AAAA\)
- A measurement with 8 DUTs is actually running.DUTs 1 - 4 are alive, the amplifier of channel 5 - 8 had a malfunction.An “A” represents a malfunction of an amplifier.
The software module PWT on the PC connected to the processor unit gives more details about the status of the measurement.
Mechanical and Acoustical Parameters#
The minimal setup measures the electrical impedance at the transducer terminals and identifies the electrical system in absolute quantities but the mechanical system as relative quantities only. Importing one mechanical parameter (moving mass \(M_ms\) or \(Bl(x=0)\) at the rest position) allows to calibrate all state variables (e.g. displacement in \(mm\)) and all of the mechanical parameters (e.g. compliance in \(mm/N\)).
In contrast to the Large Signal Identification (LSI) module, the \(R_e\) resistance will not detected measured automatically. This is due to possible networks between PA and DUT for signal conditioning. These networks may not transfer a DC component, which is required for the accurate detection of DC resistance. For that reason this phase will be skipped and the \(R_e\) value must be entered in the Import Property page.
Voice Coil Displacement#
Laser Measurement#
If the Distortion Analyzer DA1, DA2, … is used as hardware platform provided with a laser displacement sensor then the peak and bottom coil displacement of a driver can be monitored during power test and be viewed on Result Window Displacement. To activate the laser measurement, open the PP Method and select 1 DUT and Temperature Mode. Ensure that the laser head is calibrated and optimally adjusted to the driver.
Woofer Identification#
Voice coil displacement can be calculated by using the identified parameters (linear T/S, nonlinear) of the transducer and an imported value of the force factor \(Bl(x=0)\) at the rest position x=0 or the moving mass. In the PWT the imported value is applied to all units (up to 8 DUTs of the same type).
Result Windows#
The results of the measurement give information about state, parameters and setup:
Bl(x) Force Factor#
- \(Bl(x)\)
electro-dynamic coupling factor, also called Bl-product or force factor \(Bl(x)\) versus displacement
Kms(x) Stiffness of Suspension#
- \(K_{ms}(x)\)
stiffness \(K_{ms}(x)\) of the mechanical suspension (inverse of the compliance \(C_{ms}(x)\) versus displacement \(x\)
L(x,i=0) Electrical Inductance#
- \(L_e(x)\)
electrical voice coil inductance \(L_e(x)\) versus displacement \(x\)
Rms(v) Mechanical Resistance#
- \(R_{ms}(v)\)
mechanical damping \(R_{ms}(v)\) versus velocity (micro-speaker identification only)
L(x=0,i) Inductance over Current#
- \(L_e(i)\)
electrical voice coil inductance \(L_e(i)\) versus current \(i\) (woofer, vented-box system only)
Parameters at x = 0#
- Parameters at \(X = 0\)
Summary on electrical, mechanical and thermal parameters at rest position \(X = 0\)
Stiffness Kms(t) and Resonance Frequency fs(t) at Rest Position x = 0#
- \(K_{ms}(t)\), \(fs(t)\)
stiffness \(K_{ms}(t)\) of the mechanical suspension and resonance frequency \(fs(t)\) of voice coil at rest position \(x = 0\) versus measurement time \(t\)
Electrical Resistance Re(t) and Electrical Loss Factor Qes(t)#
- \(R_e(t)\), \(Q_{es}(t)\)
electrical resistance \(R_e(t)\) of the voice coil and electrical loss factor \(Q_{es}(t)\) at rest position \(x = 0\) versus measurement time \(t\)
Sound Pressure Level, Efficiency η(t) and Thermal Power Compression PC(t)#
Efficiency#
The reference efficiency \(\eta_{0}\) of a driver mounted in an infinite baffle and radiating into a half space free field can be calculated from the parameters at the rest position \(x = 0\)
using density \(\rho_{0}\) of air , velocity \(c\) of sound.
Considering heating of voice coil temperature versus time \(t\):
Sensitivity#
The driver mounted in an infinite baffle will produce a sound pressure level \(L_m\) for an electrical input power of 1 W at 1 m distance of
Thermal power compression#
Thermal power compression PC is calculated by considering the variation of the voice coil resistance \(R_{\text{e}}\)
Note
For power compression calculation, always the measured initial resistance \(R_{\text{e}}(T_{\text{V}} = T_{\text{a}}) = R_e(t_0)\) is used. An imported \(R_e\) value has no effect.
State#
- State
Summary on all relevant measurement parameters (time, status of DUTs, … ) and statistical measures (peak values, rms values, …) of transducer state variables
U(t) Voltage and I(t) Current#
- Voltage, Current
peak and rms values of voltage \(u(t)\) and current \(i(t)\) at transducer terminals versus measurement time t
- \(U_{agg}\)
(Voltage, Current window): A graph of the voltage aggregated over all DUTs.
All other curves show the results of only the current DUT selected on the DUTS property page. Since DUTs are sampled one-by-one, the voltage based on the samples does not reflect the true voltage supplied to the speaker.
PDF(u) Voltage Histogram#
- PDF Voltage
probability function of voltage
Increase of Voice Coil Temperature ΔTv(t) and Electrical Input Power P(t)#
- Temperature, Power
voice coil temperature \(T_v\) and real input power \(P\) versus measurement time \(t\)
Note: If a Distortion Analyzer Hardware with a connected laser is used, and the PWT runs in an identification mode, \(P_{mech}\) can also be measured.
Temperature Detail#
- Temperature Detail
voice coil temperature \(T_v\) versus measurement time t at \(5 Hz\) sample rate (available only for monitoring 1 DUT)
Voice Coil Displacement#
- Displacement
peak and bottom value, difference and averaged DC value of voice coil displacement x versus measurement time \(t\)
Setup Parameter#
- Setup Parameter
summary on setup up parameters
Please find detailed information to the results windows in the software module LSI – Large Signal Identification.
Detailed Protocol#
Finishing the measurement by enabling the SAVE button, the PWT software module saves all information in the database file selected in dB-Lab. This database file in Microsoft Access Format may be archived or send to other users (coworkers, providers, customers,…) to visualize, print, analyze the results by using the free dB-Lab Viewer software. All relevant information is stored in this database file.
Brief Protocol#
In addition to the database holding the complete data the PWT module generates a short file
Log.csv in the directory %ProgramData%\Klippel\Logs comprising the most important information
about the measurements performed at the computer.
Column |
Content |
|---|---|
Date |
date at starting measurement |
Time |
time at starting measurement |
Object |
name of object used in database |
DUT-Number |
number representing DUT |
Status |
status of DUT at finish |
Failure |
cause of failure |
Duration |
duration of measurement |
fs [Hz] |
resonance frequency |
Delta Tv [K] |
increase of voice coil temperature |
Urms [V] |
terminal voltage |
Unit |
serial number of processing unit |
Database |
name of database |
Object comment |
comment to object provided by user |
Operation comment |
comment to operation provided by user |
This file may be visualized, printed or used for statistics or query by using standard computer software (e.g. MS Excel).
Post Processing#
Generate Report#
Use the frame software dB-Lab to print any Result Window or generate a report file in html-format to implement logo, comments or additional pictures. The Report Generator within dB-Lab allows to use old reports as templates for new ones by replacing the measurement data automatically.
Extraction Tool#
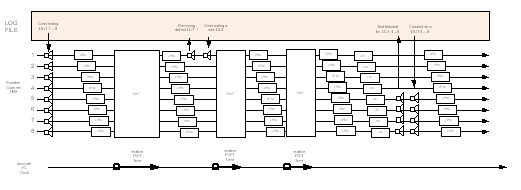
The EXTRACTION TOOL collects the test results of a particular DUT which are stored in multiple operations, objects or even databases by searching for a string identifier stored in the property page INFO or the name of the DUT assigned in the PP DUT.
Intermittent Testing#
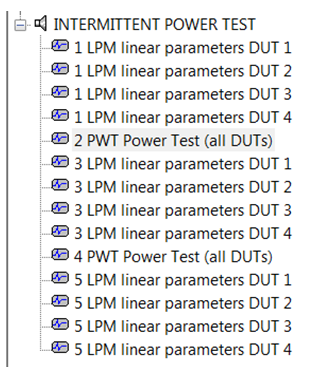
The KLIPPEL PC frame software dB-Lab provides the BATCH PROCESSING of all operations (PWT, LSI, LPM, TRF) belonging to a test object. Multiple PWTs interlaced with LPM – Linear Parameter Measurement are processed sequentially providing the Thiele-Small parameter before, after and at defined time during the power test.
Customizing Setup#
The property pages give access to a variety of setup parameters which may be used to customize the Power Test or to select predefined modes according to AES, EIA or IEC standard.
Property Pages#
The PWT comprises the following property pages to customize the measurement and presentation of the results:
Stimulus#
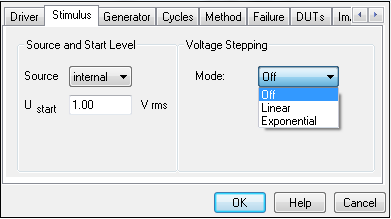
The STIMULUS page gives access to the parameters used for controlling the source and amplitude the excitation signal.
- Source
external
internal
bypass mode
- Starting value of rms-voltage at terminals
- \(U_{start} = u_\text{rms}[0]\) in \(\text{V}_\text{rms}\)Range: \(0.05\) to \(500\)
- Mode (of amplification per step)
off
linear
exponential
- Step size of amplitude amplification (linear)
- \(G_U = u_\text{rms}[i] - u_\text{rms}[i-1]\) in \(\text{V}_\text{rms}\)Range: \(0.01\) to \(999\)Typ: \(0.2\)
- Step size of amplitude amplification (logarithmic)
- \(G_U = 20 \log(u_\text{rms}[i]-u_\text{rms}[i-1])\) in \(\text{dB}\)Range: \(0.01\) to \(6\)Typ: \(1\)
- Maximal amplitude amplification (6 dB steps)
- \(G_{max} = 20 \log(u_\text{rms}[i]-u_\text{rms}[i-1])\) in \(\text{dB}\)Range: \(00\) to \(30\)
Source#
The stimulus may be provided by the internal generator or from an external source. There are three different modes of operation:
- internal
- External Signal:
not applicable
- Functions available:
monitoring, amplitude control, voltage stepping, signal shaping, cycle control
- Parameters available:
\(U_{\text{start}}\), \(G_U\), \(G_{\text{max}}\), \(f_{\text{low}}\), \(f_{\text{high}}\), \(C_R\), \(t_{\text{on}}\), \(t_{\text{off}}\)
- external
- External Signal:
Noise or other staedy state signals
- Functions available:
monitoring, amplitude control, voltage stepping, cycle control
- Parameters available:
\(U_{\text{start}}\), \(G_U\), \(G_{\text{max}}\), \(t_{\text{on}}\), \(t_{\text{off}}\)
- bypass
- External Signal:
Music or any signal
- Functions available:
monitoring, cycle control
- Parameters available:
\(U_{\text{start}}\), \(t_{\text{on}}\), \(t_{\text{off}}\)
Internal Mode
The internal mode generates the stimulus within the hardware (Distortion Analyzer 1 & 2) and dispenses with an external signal source. This mode is recommended for most applications.
External Mode
The external mode uses an external signal (such as a noise signal) with certain requirements:
The signal should have a bandwidth of at least one octave about the resonance frequency of the driver to monitor the mechanical system. For the precise monitoring of the inductance the signal should have some energy \((> -20 dB)\) one decade above the resonance related to the excitation level in the vicinity of \(f_S\).
The signal should have a crest factor of more than 3 dB to separate the lower-order from the higher-order nonlinearities precisely.
The automatic amplitude control requires an input signal with fairly constant RMS-amplitude integrated with a time constant of a few seconds.
Please note that the initial step of woofer identification will be performed by using an internally generated noise signal.
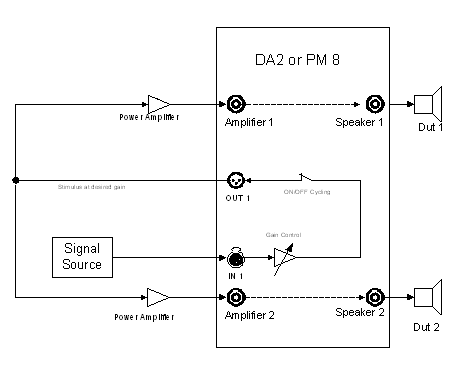
The external mode is recommended for using an external generator providing steady-state signal to IN1 without any interruptions (Do not use music!!)
Bypass Mode
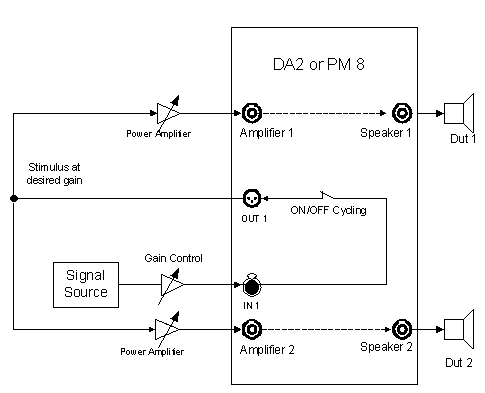
Any signal (artificial test signals or music) may be supplied to the input IN1 of the hardware device and provided via output OUT1 to the power amplifier. Feeding the external signal through the hardware makes it possible to use the internal pilot tone, perform ON/OFF Cycling and to perform a large signal identification (similar to the LSI). Although the excitation signal is not controlled in any way, the hardware needs access to the input of the power amplifier to supply an internally generated noise signal with the starting voltage ustart during initial identification (amplifier mode, linear mode, enlargement mode, nonlinear mode). After the initial identification the external input signal will be supplied to the speaker under test automatically.
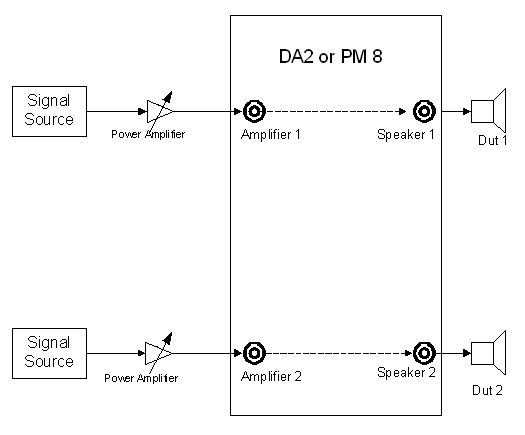
In the mode Temperature identification, a separate signal source may be used for each device under test. The voltage at the terminals is controlled manually by changing the gain at the power amplifier until the monitored voltage at speaker terminals fit the target value. Note that the external signal provides sufficient spectral energy at the pilot tone frequency to measure the voice coil temperature reliably. It is recommended to add a pilot tone by using an external generator.
Ustart#
The starting voltage \(U_\text{start}\) and the parameters from voltage stepping are important parameters for the automatic amplitude control. The processor unit monitors the terminal voltage at the transducer and adjusts the gain of the excitation signal to keep the terminal voltage at the target value. Measuring multiple DUTs with different gains of the power amplifiers the terminal voltage will vary between the DUTs and the terminal voltage of the DUT connected to the amplifier with the largest gain will be controlled to the target values. After performing a measurement, the differences in the measured terminal voltages may be used to adjust the amplifier gain of the remaining DUTs manually. It is recommended to use identical amplifiers or connect the speakers in parallel to the amplifier output.
In Temperature Mode (PWT Lite) the starting value \((0.05 Vrms < U_\text{Start} < 500 Vrms)\) determines the rms value of the terminal voltage at the first cycle of the long-term power test (ON-mode) for an internal or external stimulus source. For a bypassed stimulus source \(U_\text{start}\) will not be used. The test level will be controlled by the stimulus level.
Using the Woofer Identification, Vented System Identification or Microspeaker Identification mode (PWT Pro) the \(U_\text{start}\) value will be used for the large signal identification (Nonlinear Mode) and \(0.25*U_\text{start}\) will define the level for the small signal identification (Linear Mode). For an internal or external stimulus source \(U_\text{start}\) will also be used for the first cycle of the long-term power test (ON Mode). For a bypassed stimulus source, the test level of the long-term power test (ON Mode) will be controlled by the stimulus level.
Voltage Stepping#
If the checkbox voltage stepping is activated the terminal voltage u(t) will be increased exponentially (adding \(G_\text{u}\) in \(dB\)) or linearly (adding \(G_\text{u}\) in \(Volt\)) after completing a cycle of OFF/On intervals. If the total amplification exceeds the value \(G_\text{max}\) the voltage stepping will be finished.
Note that the Voltage Stepping is only available in the Temperature Mode, since it may interfere with the identification algorithm in the Woofer Identification mode, Vented System Identification mode and Microspeaker Identification mode.
Generator#
The internal generator provides the following signals:
pink, white or special filtered noise signals according to standards
a single-tone or two-tone signal of adjustable frequencies and amplitude ratio
a sinusoidal sweep with adjustable start and end frequency and sweep time
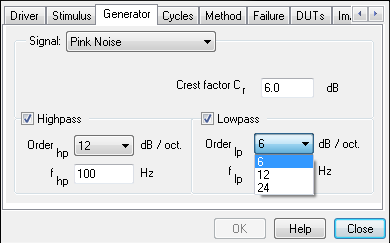
Spectral Characteristic#
The internal noise generator may produce white, pink or special shaped noise according IEC and EIA standards under the condition that the crest factor \(C_\text{r} = 6dB\) and the band-pass filter is disabled.
Crest Factor#
The generated noise signal will be supplied via an optional band-pass filter to a compressor to realize the crest factor \(C_\text{r}\) specified in the property page \((6 dB < C_\text{r} < 18 dB)\).
Highpass / Lowpass#
Optionally, the generated noise (pink, white, IEC, EIA) may be filtered by applying a butterworth filter, giving a band-pass characteristic with adjustable cut-off frequencies \(f_\text{low}\) and \(f_\text{high}\), respectively. The user may choose a slope of \(6 dB/octave\), \(12 dB/octave\), or \(24 dB/octave\) respectively. The high- and low-pass characteristic may be disabled separately.
Note
This page is disabled for an external stimulus used in external or bypass mode.
Cycle#
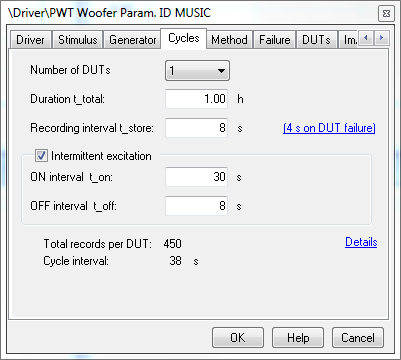
Intermittent Excitation#
Using the external or external mode the amplitude of the stimulus may be switched alternately between two phases.
The intermittent excitation may be disabled or enabled.
The on–interval has a duration of \(t_\text{on}\).
During the off-interval with duration \(t_\text{off}\) the amplitude of the excitation signal is not set to zero but only reduced by \(-20 dB\) to maintain a measurement of the voice coil resistance.
If voltage stepping is enabled in the Stimulus page the voltage will be increased by \(G_\text{step}\) after each ON/OFF cycle.
Duration#
Elapsing the total measurement time \(t_\text{total}\) the system sets the measurement in the PAUSE mode automatically. The user may finish or continue the measurement for another time of \(t_\text{total}\).
Update Cycle#
The update cycle period \(t_\text{store}\) describes the time between regular sampling of the parameter and state information for each DUT during the long-term power mode. It is recommended to use a relatively large sampling interval \((1 min)\) to keep the size of the database small. The death report will give you further details (at maximal sampling rate) about the end of the power test for the particular device under test.
Note
The update cycle period \(t_\text{store}\) is not applied to the initial identification which works with a short update cycle by default.
Method#
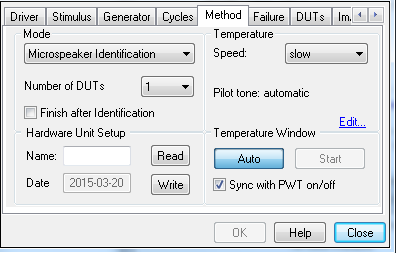
The property page METHOD comprises the following properties:
Mode#
The PWT provides two modes of operation
1. Thermal Identification
This mode monitors the voice coil temperature and other electrical state variables only. The identification of the mechanical properties is disabled. This mode is not restricted to woofers but can be applied to tweeters and loudspeaker systems having a passive crossover. It is recommended to set the frequency of the pilot tone to low frequencies or at a minimum of the electrical impedance to measure the dc resistance Re as accurate as possible.
2. Transducer Identification (Woofer, Vented-box system, Micro-speaker)
This mode identifies the electrical, mechanical and thermal state variables and parameters of a transducer measured in free air or mounted in a sealed or vented enclosure. The resonance frequency \(f_\text{s}\) should be below \(800 Hz\). If voltage stepping is activated in the external or internal mode all linear and nonlinear parameters are permanently identified during the ON-Cycle. If the stimulus is a single tone or any other audio signal providing no persistent excitation, the system cannot identify all parameters and stops the learning process and displays a message “POOR EXTERNAL EXCITATION”. If the voltage stepping is not activated then some nonlinear parameters identified during the initial identification are still valid during the main power test (ON-OFF cycling) and the updating of the highly time varying parameters. Voice coil resistance \(Re(t)\), voice coil offset \(x_\text{off}(t)\), the resonance frequency \(f_\text{s}(x = 0, t)\), stiffness \(K_\text{ms}(x = 0, t)\) and damping \(R_\text{ms}(x = 0, t)\) are permanently active. The time-varying parameters are always updated during the Bypass mode.
Number of DUTs#
The power test software can be used to measure multiple DUTs \((n ≤ 8)\) at the same time. If the stimulus is generated by the hardware platform (DA2 or PM8) it is recommended to use DUTs of the same or similar transducer type. Multiple stimuli generated by external sources may be also used when an asynchronous pilot tone is added to each stimuli. The frequency and amplitude of each pilot tone should be adjusted to the particular DUT (tweeter, woofer or passive system).
If the number of DUTs is equal to ONE the voice coil displacement may be measured by a laser sensor connected to the DA2 hardware platform and the peak and bottom value and the integrated DC displacement is displayed in the result window Displacement. Those measured displacement values may be compared with the values calculated by the nonlinear transducer model and the parameters derived from voltage and current monitoring.
Monitoring only a single DUT gives also the possibility to record the variation of the voice coil temperature at higher measurement speed \((> 250 ms)\) in the result window TEMPERAURE DETAIL.
Temperature#
The voice coil temperature is estimated by measuring the electrical impedance at frequency \(f_\text{p}\). A small pilot tone at frequency \(f_\text{p}\) is added to the stimulus to ensure persistent excitation even in the OFF phase during cycling. This technique dispenses with a DC signal required in traditional temperature monitoring which causes a voice coil offset. It can be realized by using conventional ac-coupled amplifiers.
Speed of Temperature Measurement#
The speed of the temperature measurement depends on the modes (FAST, SLOW), the number of DUTs multiplexed by the measurement and the frequency \(f_\text{p}\) of the pilot tone required to measure the DC resistance \(R_\text{e}\) at the minimum of the electrical impedance. Moving average with the measurement time constant \(τ_\text{m}\) applied to the measured resistance is required to suppress measurement noise and the influence of the back-EMF generated by the interaction of the stimulus (e.g. music) and the complex part of the electrical impedance. However, a measurement time constant \(τ_\text{m}\) which is longer than the thermal time constant τ of the speaker will reduce the steepness of the measured thermal transients and will generate an error in the thermal parameters.
The FAST mode gives the highest accuracy for measuring the transient response of the voice coil temperature with an acceptable signal to noise ratio. The measurement speed can be further increased by monitoring only one DUT (number of DUTs = 1) and to select the optimum pilot tone frequency \(f_\text{p}\). Temperature monitoring of one woofer requires a low frequency of the pilot tone \(f_\text{p} ≤ 8 Hz\) which requires that the thermal time constant \(τ > 2.5s\). Micro-speakers, headphones and tweeters having a shorter thermal time constant \(τ > 250ms\) require a higher pilot tone frequency \(f_\text{p} > 8 Hz\) selected in the manual pilot tone setting.
Pilot tone frequencies \(f_\text{p} ≤ 8 Hz\) (recommended for woofers) limits the measurement time constant to \(τ_\text{m} ≥ 2.5 s\). Pilot tone frequencies \(f_\text{p} > 8 Hz\) (typical used for Micro-speakers, headphones and tweeters) limits the measurement time constant to \(τ_\text{m} ≥ 250 ms\).
The SLOW mode gives the best signal to noise ratio for steady state signals (noise stimulus) while providing sufficient measurement speed to detect an overload situation and defect of the speaker.
Pilot tone frequencies \(f_\text{p} ≤ 8 Hz\) (recommended for woofers) limits the measurement time constant to \(τ_\text{m} ≥ 10 s\). Pilot tone frequencies \(f_\text{p} > 8 Hz\) (typical used for Micro-speakers, headphones and tweeters) limits the measurement time constant to \(τ_\text{m} ≥ 3 s\).
Monitoring multiple DUTs \((n = 2 - 8)\) at the same time will be realized by channel multiplexing in \(1s\) intervals. It will limit the measurement time constant to \(n*τ_\text{m}\) according \(n\), the number of alive DUTs.
Edit Pilot Tone#
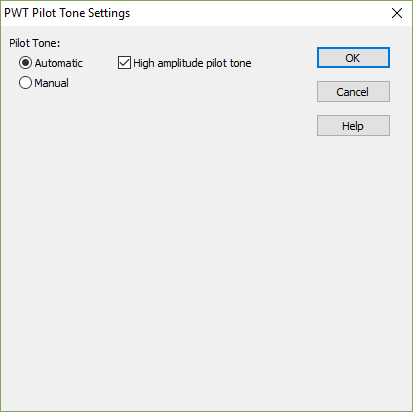
Automatic Adjustment of the pilot tone
The frequency \(f_\text{P}\) of the pilot tone is automatically adjusted to the used power amplifier. If the cut-off frequency of the high pass is too high, resulting in too much damping at 2 Hz the frequency \(f_\text{P}\) will be increased to \(4 Hz\) or \(8 Hz\). A warning will be generated in the result window STATE.
The amplitude of the pilot tone can be selected (default or high) and is automatically controlled according to the size of the stimulus. The High amplitude pilot tone is recommend for most measurements and selected in all templates.
Manual Setting
The Manual Setting (available in Temperature Identification only) gives full freedom in customizing the frequency and amplitude (voltage at output OUT2 or OUT2) of the pilot tone. The voltage of the pilot tone at the loudspeakers terminals is monitored and displayed in the result window STATE.
Temperature Detail#
If only 1 DUT is measured the result window Temperature Detail shows the temperature characteristic sampled at \(200 ms\) resolution for the last approx. 7 h. The user may operate the temperature buffer by using the following commands:
Start
Pressing the button Start will initiate a new recording.
Automatic
If the button Automatic is enabled the recording starts with the beginning of the measurement. Only the last approx. \(7 h\) will be kept in the temperature detail buffer.
Sync with PWT on/off
If the checkbox Sync is enabled then a new recording will be initiated with the beginning of the next OFF cycle. In case this checkbox is unchecked, the full measurement time will be kept in the temperature detail buffer (containing all ON and OFF cycles).
The curve stored in the window Temperature Detail may be copied at any time to the clipboard and imported to the generic window Temperature, Power.
Hardware Unit Setup#
The complete setup information may be stored in the hardware unit to enable stand-alone operation:
Specify a name to identify the setup on the display of the Hardware Unit after starting the PWT measurement.
Press Write to download setup parameters in Hardware.
Press Read to upload setup parameters to PWT software module.
Number of DUTs#
Specify the number of DUTs connected to the hardware unit. The Distortion Analyzer 1 or 2 can monitor up to two devices. A special hardware unit Power Monitor 8 allows to measure up to 8 devices simultaneously.
Note
Connect DUTs in rising order with terminal Speaker 1, Speaker 2,… and specify maximal DUT number in the method property page to speed up the initial identification and maintaining highest update rate.
Failure#
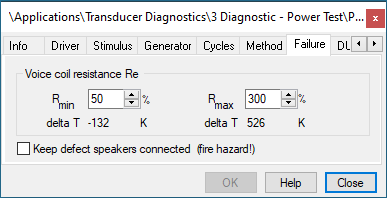
The parameters \(R_\text{min}\) and \(R_\text{max}\) on this property page are the admissible limits
for variation of the electrical resistance \(R_\text{e}(t)\) referred to the resistance of the cold voice at the beginning of the measurement. Exceeding this limits will be detected as a malfunction and the particular DUT will be disconnected from the power amplifier.
If the checkbox below is enabled all defective DUT are still connected to the amplifier and the measurement will be continued even there is a failure (no amplifier, no pilot tone) is detected. This is very useful for the adjusting the amplitude of the pilot tone generated by an external signal source or for checking the correct connection of a driver. If the cause of the failure is removed the warning and exception message will disappear.
Note
It is recommended to remove all defective transducers (electrical short cut!) in normal power testing to protect the power amplifier and to avoid any fire hazard.
DUTs#
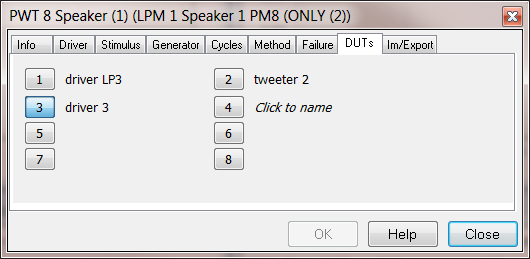
Select the unit to be displayed in the result windows. A name can be assigned to each DUT measured in the power test to identify the DUT later in the post processing.
Im/Export#
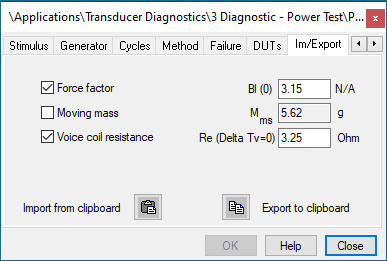
In the power test you have to import some information about the transducer to see the states and parameters calibrated in absolute units. You can do the import before, during or after the measurement. Please specify at least the resistance \(R_\text{e}\) of the cold voice coil and the force factor Bl at the rest position or the moving mass \(M_\text{ms}\).
You may enter the numbers manually into the editable boxes or use the clipboard.
The imported \(R_\text{e}\) value will be drawn as solid line up to the end of the Initialization in Temperature Mode or up to the end of the Linear Mode in the Woofer-, Vented System- or Microspeaker Identification Mode in the \(R_\text{e}(t)\) result window. It allows to compare the PWT measured initial \(R_\text{e}\) with the imported \(R_\text{e}\).
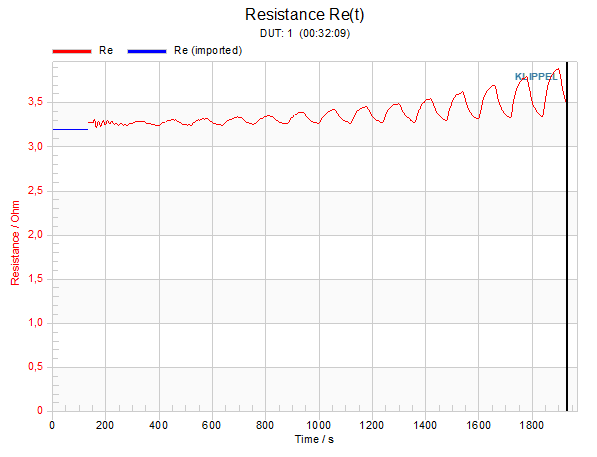
A higher PWT measured initial \(R_\text{e}\) is typically caused by a pre-warmed voice coil due to previous measurements or using a too high excitation during Linear Mode (Identification Mode). If the \(R_\text{e}\) import is activated the \(\text{Delta Tv (referenced)}\) result curve in the POWER, POWER result window represents the total temperature increase from referenced ambient conditions. It must be guaranteed that the LPM measurement results used for the import into LSI have be done at referenced ambient conditions.
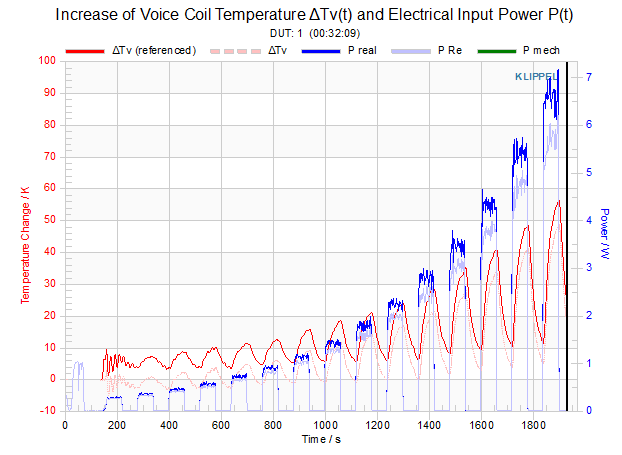
In the shown example with imported \(R_\text{e}\) the voice coil temperature was still about \(7K\) above reference temperature, compared to the results without imported \(R_\text{e}\) there the Temperature rise starts at \(0K\).
If \(R_\text{e}\) was imported \(\text{Delta Tv (referenced)}\) will be displayed. The measured \(\text{Delta Tv}\) (displayed with dashed line) could additionally be displayed by activating it in the graph subsets. (Right mouse click into the result graph / Customize…)
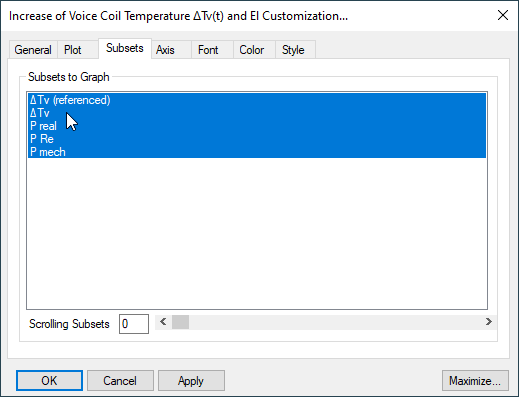
Export to Clipboard#
You may copy the following information to the clipboard:
Setup parameters from the property pages
Large Signal Parameters
Import from Clipboard#
You may read the following information from clipboard
Setup parameters used in the property pages
Import parameters \(Bl(x=0)\), \(M_\text{ms}\), \(R_\text{e}\)
Note
If you are importing setup parameters then the results (primary data) of an old measurements will be deleted. Press Cancel to maintain data and copy import parameters \(Bl(x=0)\), \(M_\text{ms}\), \(R_\text{e}\) only.
Save Setup Parameters#
The setup parameters may be stored in the Hardware Unit and may be activated by starting the hardware in stand-alone operation.
In dB-Lab, frequently used setups can be stored as template, and be used as setting for newly created operations. To do so, select the PWT operation with the preferred setup, and choose Edit / Save as Template from the menu. For detailed information, please refer to the dB-Lab Reference.
You may also copy the setup to the clipboard and importing this information to other PWT operations by using the EXPORT/IMPORT property page.
Supported Modules for Im/Export#
Note
Export of nonlinear parameters only available for PWT Pro.
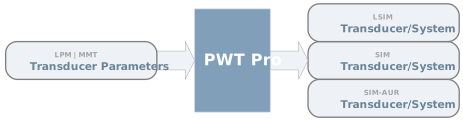
Malfunction and Troubleshooting#
Overview#
This chapter will provide information that can help you to solve common problems that occur with the Hardware unit.
If you cannot find a description here that matches your problem, try these options:
Check the Malfunction and Troubleshooting section in dB-Lab.
Check the release notes (CD:Readme.txt and CD:install.txt) that you received with your Klippel Analyzer product. This document contains information about new features, fixed bugs, last minute information and installation problems.
If you cannot find any information about your specific problem, please contact us via KLIPPEL support.
Software Messages#
No Device-Dependent Calibration#
- Error message:
“No device dependent calibration data used, only default values!
- Reason:
The Hardware unit is not calibrated. All results acquired are invalid.
- Solution:
Choose Cancel to cancel the measurement. Switch the hardware unit off, and on again, and start the measurement again.
If the error occurs again, contact KLIPPEL support or your local distributor for calibration of the hardware unit.
Another Operation is running#
- Error message:
“Another operation is running!”
- Reason:
This message is displayed if you try to store a custom PWT setup in the hardware unit, but the unit is busy running another operation
- Solution:
Check the hardware unit display if an important operation is running. Cancel or finish it, depending on your needs.
Please check the relevant module’s documentation on how to save the results of standalone operations.
Data already available#
- Error message:
Data is already available. If you continue, this data will be discarded!
- Reason:
You are changing a setup parameter that has an effect on the measurement results. (e.g., changing the stimulus parameters).
- Solution:
Click Cancel to keep the results with their original setup. Click OK to discard the previous measurement results and accept the setup change.
New measurement active#
- Error message:
A new measurement is active in the Distortion Analyzer. Please start the corresponding operation to reconnect with the device.
- Reason:
The operation running in the hardware unit has been changed by external means (standalone, second instance of dB-Lab, etc.).
- Solution:
The operation that displays this message will disconnect from the hardware unit, allowing the new operation to continue.
Selected setup exceeds standalone buffer#
- Error message:
“The selected setup exceeds the standalone buffer of the hardware unit. Sample rate will be reduced after ca. … h running standalone. We recommend splitting the results of long term measurements with high sample rates into several measurements”
- Reason:
The Power Test Settings you have chosen creates more data than can be stored in the hardware unit when running standalone.
- Solution:
If you keep the PC connected, it will periodically retrieve the data from the hardware unit, so you can ignore this warning.
Parameter not valid#
- Error message:
“Parameters not valid!”
- Reason:
The Hardware Unit did not accept the setup that was provided from the PC.
- Solution:
Switch off the hardware unit, switch it on, and start the power test again. Make sure you have the latest Firmware installed. If the error occurs repeatedly, please contact KLIPPEL support.
Hardware Messages#
Frozen identification#
- Cause:
The external stimulus provides not sufficient excitation and the learning of the parameter is stalled.
- Remedy:
Increase the gain of the external excitation signal, check the input selected or provide a broadband signal having sufficient energy below and above resonance frequency \(f_{\text{s}}\) of the driver.
Amplitude below target#
In the PWT module the user may define the amplitude of the signal for an external and internal stimulus and the automatic gain control will adjust the amplitude of the amplifier output with highest signal amplitude to this target value.
- Cause A:
Message displayed temporarily especially during Initialization mode.
- Remedy A:
The message just indicates that the algorithm controlling the gain is still converging to the target value.
- Cause B:
Message displayed for some of the speaker channels. Other Amplifier channels having a lower sensitivity may provide an amplitude below the target. If the difference is above 10 % a warning will be generated.
- Remedy B:
If a measurement channel for a particular DUT produces a permanent warning then the sensitivity of the power amplifier should be increased.
Low external signal#
- Cause:
The amplitude of the external excitation signal (audio or test signal) provided via input IN1 is low. In the mode “EXTERNAL” the automatic gain control cannot realize the desired voltage at the terminals of the loudspeaker.
- Remedy:
Check cable and connection of the external source to IN1. Check the amplitude of the signal (about 1 Volt rms).
High Fitting Error#
- Cause:
The difference (error \(E_{\text{i}}\)) between measured and estimated current is a measure for the fitting of model. A driver with regular properties which corresponds with the model produces an error 5 … 20 %. A higher value of \(E_{\text{i}}\) as shown on the PP STATE indicates a poor fitting. In most cases it is caused by a high value of the voice coil inductance and irregular impedance response due to the para-inductance. Additional elements such as crossover, a second transducer (tweeter) in parallel connection is also not considered in the modeling and will increase the residual error.
- Remedy:
Enable the automatic noise adjustment or adjust the noise manually on the property page GENERATOR. Repeat the measurement. Remove additional elements from the transducer.
High amplifier error#
- Cause A:
The output signal of the power amplifier is limiting.
- Remedy A:
Please use an amplifier with higher output capability or operate a stereo amplifier in bridged mode. Then repeat the measurement.
- Cause B:
The power amplifier causes significant time delay.
- Remedy B:
Disable digital signal processing or additional time delay in the power amplifier.
Maximal output gain#
- Cause:
The internal and external mode of the PWT adjusts the voltage of the stimulus at the output OUT1 to the maximal value to realize the target value \(U_{\text{rms}}\).
- Remedy:
Increase the sensitivity of the power amplifier or use the stereo channels in bridged mode.
Minimal output gain#
- Cause:
The protection variables exceed the allowed protection limits in the small signal domain \((G_{\text{large}} = 0 dB)\). Thus the amplitude of the excitation signal is too high in the small signal domain.
- Remedy:
Stop the measurement. Decrease the amplitude of the excitation signal in the small signal domain by attenuating \(G_{\text{small}}\) in the property page PROTECTION or decrease the gain control at your power amplifier. Then start the measurement again.
Driver fs too high#
- Cause A:
The instantaneous resonance frequency of the driver is above the allowed maximal value.
- Remedy A:
The present system is dedicated to woofer systems. However, you may add additional mass to the diaphragm and consider this mass in the measured parameters. In the near future we will provide a version dedicated to midrange and tweeter systems.
- Cause B:
The transducer cannot be modeled by a 2nd-order system but shows additional acoustical or mechanical resonances (vented box system).
- Remedy B:
Mount the driver in a sealed enclosure or measure the driver in free air.
Driver fs too low#
- Cause A:
The instantaneous resonance frequency of the driver is below the minimal value.
- Remedy:
Mount the driver in a sealed enclosure and consider the additional stiffness of the enclosed air in the measured parameters.
- Cause B:
The transducer cannot be modeled by a 2nd-order system but shows additional acoustical or mechanical resonances (vented box system).
- Remedy B:
Mount the driver in a sealed enclosure or measure the driver in free air.
Nonlinearity too high#
- Cause:
In the PWT module the maximal amplitude is not controlled by the limit parameter \(Bl_{\text{lim}}\) and \(C_{\text{lim}}\). If the driver is not limited by the thermal behaviour the working range might exceed the maximal variation of the nonlinear parameters \(Bl_{\text{min}} < 25 \%\) and \(C_{\text{min}} < 20 \%\) caused by the constraints of the digital modeling (DSP implementation).
- Remedy:
Increase the thermal load by increasing the amplitude of the high-frequency components in excitation signal (white noise, higher cut-off frequency of the lowpass).
DAC limiting (output)#
- Cause:
The signal at the Output 1 of the Hardware Unit exceeds the allowed limit.
- Remedy:
To provide sufficient amplitude at the speaker’s terminal in the large signal domain the gain of the external power amplifier should be augmented (increase the gain control at the power amplifier or operate the stereo amplifier in bridged mode). Then start the measurement again.
Ext. input limited#
- Cause:
The peak value of the external stimulus is limited at the ADC.
- Remedy:
Increase the gain of the power amplifier.
Power test finished#
- Cause A:
In the PWT module the user may define the duration of the testing on the PP Cycles. After this time the measurement will be finished and this message will be generated if the hardware is operated in stand-alone mode.
- Remedy B:
Connect a PC to the hardware unit and safe the data stored in the history of the hardware unit.
- Cause B:
If the duration of the test will be shorter than the Initialization lasts the test will not reach its ON state.
- Remedy B:
Increase the duration until the Initialization could be finished. The duration will be reset after the Initialization.
ADC limiting (sensor)#
- Cause:
The peak value of the measured current or voltage signal is too high and the analog to digital converter is limiting.
- Remedy:
If your hardware (Distortion Analyzer) is configured with a low and a high current sensor, and you are measuring on the low current sensor, repeat the measurement on the higher current channel. Usually, Speaker 2 is configured with a low current sensor (5 A).
Consult KLIPPEL support to modify the sensors on the hardware platform able to measure higher signal.
General Exception#
- Cause:
A problem in the digital signal processing has been detected.
- Remedy:
Please save this measurement (copy the database) and contact KLIPPEL support. Generate a new object and repeat the measurement.
Driver failure#
- Cause:
At the beginning of the PWT measurement the voice coil resistance of the cold voice coil is measured and stored as a reference. If the resistance varies beyond the limits defined in the PP Failure the respective DUT is disconnected from the power amplifier. This warning may indicate a thermal overload of the driver, and electrical shortcut or a loose connection of the driver.
- Remedy:
Check your driver. If your driver is ok increase the limits on the PP Failure to avoid this warning and exception and restart the measurement.
No driver connected#
- Cause A:
During the measurement of the reference resistance (at the beginning of the power test) the current at the driver’s terminals is too low. Usually the driver is not connected to the terminal SPEAKER 1.
- Remedy A:
Make sure that the driver is connected properly to the processing unit. Restart the measurement.
- Cause B:
The resistance of the transducer is too high.
- Remedy B:
Please contact KLIPPEL support. We may help you to get a customized version of the Processing Unit, which is dedicated, for transducers with high electric impedance (head phones, shakers).
Low Amplifier output#
- Cause:
The voltage measured at the output of the power amplifier is too low. Usually the power amplifier is switched off or the manual gain control is attenuated.
- Remedy:
Check the power amplifier and restart the measurement.
No DSP capacity#
- Cause:
The DSP runs out of operation.
- Remedy:
Please send this operation in a database to KLIPPEL support.
Thermal protection#
- Cause:
The thermal protection is active.
- Remedy:
Reduce the external input signal.
Mechanical protection#
- Cause:
The mechanical protection system is active.
- Remedy:
Reduce the bass content of the external input signal.
Low pilot tone#
- Cause:
The external pilot tone is too small to identify the voice coil temperature.
- Remedy A:
Increase the amplitude of the pilot tone in the manual pilot tone setting on Property Page Method.
- Remedy B:
Remove additional highpass in the power amplifier or reduce the cut-off frequency.
