
EQA – Equalization + Alignment#
EQA - Tutorial#
Overview#
The Equalization + Alignment task (EQA) is a versatile add-on module for the QC end-of-line testing framework of the Klippel Analyzer System. It is dedicated to adjusting the frequency response and level of audio systems. Both single tone and sweep stimulus signals are provided for this purpose.
Stimulus shaping is applied to automatically align the output to a user defined target response. The resulting level profile may be used for applications like microphone testing with equalized sound sources. In manual mode, the operator is assisted in adjusting external controls like gain or EQ filters with minimal time and learning effort.
What is the Goal of This Tutorial?#
This tutorial makes you familiar with the EQA for one of the typical applications, namely sound source equalization for microphone testing.
It is divided into the following steps:
Setting up the hardware
Adding an EQA task
Adjusting target settings
Performing a first measurement
Viewing results
Applying equalization data to an SPL task
Hardware Setup#
The hardware setup may vary significantly depending on the EQA applications.
The example introduced here shows a setup for microphone testing. For this application, usually a passive reference sound source is required which is connected to a Speaker output terminal of the Production Analyzer (PA) as shown in this example or the QC Card or Speaker Card of the KLIPPEL Analyzer 3 (KA3). An amplifier is connected to drive the sound source. For KA3, the Amplifier Card may be used instead. This sound source is equalized using a reference microphone connected to the second microphone input of the analyzer (PA MIC2 or KA3 QC Card IN2). The actual microphone under test is connected to the primary microphone input.
A schematic overview of this setup is shown below. In this example, a microphone coupler is used to make sure that both microphones are facing equal acoustic conditions.
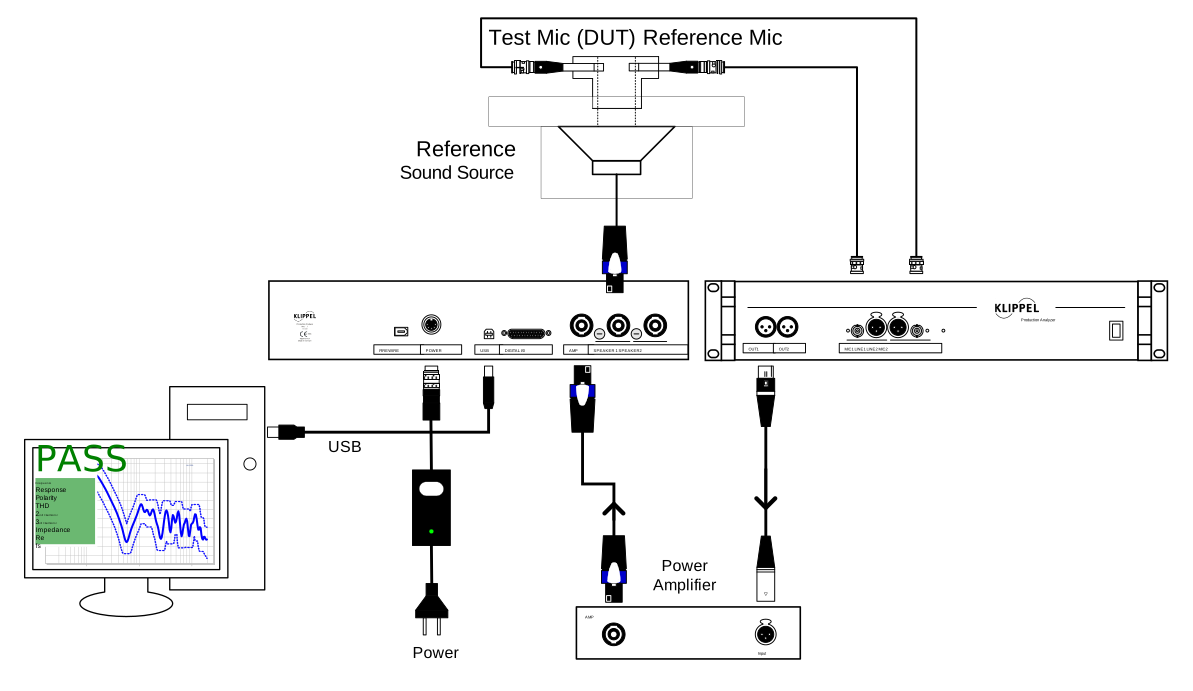
For more details about setting up the hardware please refer to QC User Manual section Connecting the System.
Note
The stored microphone sensitivity may have to be adjusted after changing the microphone setup connected to the analyzer. At least the reference microphone must be calibrated correctly.
Creating a Test with an EQA Task#
QC System Framework#
The QC System provide a test template dedicated to microphone testing including the EQA task.
Open the QC Start - Engineer
Select
Choose a name and select the template , then click OK.
You can start the test now by clicking on the Start button.
R&D System Framework#
If you are operating the EQA within the KLIPPEL R&D System framework, you may add a test containing both EQA and SPL task by using the provided operation template
Create or open a KLIPPEL database
Add a new operation by using the operation icon or
Select and ; you may enter EQA in the filter input field to quickly find the template
Choose a name and click OK to create a new QC operation
Click Run
 to log in
See dB-Lab Software Manual for more information.
Adding the EQA Task to an Existing Test#
To add the EQA task to your existing test sequence:
Login as Engineer and
Open Property Page Tasks
Use the Add… button and select
%ProgramData%\Klippel\QC\Scripts\Klippel\QC\Modules\eqa.task.klb
to add the EQA to the existing sequence.
Use the arrow buttons to move the Equalization/Alignment to the top of the sequence.
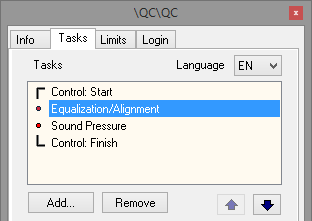
Note
This example application uses the EQA to equalize the frequency response of a reference sound source online (in each test run). Therefore, it will be added to an existing test which contains a Sound Pressure task which will apply the results of the EQA. Alternatively, the EQA can be used in a stand-alone test to provide static EQ data offline for a different target test.
Setting up the EQA#
In the task list, select Equalization/Alignment to access the settings of the EQA.
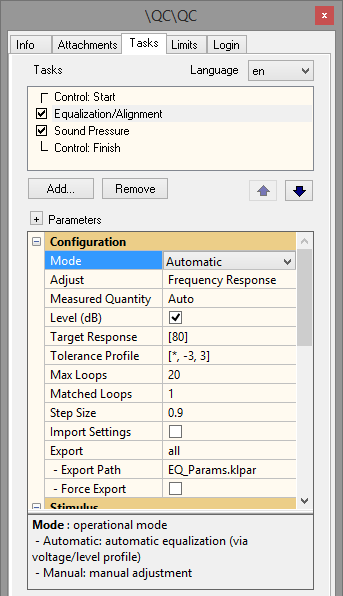
Only a selection of parameters is explained. For full settings reference please see section Task Parameters.
Category Configuration#
This parameter category defines the main operation mode and target values of the EQA. Only selected parameters are addressed here, as the default settings are suitable for this example application. Task mode – Automatic is already selected to request automatic equalization.
Target Response#
This parameter defines the target frequency response in dB or the selected unit. The initial setting corresponds to a flat response of 80 dB within a frequency band from 100 Hz to 10000 Hz.
The EQA will determine an equalization level profile based on the frequency response measured by the reference microphone in order to meet the Target Response. Tolerance Profile defines the accuracy limit for a successful equalization.
Note
Set the target response level and frequency range according to the physical capabilities of the sound source.
Export Params#
To easily apply equalization settings to the Sound Pressure task later on, activate parameter export in the EQA. In case the equalization process is successful, the selected settings are exported to a plain text parameter file (*.klpar).
Selecting all will export all parameters related to the stimulus setup including voltage, frequency range, resolution etc. In case of Voltage (Profile), only the EQ curve (level profile) incl. reference voltage Max Voltage is exported.
Category Stimulus#
The parameter category Stimulus defines the test signal.
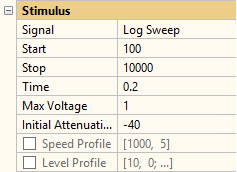
Note
Best performance is achieved if the Stimulus settings are identical during equalization and application. All settings can be imported by the Sound Pressure Task automatically.
Stimulus Signal#
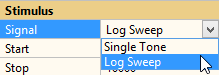
Either Single Tone or Log Sweep may be selected as test signals. For tuning the frequency response, select Log Sweep.
Start, Stop, Time#
These parameters define bandwidth and duration of the sweep signal.
Note
Please note that the start and stop frequency must be within the frequency range defined by the Target response.
For more information, please refer to QC User Manual section Test Signals.
Max Voltage, Initial attenuation#
Max Voltage defines the maximum sinusoidal RMS voltage that may be applied for equalization. The selected output routing defines whether this voltage is defined at the signal outputs of the or the speaker terminal (amplifier output).
Parameter Initial attenuation defines the stimulus level applied during first run relative to Max Voltage.
Note
The parameter Max Voltage defines the 0 dB reference voltage for the resulting Voltage Profile (EQ curve) which is defined as a pure attenuation (< 0 dB).
Speed Profile, Voltage Profile#
These parameters affect the time-frequency resolution and frequency-dependent AC amplitude of the log sweep signal. Refer to QC User Manual section Sine Sweep for more information.
Note
In Automatic mode the Voltage Profile only applies during first run of a measurement because this parameter is controlled for the actual response equalization. However, it may be used for defining a reasonable start value to speed up the equalization process.
Category Routing#
Parameter category Routing is hidden in the EQA task if the in- and output routing is defined globally. As different input channels are used in this example, navigate to Control:Start in the task list and set parameter Routing – Input to controlled by Task.
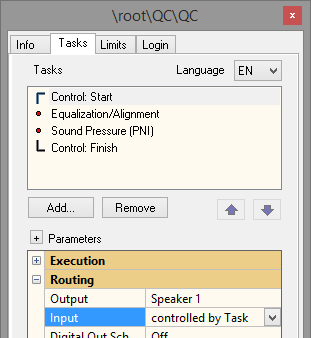
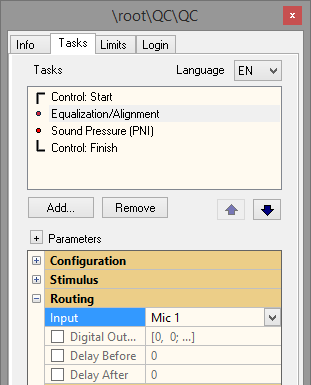
Now input routing is defined individually in each task. In EQA Routing section select Input – Mic2 to use the reference microphone connected to MIC2 for equalization.
Note
The input sensor type of the selected input (stored during sensor calibration) is considered automatically if Measured Quantity is set to Auto.
Performing a First EQA Measurement#
Running the Test#
Before starting the test for the first time, make sure that all remaining tasks in the sequence are set up properly to prevent harm to the connected device. In the first run the equalization results are not applied to other tasks in the sequence.
Click the Start button in Control Panel to start the measurement. In the first run of the EQA, the raw frequency response is measured at the voltage defined by parameters Max Voltage and Initial attenuation. The response is compared to the target response to derive a first equalization Level Profile.
The EQA is looped in order to improve matching of target and measured response. As soon as the results fulfill the specified tolerance limits, the test sequence will continue with next test step.
Viewing EQA Results#
Curve Results#
The settings made in EQA parameter group Display define which curves are displayed. Curves results are only available in Log Sweep mode.
Frequency Response, Rub&Buzz#
The equalized frequency response is displayed in Frequency Response window along with the target response and the accuracy limits. The light blue curve in the example plot below is the original frequency response of the Sound Pressure task which follows the EQA.
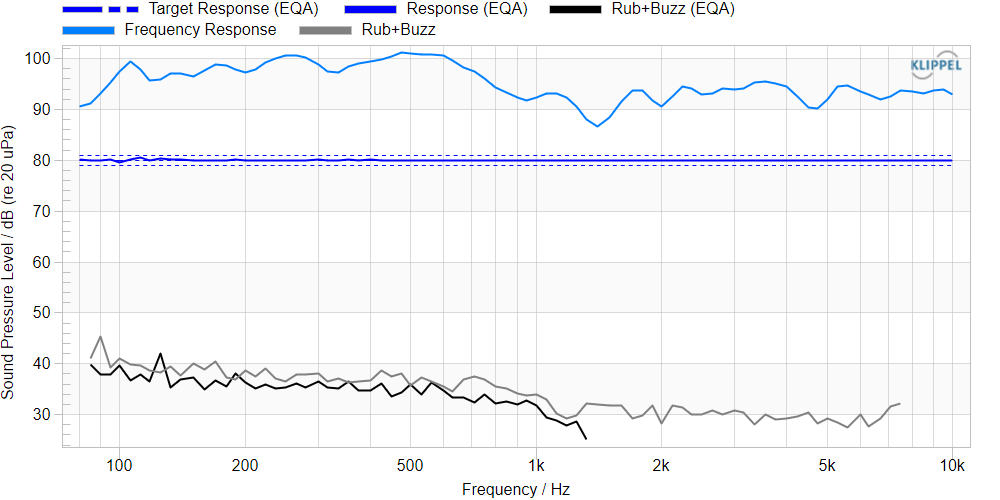
In case Show Rub+Buzz is activated, the Rub&Buzz curve is also displayed in this window. It can be used to check for any irregular disturbance during the equalization or whether there is defect in the sound source or reference microphone.
Mismatch#
Due to the axis scaling of the Frequency Response window, the deviation between measured and target response is hardly visible in some cases. Therefore, Mismatch (relative deviation) of the two curves may be displayed in Mismatch window.
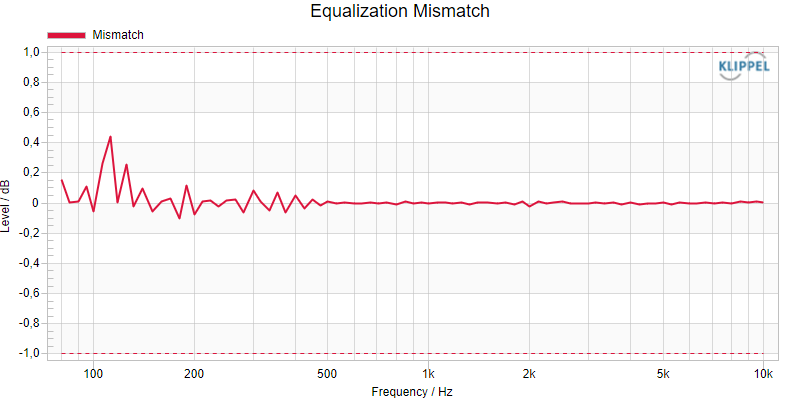
Also, the Tolerance limits as defined by parameter Tolerance profile are displayed.
THD#
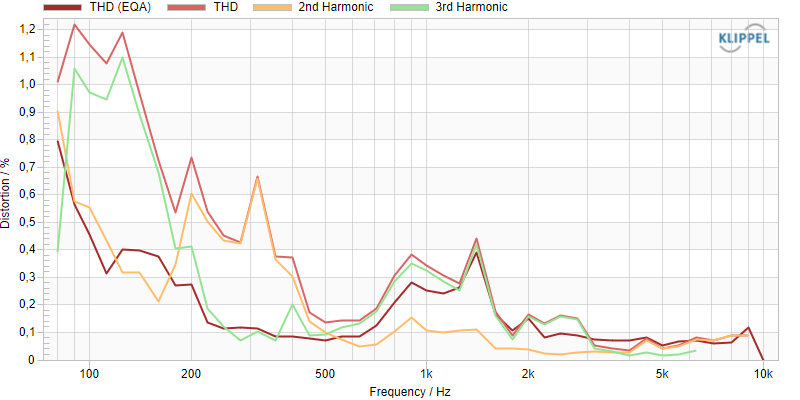
Total Harmonic Distortion (THD) can be measured as an absolute SPL (window Frequency Response) or relative to the fundamental response as shown below. The lightly colored curves are results of the Sound Pressure task.
Level Profile#
The Level Profile as displayed in window Level Profile is the main result of the EQA in Automatic Log Sweep mode.
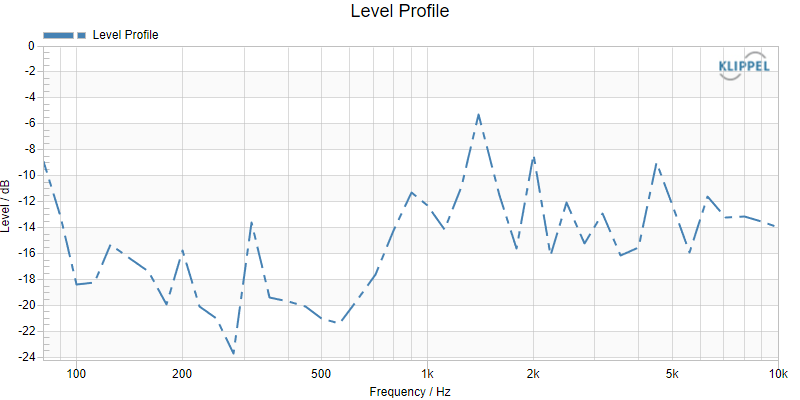
It displays the equalization profile used to shape the sine sweep in order to achieve the current frequency response. The profile is defined as an attenuation relative to the base voltage. Therefore, it is always smaller than 0 dB that corresponds to Max Voltage as defined in the EQA parameters.
Summary Window#
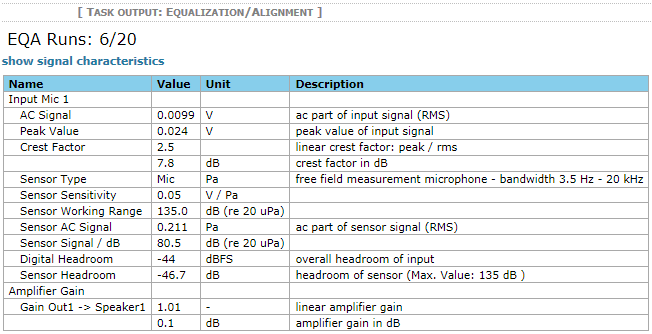
In Log Sweep mode, there is no output of the EQA in the Summary Window except for the task’s signal characteristics. Click on the link to open the signal characteristics table.
If the test is performed with limits, an EQA test verdict may be added to the verdict list on request (parameter Add task result in Limit Calculation Mode) contributing to the overall verdict.
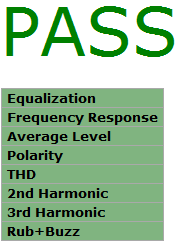
The verdict is PASS in case the equalization was successful.
Exported Parameters#
If EQA parameter Export Params is activated, all relevant results of the equalization are exported to a plain test parameter file. This text file may be opened and edited in any text editor.
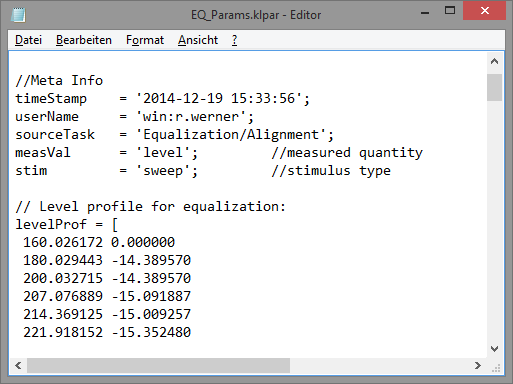
Depending on the selected setting, the level profile and reference voltage as well as other stimulus related settings such as start and stop frequency are exported by the EQA.
Note
The exported file complies the general parameter file format of the QC system used for settings and limit import. Please refer to section Parameter Export and QC User Manual for more information.
Applying EQA Results#
This section focuses on applying the results of the automatic equalization to a Sound Pressure task. Both, manual and automatic export/import of equalization settings is possible.
Manual Import#
Although equalization parameters may be exchanged easily via parameter files, manual import is possible as well.
All related stimulus parameters except for the actual equalization curve may be copied from the EQA setup parameters directly. For best performance copy the values of
Start, Stop frequency
Time
(Max) Voltage
Resolution
Speed profile
to the corresponding parameters of the Sound Pressure task. Copy at least Max Voltage, however.
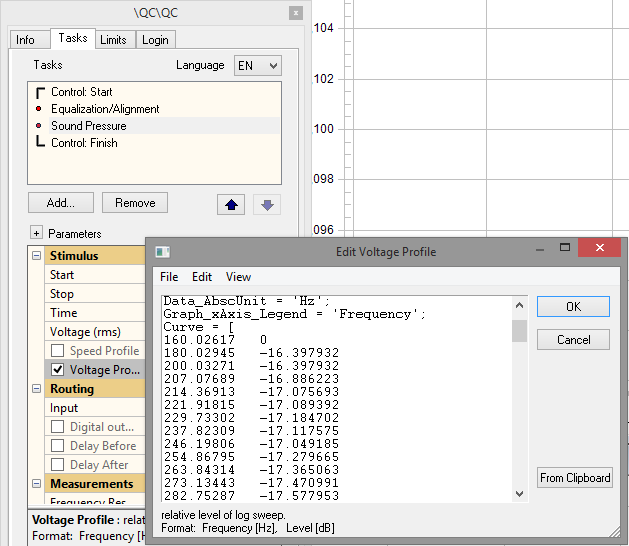
To import the equalization curve, copy curve Level profile (EQ) from Level Profile window and paste it to parameter Voltage Profile of the Sound Pressure task.
Automatic Import#
The most convenient way for transferring EQA results to other measurement tasks is importing the parameter file generated by the EQA. This plain text file can be imported by other measurement tasks such as Sound Pressure or Sound Pressure + Impedance to exchange settings like Voltage Profile.
Setup#
In this application example, the equalization data shall be forwarded live during test runtime, which means to a target task in the same test sequence. The equalization data shall be updated in each test run.
To enable settings import, activate Import Settings in the Configuration settings of Control:Start task. Now parameter Import Settings will be available in the Sound Pressure task. Select On-line mode to make sure that the parameters are imported in each test run. Use the “…” button of Settings file to open a file dialog and navigate to the settings file generated by the EQA in the last run. Otherwise use a relative path and enter the file name corresponding to the setting of the EQA export.
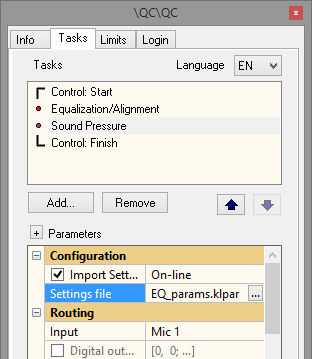
If the specified file is valid, it will be imported immediately. All imported parameters are hidden in the user interface to prevent ambiguity.
For more information about settings import please refer to QC User Manual.
Note
For many applications it is not necessary to update EQ settings in each test run. This is especially the case if overall test time is critical. In this case, create a separate test for equalization and use Off-line parameter import (only performed during login).
Results#
Click Start button in Control Panel to perform the first measurement with settings export/import.
The EQA will repeat and adjust the control parameters until the desired response is achieved. After successful equalization, the corresponding settings are exported to the parameter file. Before the Sound Pressure task measurement is started, the updated settings are imported and applied.
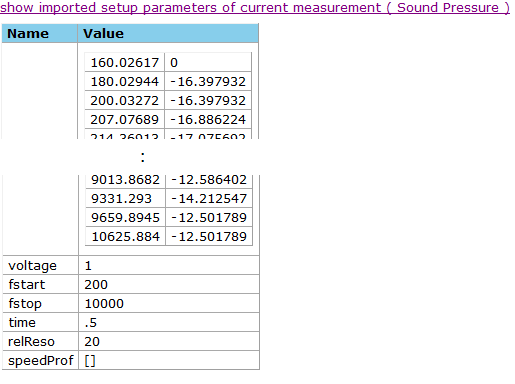
The imported settings may be checked in the Summary window by clicking the link show imported setup parameters… as shown below
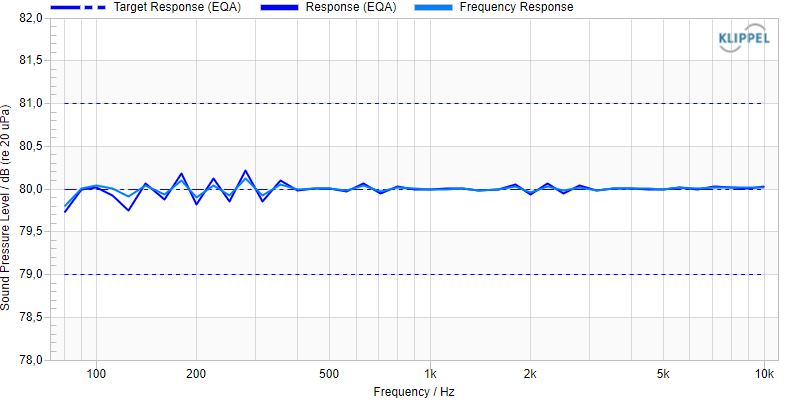
To verify whether the equalization was successful, check the Sound Pressure frequency response in Frequency Response window. In the example below, the responses match quite well.
Note
Please note that the Sound Pressure tasks uses the microphone connected to MIC1. Therefore, the residual deviation represents the difference of the reference microphone and the DUT. In the next step testing limits may be applied to the equalized frequency response.
Measuring with Imported Stimulus Settings#
Measurement Results#
If the parameter import was successful the test can be started as usual by pressing the Start button. The sound source will reproduce the desired target SPL response at the equalized reference position.
Thus, the measured SPL response reveals the transmission characteristics of the currently connected DUT by the deviation to target response according to the reference microphone.
Note
A poor frequency response of the reference microphone will lead to wrong absolute equalization results. Altering the measurement position also influences the performance. Especially at high frequencies, the source directivity may lead to strong deviations, even at very small variations of position.
Checking the Imported Settings#
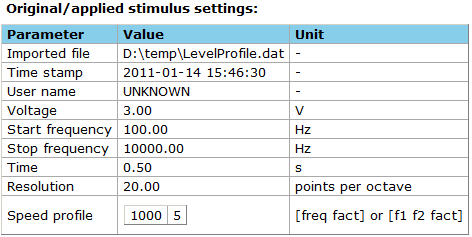
As all imported task parameters are hidden in the Property Page Tasks, the imported parameters are shown in a table in the Summary window. The file path, the time stamp and the user name of the settings file is also displayed.
Working with the EQA Task#
Task Modes#
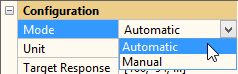
The EQA provides different modes of operation for various applications.
Automatic Mode#
The automatic mode is mainly dedicated to providing defined and reproducible reference conditions for other test applications. In this mode, a target condition (e.g., frequency response, level at specific frequency) may be defined by the user. The EQA will automatically adjust stimulus parameters like Voltage and Voltage profile (equalization curve) in an iterative process to meet the target response. This is illustrated in the figure below.
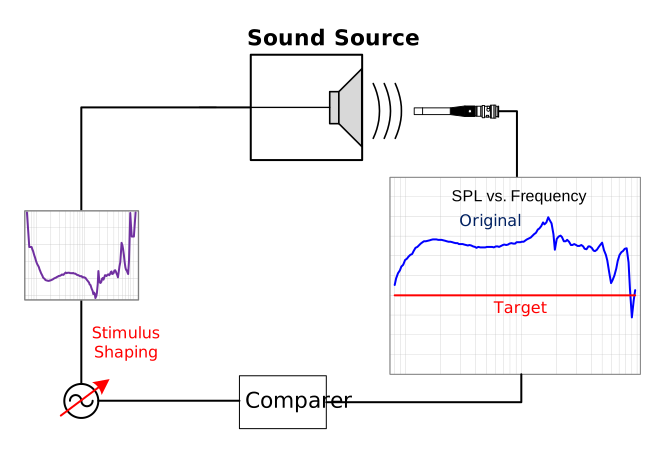
Schematic overview of EQA task mode “Automatic” in sine sweep mode
The resulting parameters may be used for applications like microphone testing, where a reference sound source shall provide a defined sound pressure frequency response. To learn more about this mode and the practical application, refer to the EQA - Tutorial.
Manual Mode#
In contrast to automatic mode, the manual mode focuses on assisting the operator in adjusting physical controls (e.g., equalizer, volume control) to align a device’s response to a defined target response or level as illustrated below.
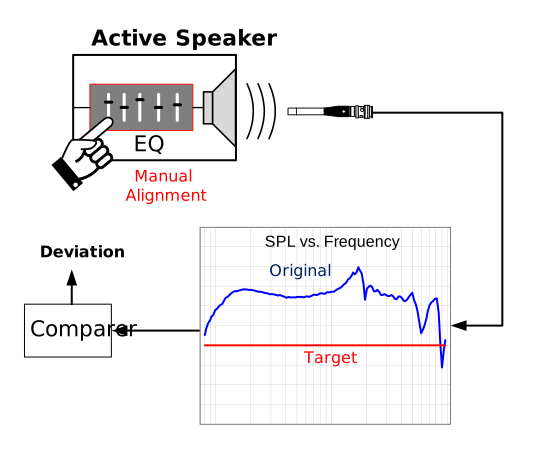
Schematic overview of EQA task mode Manual in sine sweep mode
The measurement is repeated with static stimulus settings until the target is achieved through adjusting external control parameters. During this process, the current response deviation is monitored.
Assisted Mode#
The assisted mode takes manual adjustment to a higher level by assisting the operator with determined instructions. During initialization, the EQA learns the characteristics of hardware controls like multi-band equalizer by monitoring the effect on the system response (e.g. frequency response).
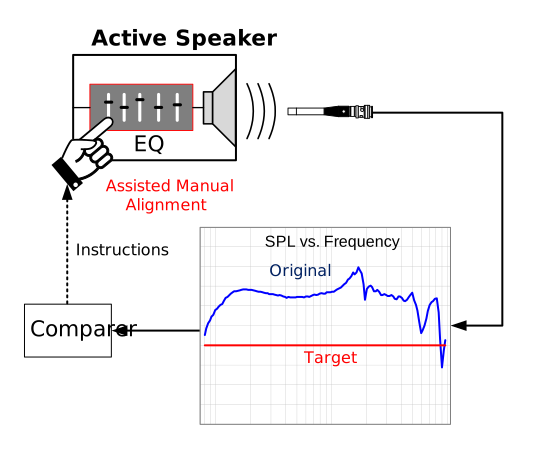
This knowledge is used in application mode to adjust the available controls in a determined and optimal way in shortest time. The instructions given by the EQA are even suitable for untrained operators.
Note
Assisted mode is not released yet. Please contact support if you are interested in taking part in the beta test program.
Stimulus Signal#
The EQA may be operated with a logarithmic sine sweep or a single tone stimulus. Selecting the right signal depends on the target application.
Log Sweep#
The Log Sweep signal shall be applied for all applications related to adjusting the voltage or sound pressure frequency response. In Manual Mode an identical sine sweep defined by the Stimulus settings is played back and looped. In Automatic Mode, Voltage Profile is adjusted iteratively to modify the log sweep amplitude versus frequency.
To find out more about using this mode, refer to EQA - Tutorial.
Single Tone#
Sine tone excitation mainly applies for adjusting level and sensitivity of a device at a defined frequency.
Setup#
Setting up the EQA in Single Tone mode is more simple compared to the Log Sweep mode as described in section Setting up the EQA. Set parameter Stimulus Signal to Single Tone to switch to fixed frequency measurement mode.
Configuration#
In Single Tone mode, both Automatic Mode and Manual Mode are supported. Adjust defines the signal characteristic to be measured (RMS, peak, peak-to-peak), while Measured Quantity and Level (dB) define the unit of the measurement results and the target definition. The following parameters are adapted accordingly.
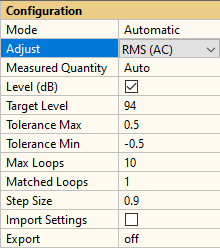
Target Level or Target Value, define the target value for the measured response. The allowed relative deviation of this target value is defined by Tolerance max and Tolerance min.
Stimulus#
In parameter category Stimulus, the frequency and duration of the test tone are defined. An optional Preloop may be specified to achieve steady-state conditions before the measurement starts. The Preloop factor is defined as a fraction (or multiple) of Time.
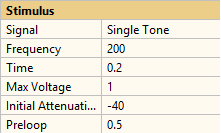
Excitation level definition again depends on the Task Mode. In Manual Mode, the RMS voltage of the stimulus is defined directly by parameter Voltage (rms). In Automatic Mode the voltage is adjusted to meet the Target Level. Therefore, only a maximal applicable voltage (Max Voltage) and Initial attenuation for the first run are defined.
Measurement#
In contrast to sweep mode, no curves are provided for single tone measurement. All information is displayed in Summary window as shown below.
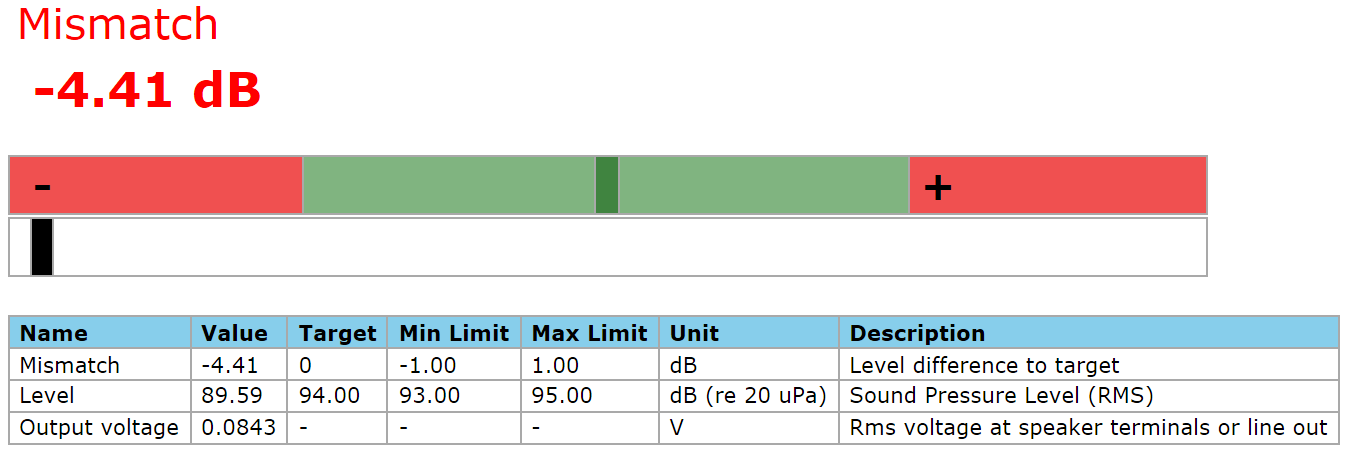
A result table displays the measured level as well as the corresponding mismatch to the target value and the tolerance limits. The mismatch also displayed on top the result table in a bar diagram. The color zones indicate whether the current mismatch is within (green) or out of tolerance (red).
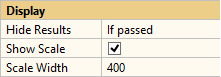
The darker green bar marks the target level, the complete tolerance range is represented by the light green area while the red ranges mark results above (+) or below (-) tolerance. The black cursor represents the mismatch of the last run, the position is updated in each loop. As soon as it is located in the green range, the alignment will be successful. The scale may be deactivated parameter section Display. Also, the total width may be adjusted here.
Results#
In Automatic Mode the only relevant result is Output voltage which can be found in the result table. It indicates the RMS voltage of the stimulus which must be applied to achieve the desired target level.

In case Export Params is activated, the complete set of stimulus parameters will be exported to a text file. Please refer to section Exported Parameters for more information.
Parameter Export#
The EQA provides file-based result parameter export to simplify the application of equalization data to other measurement log sweep-based modules such as Sound Pressure or Sound Pressure + Impedance.
Activating Export#
Parameter export may be activated in EQA parameter category Configuration as shown below.
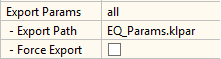
The Export Params drop down list allows choosing whether the full parameter set (all) or only stimulus voltage and Voltage Profile (equalization curve) shall be exported.
Note
Export Params is only available in Automatic Mode.
Export Path specifies target folder and file name. It provides a file dialog to navigate to the desired folder. By entering a relative path directly into the text input field, the file will be exported relative to the current test folder. This is recommended if the file shall be imported by another task in the same test sequence.
Note
The file ending of the parameter file is always forced to be “*.klpar”.
Force Export controls whether the parameter shall be exported independent of the equalization result or only if the equalization has passed.
Parameter File#
The parameter file exported by the EQA is a plain ASCII text file that complies with the general parameter file syntax of the QC system (QC User Manual section Settings Import).
The file contains the settings and results relevant for equalization or alignment as well as the target settings and meta information as shown in the example below.
// Klippel QC Parameter File

// - this file can be used for settings import (if supported by task)

// - the curves can be viewed in any chart of dB-Lab using copy & paste

//Meta Info

timeStamp = '2014-12-23 14:19:39';

userName = 'win:j.doe';

sourceTask = 'Equalization/Alignment';

measVal = 'auto'; //measured quantity

stim = 'sweep'; //stimulus type

// Level profile for equalization:

levelProf = [

80.002094 0.000000

90.002355 -25.568735

100.002617 -25.568735

139.502029 -28.599719

194.590164 -30.799974

271.450134 -31.192230

378.668488 -31.120710

528.201416 -31.640611

736.832397 -33.089319

1027.869141 -36.566045

1433.765869 -40.724842

1577.142456 -40.724842

];

GraphTitle = 'Voltage Profile';

Data_AbscUnit = 'Hz';

Graph_xAxis_Legend = 'Frequency';

Data_Legend = 'Attenuation in dB';

// Target response:

targetRespEQA = [

100 85.000000

10000 85.000000

];

GraphTitle = 'Target Response (EQA)';

Data_AbscUnit = 'Hz';

Graph_xAxis_Legend = 'Frequency';

Data_Legend = 'SPL in dB';

// Tolerance profile:

toleranceProf = [

%nan -0.500000 0.500000

];

// Stimulus settings during equalization:

voltage = 4.000000; //reference voltage (at Speaker)

voltageAmpMax = 4.000000; //max. allowed voltage (at Out)

fstart = 100.000000; //start frequency

fstop = 2000.000000; //stop frequency

time = 1.000000; //Sweep time

relReso = 2.000000; //Sweep resolution

InitialAtt = -40.000000; //initial stimulus attenuation

// Speed profile:

speedProf = [];

calcFiltResp = 1; //equalization performed with filtered response
The file may be opened and edited in any text editor. To plot the curves, you may simply copy any curve from the file and paste it in an arbitrary chart of dB-lab.
Note
Modifying the parameter file is at your own risk. The imported parameters are checked for validity, though.
Re-Importing Results for Speed Optimization#
Not only measurement modules like Sound Pressure support importing
The settings file generated by the EQA may not only be imported by other measurement tasks, but also (re-)imported by the EQA to optimize the start values for equalization. This can minimize the number of loops for equalization significantly if there is only minor variation expected among the test runs or DUTs.
Import Settings may be activated in parameter category Configuration as well.
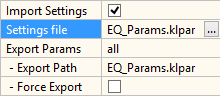
The parameter file may be specified using an absolute or relative path (compare Export Path).
Note
Settings are only imported at login. Therefore, you are asked to logout and login again after activating settings import.
Measurement and Control of Dynamic DC Component (DCX add-on)#
In case a license for the add-on module DCX – Dynamic DC Check is installed, additional task parameters are activated in order to measure and control dynamic DC bias in the response waveform. A typical application is dynamic DC displacement as generated by transducers with asymmetric nonlinearities (e.g., micro-speakers). The waveform, envelope and dynamic DC of any input signal may be measured and controlled. The DC component can be removed optionally using DC Voltage Profile.
Find more information in DCX Manual.
Note
For DC measurement, the used analyzer must be DC-coupled. For DC control, a KLIPPEL Analyzer 3 and an Amplifier Card, QC Card or external DC coupled amplifier is required.
Multi-Channel Data Aggregation#
Some test applications require spatial averaging of multiple microphone’s responses. An example is equalizing and measuring the audio system response inside a car using a microphone array instead of a single point measurement. For this purpose, the EQA provides the option to aggregate most of the test result parameter, such as frequency response based on multi-channel responses. Please refer to QC Manual section Multi-Channel Data Aggregation for more information.
Some features of the EQA are not compatible with multi-channel processing:
Show Waveform display option
Measurement of displacement envelope and DC component (DCX add-on)
EQA - Reference#
Task Parameters#
This section lists and describes all available setup parameters of the EQA. These parameters are necessary to customize the measurement task.
Configuration#
- Task Mode
Select mode of operation:
Automatic - automatic equalization
Manual - manual adjustment
Assisted* - assisted manual equalization
* This mode is not released yet. Please contact KLIPPEL support for further information.
- Adjust
This parameter defines which parameter of the input signal shall be adjusted
- Measured Quantity
Select measured physical quantity (defines unit)
Auto: set automatically based on sensor calibration for selected input
Voltage in V or dB (re 1 V)
- Level (dB)
Display and specify data as level in dB
If deactivated, absolute values according to Measured Quantity are used
- Target Response[3]
Desired response vs. frequency (level or abs. value)
Format: matrix with two columns
[ frequency in Hz, value in <unit> or level in dB ]
- Target Level[4]
Desired response level in dB
- Target Value[4]
Desired response value; unit depends on setting Measured Quantity
- Tolerance Profile[3]
Maximal allowed relative deviation between target and measured response
Format: matrix with three columns
[frequency in Hz, min. deviation in <unit> or dB, max. deviation in <unit> or dB]
- Tolerance max/min
Max. upper/lower deviation in dB or unit defined by Measured Quantity
- DCX - Remove DC[1] [3] [5] [6]
control (dynamic) DC component in input waveform
removes any time-variant bias of AC signal using DC Voltage Profile
follows DC definition set by parameter DC - Offset Mode
Note
Note: DC removal only possible if the signal chain is entirely DC coupled
- DCX - Hx(0) [1] [3] [5] [6]
(in mm/V) enter typical transfer factor (Hx=X/U @ DC) for DC control
if empty, this parameter is estimated from AC response (may degrade performance)
Note
Use a greater value to prevent overcompensation
- Maximal Loops
Maximal number of repetitions allowed
- Matched Loops
Min. required number of loops within tolerance to pass equalization/adjustment
Note
Note: values greater than 1 ensure stable result and may improve result accuracy
- Step Size[1]
convergence speed for automatic equalization
use 1 for quick convergence and best accuracy; use values <1 in case of instabilities or overshoot
- Import Settings
Activate task settings import from external file
Only available if Import Settings in Control Task is activated.
- Settings File
Absolute or relative path of parameter file for settings import
Only shown if Import Settings is active and unequal none
- Export[1]
export resulting parameters to text file
off
all - all relevant parameters
Voltage (Profile) - only EQ curve (only for sweep) and voltage
- - Export Path[1]
Absolute or relative target path for parameter export
- - Force Export[1]
Always export result parameters, even if equalization has failed
Stimulus#
- Signal
select excitation signal
Log Sweep – continuous logarithmic sine sweep
Single Tone – single sine tone
- Start[3]
Start frequency of log sweep
Note
Note: value must be within band limits of Target Response
- Stop[3]
Stop frequency of log sweep
Note
Note: value must be within band limits of Target Response
- Frequency[4]
Stimulus tone frequency
- Time
Duration of stimulus
- Max Voltage [1]
Maximum RMS voltage that may be applied for equalization/alignment
Voltage is defined at the speaker terminals (amplifier output) or at line input (amplifier output) depending on output routing
- Max DC Voltage[1] [3] [5] [6]
maximal DC voltage that may be applied for automatic DC control
only shown if Remove |ab-DC| is activated
- Voltage[2]
RMS stimulus voltage
Voltage is defined at the speaker terminals (amplifier output) or at line input (amplifier output) depending on output routing
- Max Stimulus Level[1]
maximal stimulus level (dBFS peak) for audio device
- Stimulus Level[2]
Stimulus level (dBFS peak) for audio device
- Initial Attenuation[1]
Attenuation of stimulus level for first run relative to Max Voltage or Max Stimulus Level in dB
- Preloop[4]
Preloop factor for single tone excitation
Relative duration of pre-excitation before measurement starts Number is specified relative to (multiple or fraction of) Time setting
- Apply Previous Results[1]
Use parameters of last successful equalization as start value for next run
This option is recommended to speed up equalization for similar DUTs
- Speed profile[3]
relative speed of log sweep
Format:
f1 in Hz, f2 in Hz, Speed factor
or
f in Hz, Speed factor
- Level profile[3]
relative level of log sweep
Format:
requency in Hz, Level in dB
- DC Voltage Profile[3] [5] [6]
Add DC or low frequency bias voltage to log sweep signal vs. excitation frequency
Format:
(Sweep) Frequency in Hz, Value in V
Routing#
- Custom File for Import
path of task-specific custom wave file for processing (raw data import)
(only available in case of wave file processing )
- Output Channel
select output channel(s) of playback device
(only available for 3rd playback audio device output and if global Output is set to controlled by Task)
- Output
Output channel to be used:
Speaker 1
Speaker 2
Out 1
Out 2
Out 1 + 2
only visible, if Routing / Output in Control Task is set to controlled by Task.
See QC User Manual section Output Routing for Klippel Hardware for details.
- Speaker 1 connect
Connect terminal Speaker 1 to power amplifier output
only visible, if Routing / Output in Control Task is set to controlled by Task.
- Speaker 2 connect
Connect terminal Speaker 2 to power amplifier output
only visible, if Routing / Output in Control Task is set to controlled by Task.
- Input
select signal input
Mic 1
Mic 2
Line 1
Line 2
Mic linked to Speaker
Line linked to Speaker
Mic linked to Speaker (swapped)
Line linked to Speaker (swapped)
Voltage Sp1
Voltage Sp2
only visible, if Routing / Output in Control Task is set to controlled by Task.
See Input Routing for Klippel Hardware for details.
- Input Channel
select channel of capture device or wave file for test sensor signal
Only displayed with 3rd party capture device or Execution Mode - Load Input Signals and if Test Sensor Input is set to controlled by Task
Note
For re-processing exported wave file data (see QC Manual section Save Input Signals) use channel #1
- - Additional Channels
Select additional channels for Multi-Channel Data Aggregation
Only displayed for 3rd party capture device or Execution Mode - Load Input Signals and if Test Sensor Input is set to controlled by Task and Allow Multi-channel Aggregation is activated.
- Digital output
Set GPIO before test.
only visible, if Routing / Output in Control Task is set to controlled by Task.
- Delay before
Delay before playback (after GPIO setting, if requested).
only visible, if Routing / Output in Control Task is set to controlled by Task.
- Delay after
Delay after playback (after GPIO setting, if requested).
only visible, if Routing / Output in Control Task is set to controlled by Task.
Processing#
- Windowing of IR [3]
- No windowingvon HannHammingBlackmanKaiserKaiser 6Tukey 50Tukey 25RectangleCosine3
Select window type used for impulse response windowing (see QC Manual section Windowing of Impulse Response).
Note
Windowing is only available when adjusting Frequency Response.
- align to delay
places window relative to main impulse of impulse response (delay)
private parameter for Windowing of IR
- offset
- in ms
offset of window center (private parameter for Windowing of IR)
- length
- in ms
length of window (private parameter for Windowing of IR)
- Kaiser beta
private parameter for the Kaiser window only
- right half only
only decaying half of the window is used (private parameter for Windowing of IR)
- Result Frequencies
Defines frequency points of result curves within measured frequency range
R10-R80: preferred frequencies (ISO 266)
By resolution (ref. 1 kHz): define resolution using standardized frequencies relative to 1 kHz
User Defined: define resolution (relative to start frequency) - use this mode for compatibility with previous versions of the QC software
- - Resolution[3]
Number of result points (frequencies) per octave
Deactivated for Import stimulus settings - all
- Response - Mode
- Full Signal: response contains fundamental and harmonic components \({\widetilde{p}}_{\text{total}}\left( f \right)\)Fundamental: response contains only fundamental component \({\widetilde{p}}_{\text{f}}\left( f \right)\)
Select calculation mode for sweep frequency response (if impulse response windowing is not applied) and single tone response.
- DC - Smoothing[3] [5]
part of octave used for smoothing of DC curve, no smoothing is applied if empty
- DC - Offset Compensation[3] [5]
DC offset compensation for measured envelope and DC component (e.g. remove constant DC bias in laser signal)
high frequencies: enforce zero at max frequency
low frequencies: enforce zero at min frequency
specified value: enter constant bias value
none: no compensation
- DC – Offset Value[3] [5]
absolute offset applied to measured DC and envelope response
unit of entered value depends on setting Measured Quantity
- RBz – Highpass
Private Parameter for Rub&Buzz:
high pass tracking cut-off frequency rel. to fundamental.
See QC User Manual section Optimize Rub&Buzz Detection.
- RBz – Type
Private Parameter for Rub&Buzz:
RMS: repetitive defects (e.g. rubbing)Peak: short, impulsive defects (e.g. loose particle)- Input Gain 1/2
Input preamplifier gain for Mic 1/2 and Line 1/2 input to optimize SNR
Note
Negative input gain cannot compensate overload of analog input stage. The effective range and available gain steps depend on used analyzer/card, please refer to hardware specification.
- Recording Delay
Fixed delay of captured signal relative to generator in ms (in addition to effective delay)
Display#
Troubleshooting#
Error Messages#
Maximum voltage reached. Limiting.#
During automatic equalization the maximal allowed stimulus voltage as defined by parameter Max Voltage (rms) has been applied without achieving target level. The process is aborted.
Remedies
Increase Max Voltage (rms)
Decrease Target Level or Target Response
Check connections – is there any signal played back and response signal picked up?
Check bandwidth – are all devices in the signal chain physically capable of delivering the desired level in the specified frequency range
Check for particular frequencies that cause the limiting (e.g. due to acoustical cancellation)
Maximum number of loops reached.#
The target level or response could not be achieved within the maximal number of repetitions allowed.
Remedies
Increase Maximal Loops
Increase target tolerance
Check signal to noise ratio of measurement – is the measurement impaired by noise?
Check for ambient noise which may cause result variation
Check for variation in the signal path during measurement – conditions must be static (for Automatic mode)
Handling Deviation between EQA and Sound Pressure Task#
Matching Stimulus Parameters#
The performance of the equalization might decrease and violate the tolerance limits if the stimulus settings differ significantly from the settings during equalization. This is especially the case for deviations of the measurement time, resolution and when using speed profiles. Therefore, variations should be kept minimal for optimal performance. It is recommended to import all stimulus settings, not only Voltage Profile.
Smoothing#
The equalization is performed without any smoothing applied to the frequency response. Therefore, applying Smoothing in the target application might lead to different results in the response curve, especially for abruptly changing target curves. Equalization with a flat response target should not be affected by smoothing.
Frequency Response Mode#
In all sweep-based test tasks the frequency response can be calculated in two different ways. It can be based on the full signal response (fundamental + harmonics) or on the fundamental component only. When operating the DUT in the large signal range, the results can differ. Therefore, make sure to use the same settings in all tasks. The parameter Response - Mode is available in parameter category Processing.
Windowing of Impulse Response#
The Sound Pressure task provides optional impulse response windowing for removing room reflections from the frequency response. This processing can have a significant effect on the resulting frequency response curve. Windowing should be deactivated for equalization, in most cases. Otherwise, make sure to use matching windowing settings. See section Windowing of Impulse Response for more information.
