
KET – Klippel Endurance Test#
KET - Getting Started#
Klippel Endurance Test (KET) runs long-term, power and accelerated life tests for typical quality assurance applications such as validation checks or type approvals.
If you are setting up your Klippel Endurance Test for the first time, please have a look to the KET Getting Started Video. There you find all necessary information from the setup of hardware and software to the first measurement.
KET Overview#
Safety Instructions#
Testing and controlling loudspeakers can be dangerous when reaching the physical limits or through operating errors. Unsupervised long-term testing under high load, as it is common in endurance testing, poses an increased risk.
Before you start, please read:
The chapter “Safety Instructions” in the KLIPPEL Analyzer Hardware Manual
The health and safety instructions of the 3rd party products you are working with
The instructions below
Note
All KLIPPEL Systems must be operated by skilled personnel only. The operator must be qualified and trained to work with electrical appliances, and must read and understand the User Manuals. If you have any questions, please Contact and Support.
For endurance testing, please consider in particular:
Fire proof environment#
Danger
During measurements loudspeakers heat up and can become very hot. Mechanical failure may increase friction and cause shortcuts.
Test loudspeakers only in a fire proof environment. Employ suitable precautions to prevent and to contain fire, toxic fumes and smoke.
Allow units to cool down after tests to avoid burn injuries.
Disconnect units after failure.
Check Measurement Setup#
Caution
Before starting a test, verify the level and excitation signal, and ensure that the right type of DUT is connected to the amplifier channel.
Use ear protection#
Caution
Protect your ears! Long-term exposure to loud noise, even if painless, can damage your hearing permanently. Extremely loud noises can cause sudden, permanent hearing loss. Keep in mind that sudden changes in level may happen e.g., due to remote control or automated level adjustments.
Components#
KET Channel#
A KET channel connects the KET software to a device under test, such as a speaker. That includes the Dante® network infrastructure and one digital amplifier channel. In the example below one KET channel is highlighted with the dashed red line.
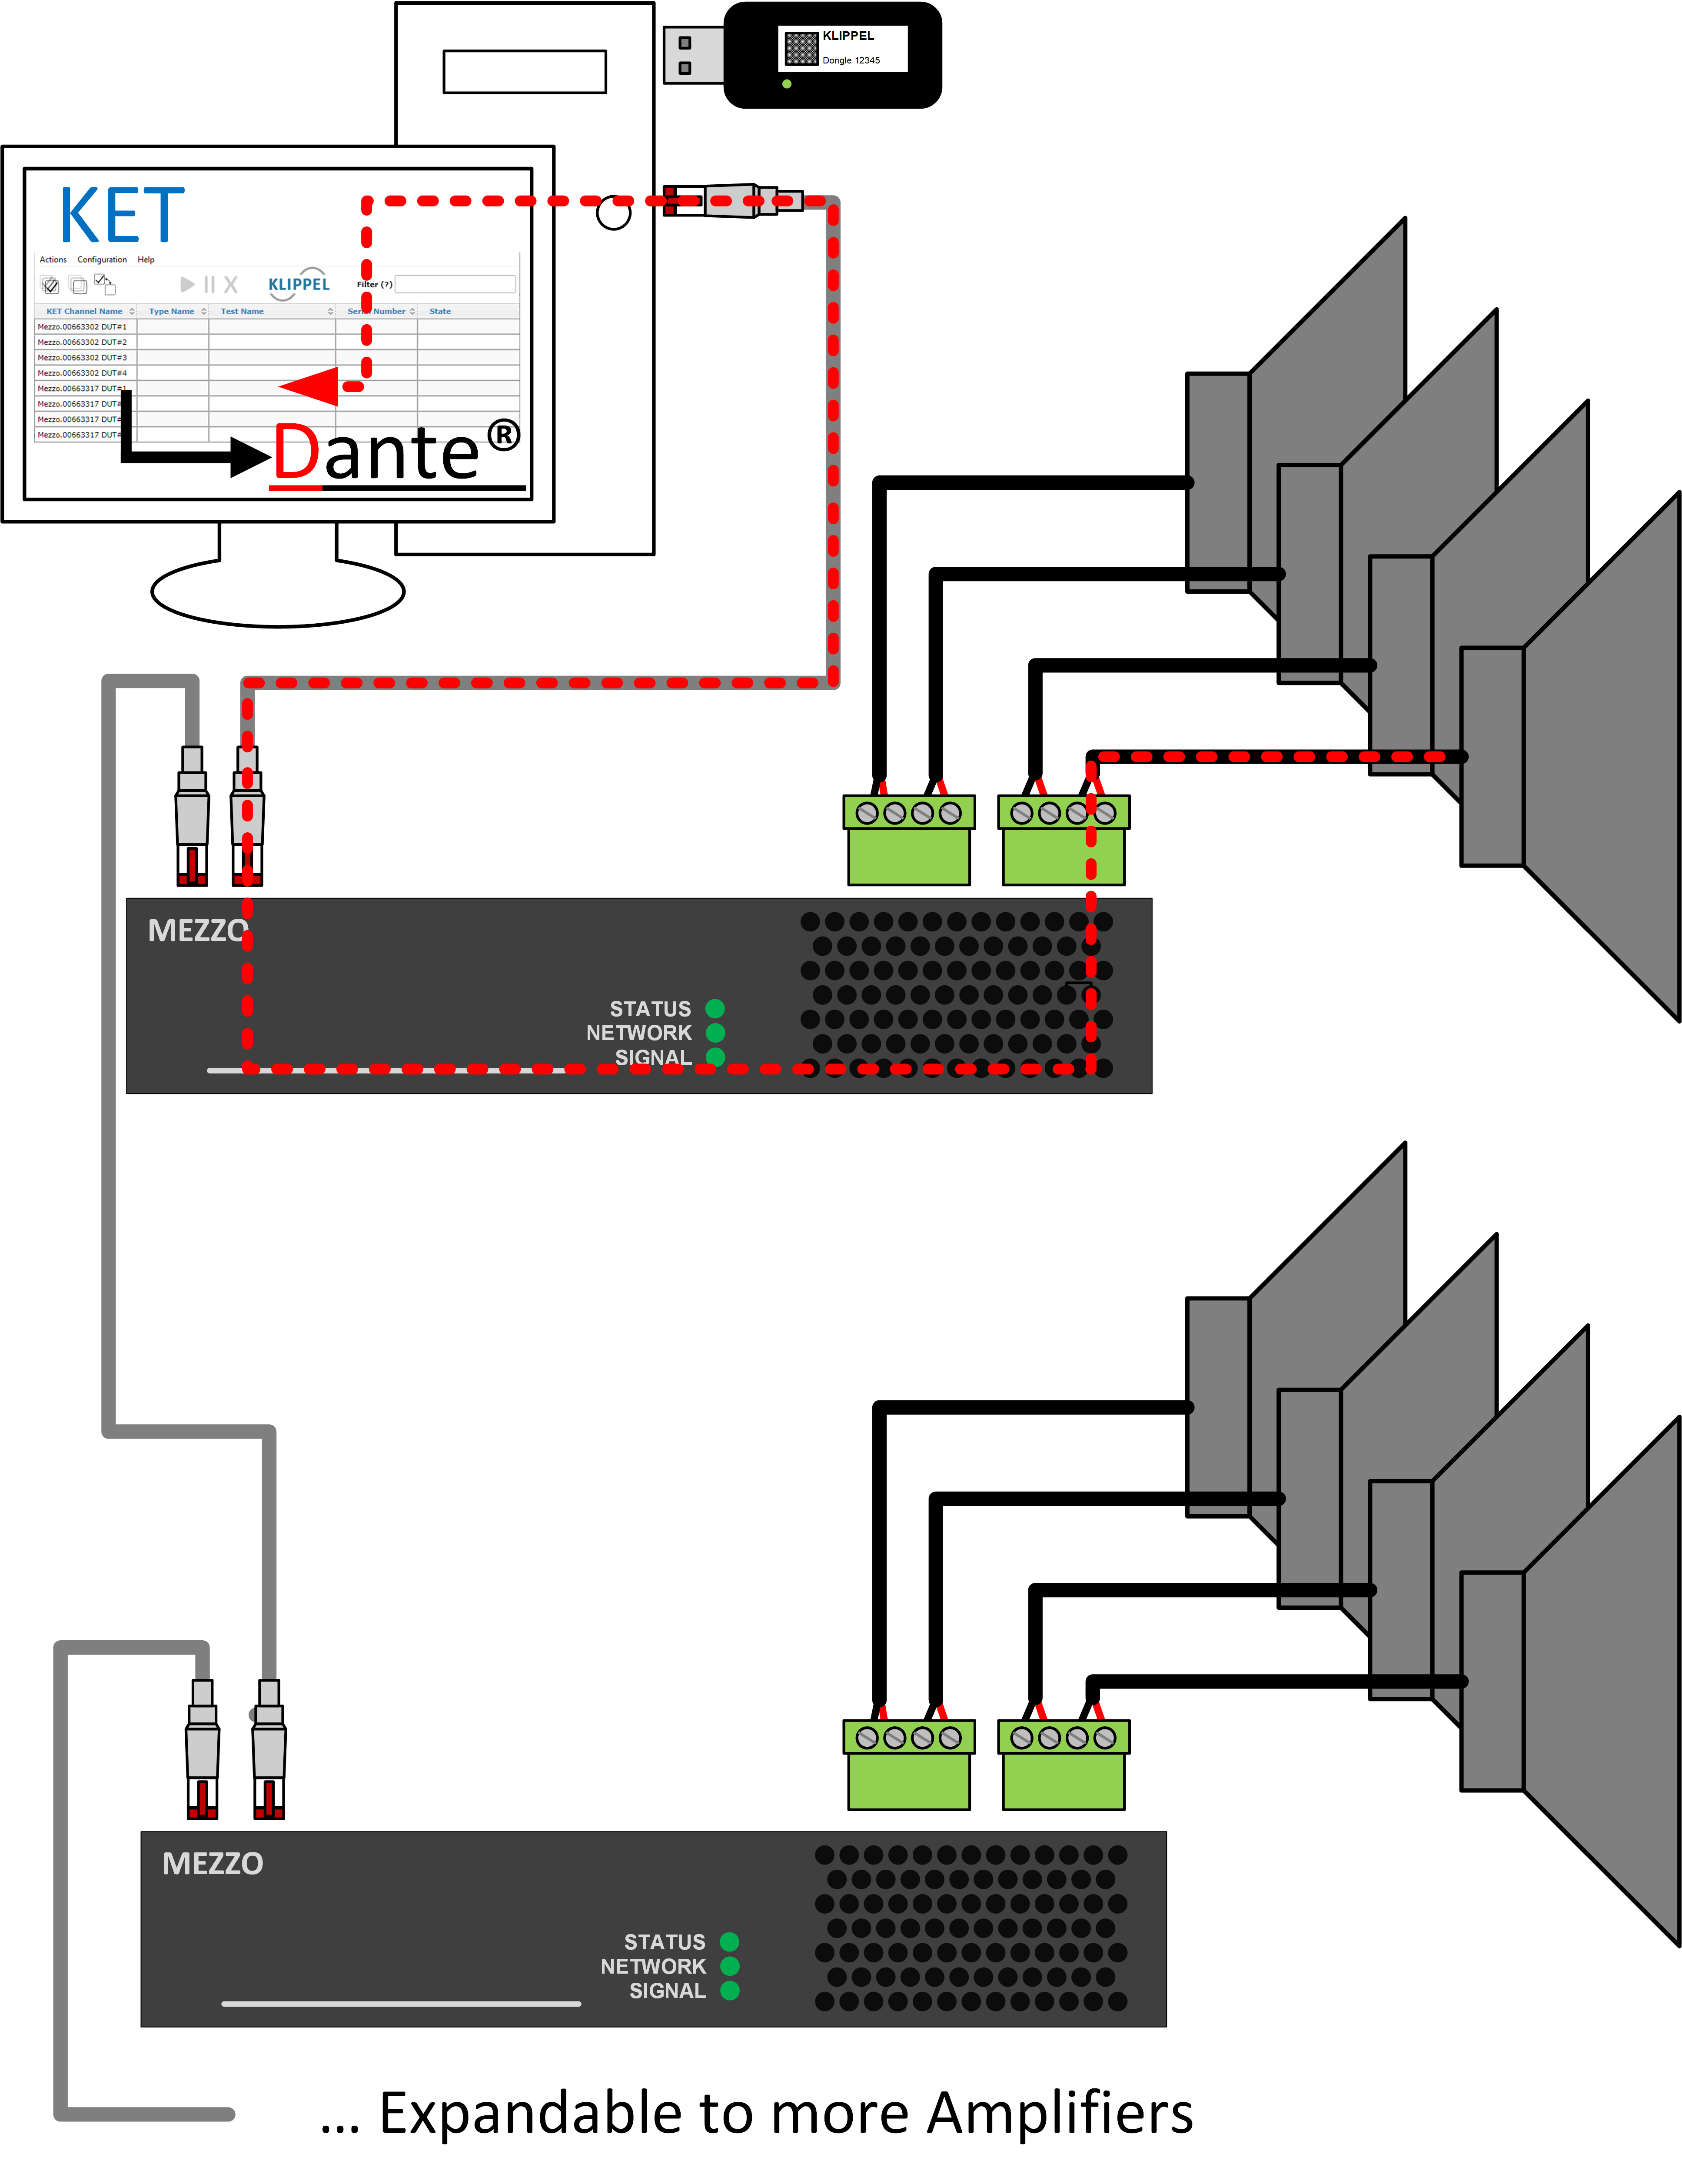
KET currently supports selected Powersoft Mezzo and Powersoft Unica amplifier models. For details, see the KET specification.
KET channels need to be configured via dB-Lab or via KET Dashboard. Configuration consists of setting the Dante® routing and channel calibration. You can also assign a custom name to the channel.
After configuration, the KET channel shows up in the KET Dashboard and can be selected in the KET-SEQ settings.
KET Test#
A single KET Test always runs in a dedicated dB-Lab instance. It is stored in a Klippel Database (.kdbx extension).
A KET Test consists of:
One KET-SEQ sequence control operation: It defines its global settings and shows aggregated results from the measurement phases and External Sensors.
One or more KET-PH measurement phase operations: A KET test can run multiple measurement phases, where each phase has its own signal, monitored signals, limits and other settings.
Zero or more KET-EXC external control operations: KET-EXC is used to control peripheral devices such as climate chambers through custom scripts.
dB-Lab#
All KET measurements (and other Klippel measurements) are run in dB-Lab. If the KET Dashboard is used, measurements can run in headless (not visible) dB-Lab instances.
KET Dashboard#
The KET Dashboard provides an overview of running tests and offers possibilities to create and start multiple tests at once.
Dante®#
Dante® is a network audio protocol developed by Audinate. It is the transport layer for audio streaming from KET PC to the digital amplifiers.
Setup Steps#
Hardware Setup#
For setting up the amplifier hardware, please refer to Technote TN16 - KET - KLIPPEL Endurance Testing HW setup For detailed information and support, please refer to the amplifier manufacturer’s documentation. Usually, this is straightforward.
Software Installation#
The user needs to install:
Klippel dB-Lab RnD
Klippel KET Setup
Klippel software is available from your user page or the Klippel software DVD (if you received one).
Installing Dante Virtual sound card#
The amplifiers are connected through a sound card compatible with the Dante network. The simplest solution is to use Dante Virtual sound card, available from audinate.com.
Purchasing a separate license may be necessary.
Verify that the configuration is appropriate for your use case:
The DVS Settings page is available from the Windows start menu (search for “Dante Virtual sound card”), or from the Hardware configuration dialog’s menu by selecting .
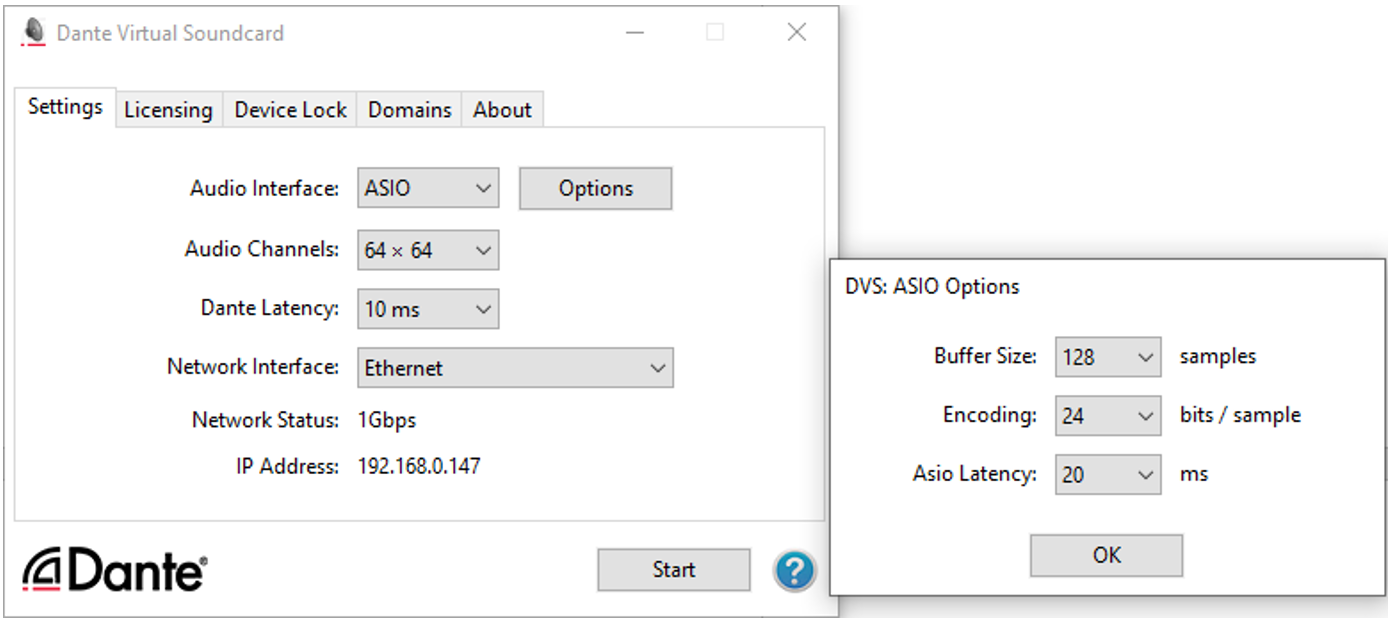
Set the number of Audio Channels to 64x64.
Note
When the virtual sound card is active, all inputs are disabled until you click on the bottom right. After making changes, make sure to re-enable the virtual sound card by clicking !
Since KET measurements prefer robustness over low latency, we strongly recommend adjusting latencies to the highest - value.There are two independent latencies to set: latency of the Dante network and, of the audio interface.
On the DVS Settings page you
Stop the virtual sound card
Set number of audio channels and “Dante latency”
Start the virtual sound card
For the selected audio interface (ASIO usually), click and set the latency (if any) in the sub dialog to the maximum value.
Installing Dante Controller#
Dante Controller is available free of charge from audinate.com.
Install the software normally. After you’ve set up the hardware, follow the instructions in section KET - Hardware Configuration below before starting first tests.
Tutorial: Create a Test from Template#
Before continuing with the tutorial, make sure the test setup is complete.
Open an existing Klippel database or create a new and open it:
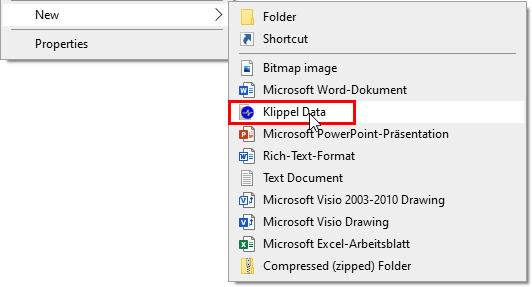

Create a new Object:
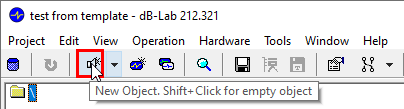
and select the desired KET template from the list:
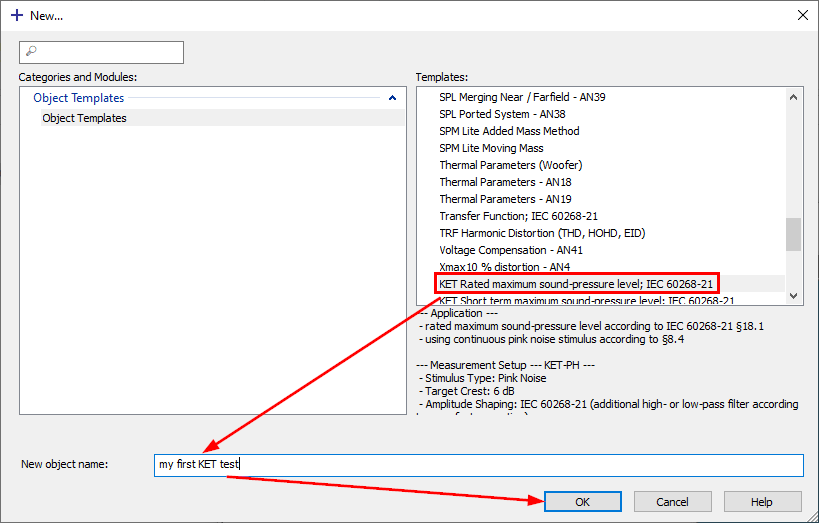
Note
It is also possible to create a predefined user template with your own settings. For further information please see the dB-Lab section Modifying and Organizing Templates.
An object is created that includes KET phase operations (KET-PH) and one KET Sequence Control operation (KET-SEQ).
Open the property page:

and go through the setup of each operation. Modify it according to your needs, e.g.:
- KET-SEQ
The most important setup parameter is the KET Channel which is used for the test.
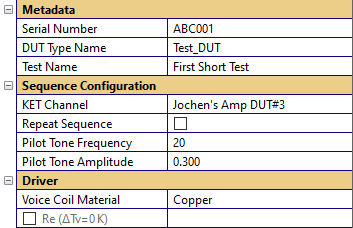
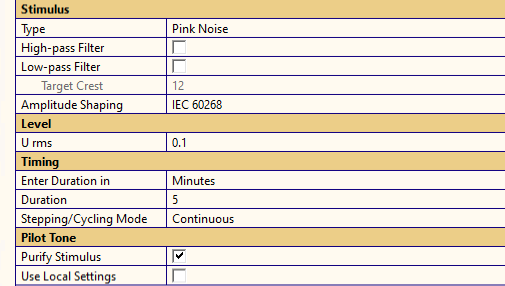
- KET-PH Continuous Pink Noise (100h)
Renamed (with F2) to “KET-PH Continuous Pink Noise (short)”
- KET-PH Recovery Period (24 h)
Deleted
After the configuration is complete, select the KET-SEQ operation and use the green arrow to start the sequence.

If the test does not start, the hardware configuration is incorrect. If everything is configured nicely, the test runs and the charts are updated regularly.
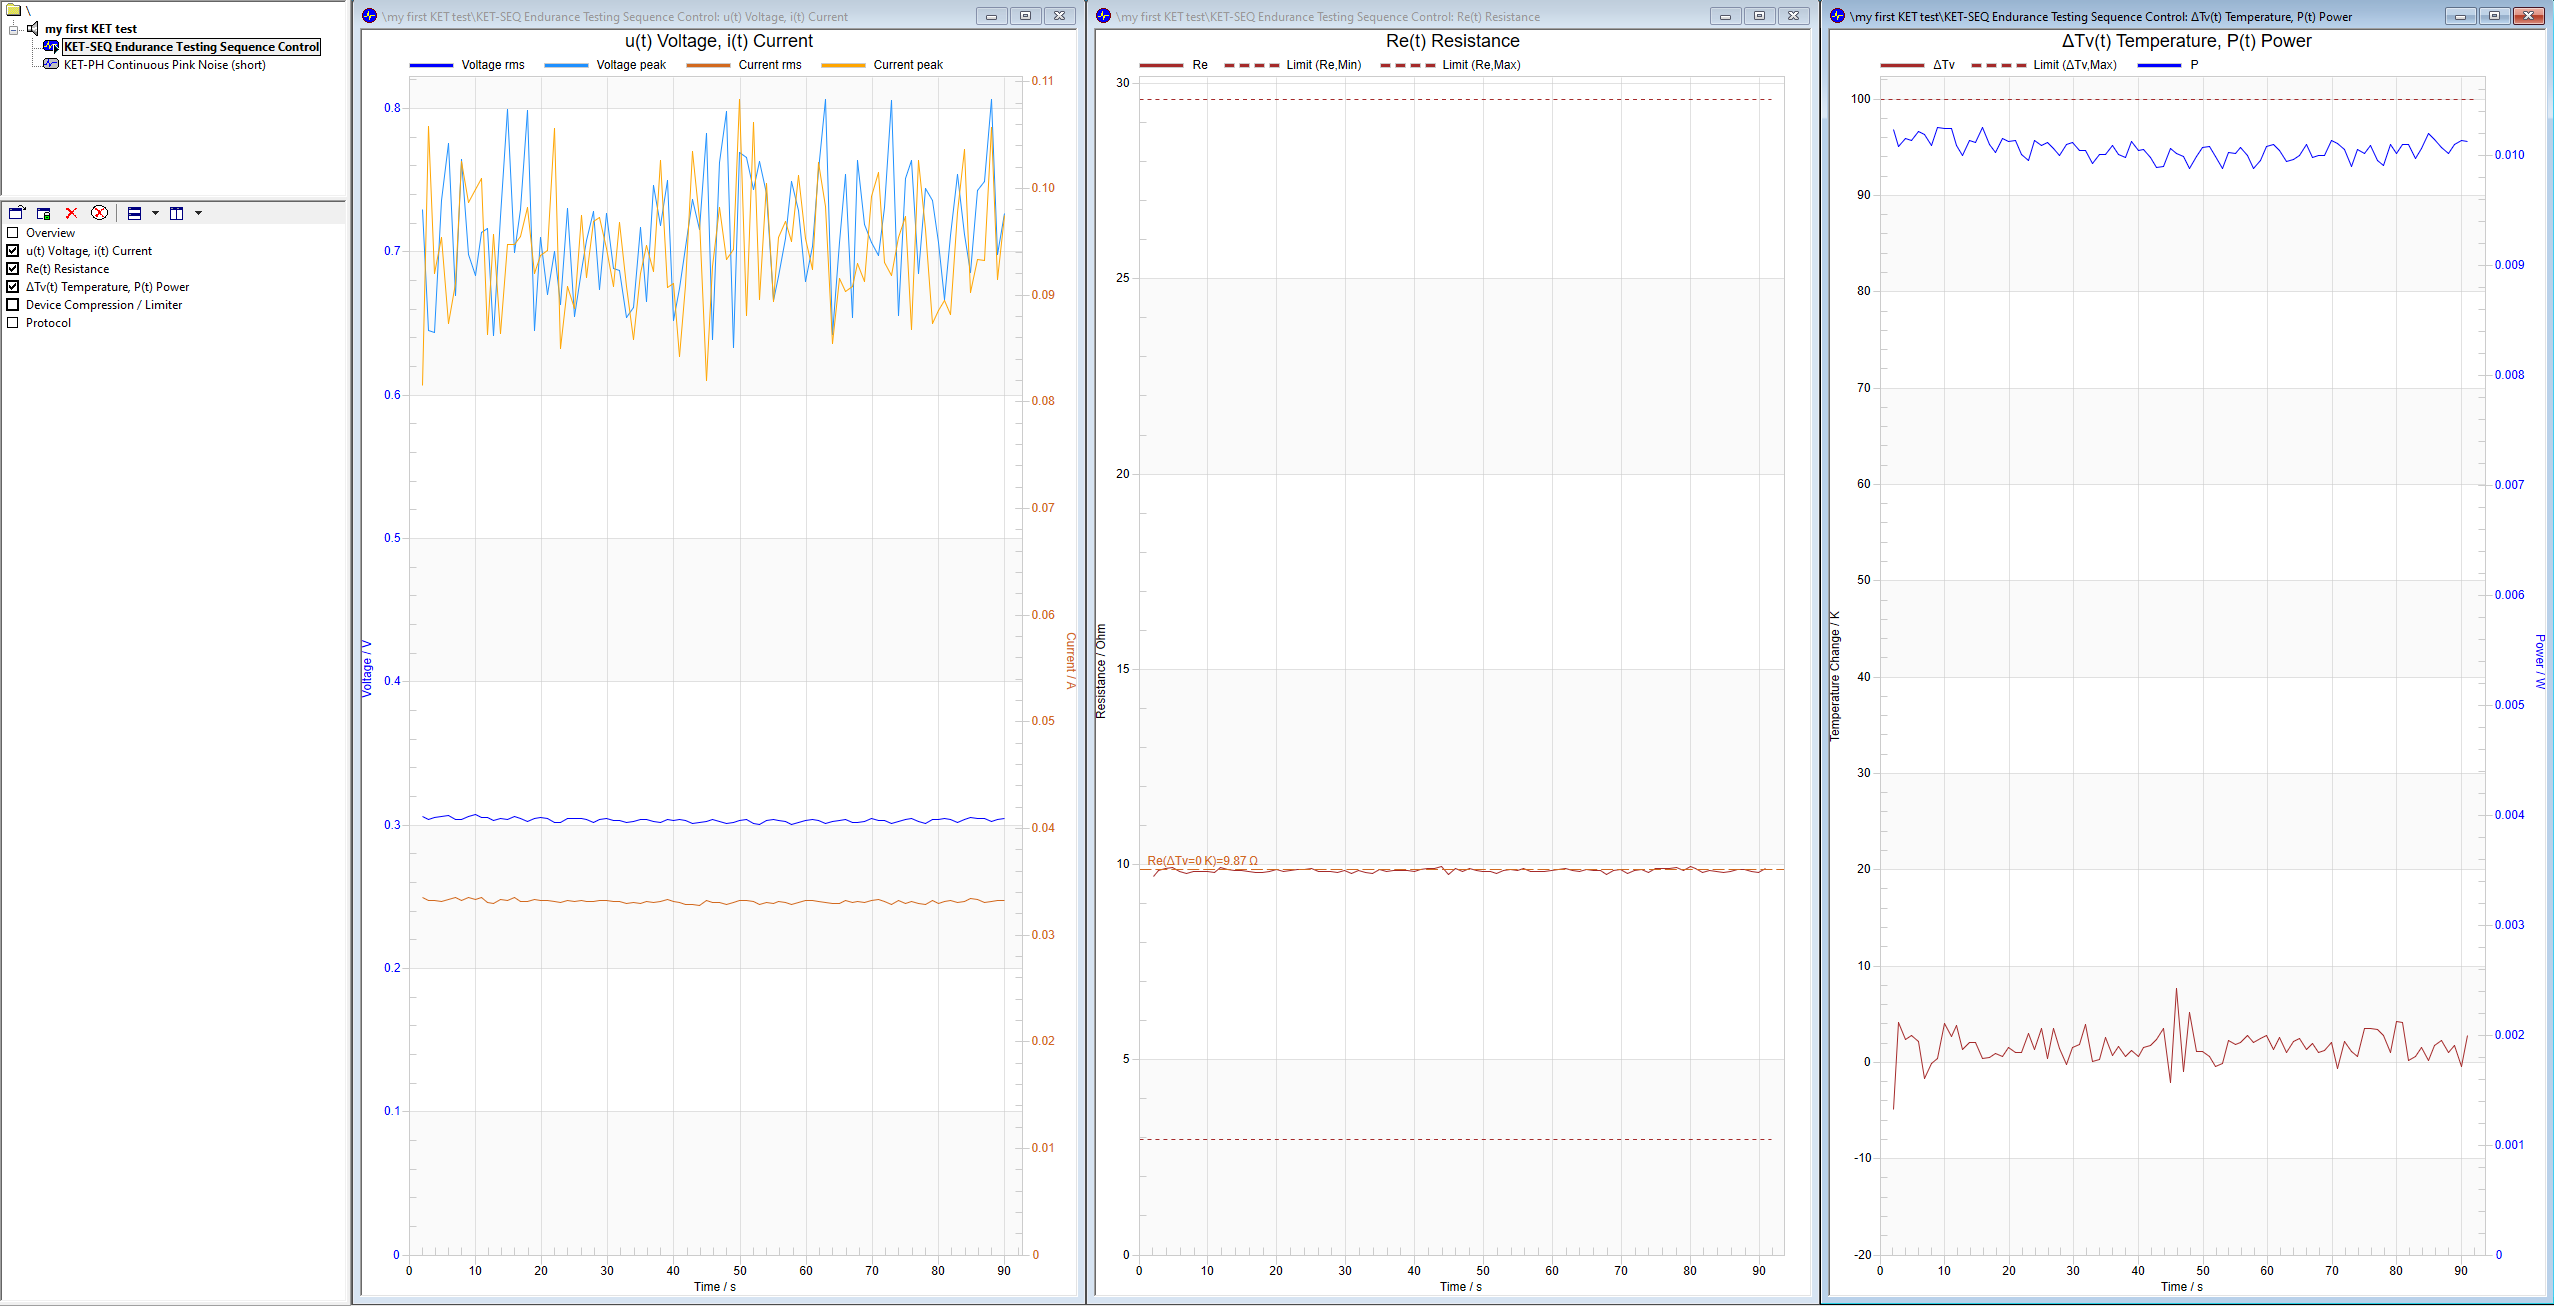
Now the test runs as long as specified or until a limit is violated.
Let’s assume that this test is worth saving for later usage. Select the driver object  and
right-click to open the context menu and use “Save as Template…” or use the icon
and
right-click to open the context menu and use “Save as Template…” or use the icon  in the
toolbar.
in the
toolbar.
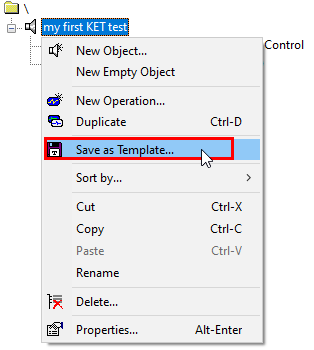
You can change the name and add a comment to the template, before it is stored to the database for user-templates:
%programdata%\Klippel\<dB-Lab Label>\DBTemplates\shared_templates.kdbx
The next step is to start multiple tests at once. Please follow the tutorial in the Dashboard chapter.
KET - Hardware Configuration#
Configuration of Test Hardware#
To review or change the configuration of KET devices:
In the KET Dashboard, select “Configuration / KET Hardware Configuration” from the menu.
In dB-Lab, select “Hardware / KET / KET Hardware Configuration” from the menu.
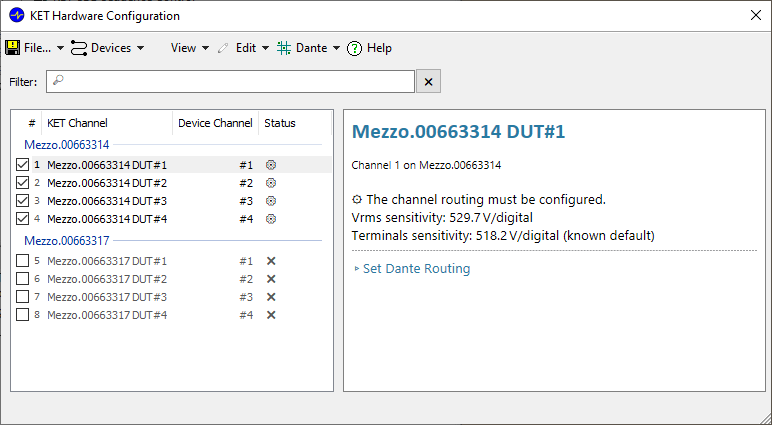
Here you see a list of KET-capable smart amplifiers on your network. You can configure how they appear in the dashboard, and we help you setting the configuration of the Dante Controller.
In a last step of configuration all channels need to be calibrated for accurate measurement.
In the following chapters we guide you thru the configuration process.
Discovering KET Channels#
KET-compatible devices in your local network will be listed here automatically when connected the first time.
There is a row for each KET channel. However, they will show with the setup icon  , like the
first channels in the screenshot above. To make them available for KET Dashboard, select “Dante /
Set Dante Routing” from the menu or use the link in the right pane. More information can be found below.
, like the
first channels in the screenshot above. To make them available for KET Dashboard, select “Dante /
Set Dante Routing” from the menu or use the link in the right pane. More information can be found below.
To enable or disable automatic device detection, toggle the “Devices / Automatically Detect Devices” setting in the menu. If disabled, you can use “Devices / Find Devices” to manually trigger a search.
Automatic device detection relies on network broadcast. If your network doesnt support broadcasts (e.g. deactivated by admin) only devices in the local network are found via limited broadcast.
For some particular network configurations, devices may not be found automatically. In this case, you can add the IPv4 address of the device using “Devices / Add Device”. If a device responds under this IP address, it will be added to the configuration.
KET Channels in the Dashboard#
The KET Dashboard will show all KET Channels that you have configured in this dialog. Channels that haven’t been configured yet, or need to be reconfigured, are not shown.
- Hiding KET Channels
If you do not want some channels to be available to the KET Dashboard on this computer, you can hide them here:
Select the channels in the configuration list (You can use shift+click to select a range)
Select “Edit / Hide Selected Channels” from the menu
The “View / Show Hidden Channels” option makes hidden channels visible in the KET Hardware Configuration. The KET Dashboard will never show hidden channels.
- Renaming Devices and Channels
By default, the name of a channel will be the device name with a “DUT #1” etc. suffix. So, often it is enough to give devices good names.
Select “Edit / Rename Device” from the menu to change the name for the selected device. You can also select multiple devices and rename them one by one.
In case you want custom names for individual channels (e.g., “… Left” or “… Right” instead of “… DUT #1”), use “Edit / Rename Channel”.
Note that this will not change the name on the Dante network, only Klippel KET will be affected.
- Forgetting Devices
The configuration of devices is stored even if they are not connected. To completely remove all information for devices that are not currently connected, select “Edit / Forget Devices…” from the menu.
Setting the Dante Routing#
To configure a smart amplifier, the streaming channels need to be assigned correctly in the Dante Controller.
Note that the settings you make can’t be neither controlled nor verified. Instead, copy the routing configuration to Dante Controller.
Select “Dante / Set Dante Routing” from the menu.
The currently selected streaming device is displayed on top. On some systems, more than one sound card may be available. Click to choose the streaming device you use for KET. Changes to this setting are applied when you confirm the routing assignment by clicking .
If there are unconfigured channels, a first page will show an overview of missing configurations. The Dante Routing can only be set for devices currently powered and connected, so make sure they are. This page is followed by a page that allows to arrange the Dante Controller and the “Set Dante Routing” window side-by-side:
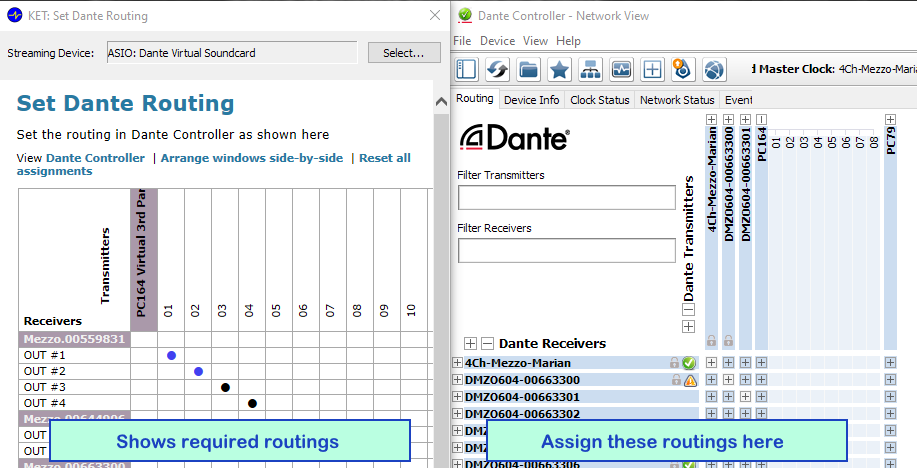
The Set Dante Routing window (left) will show the required routings that need to be assigned in the Dante Controller (right):
A blue marker indicates a new routing. Set a routing for this connection in the Dante Controller.
A black marker indicates an existing routing. Please verify it is still set in Dante Controller.
If you have assigned and verified all routings in Dante Controller (right) as suggested (left),
Check the confirmation checkbox at the bottom.
Click “Save”
See here an example of a matched configuration:
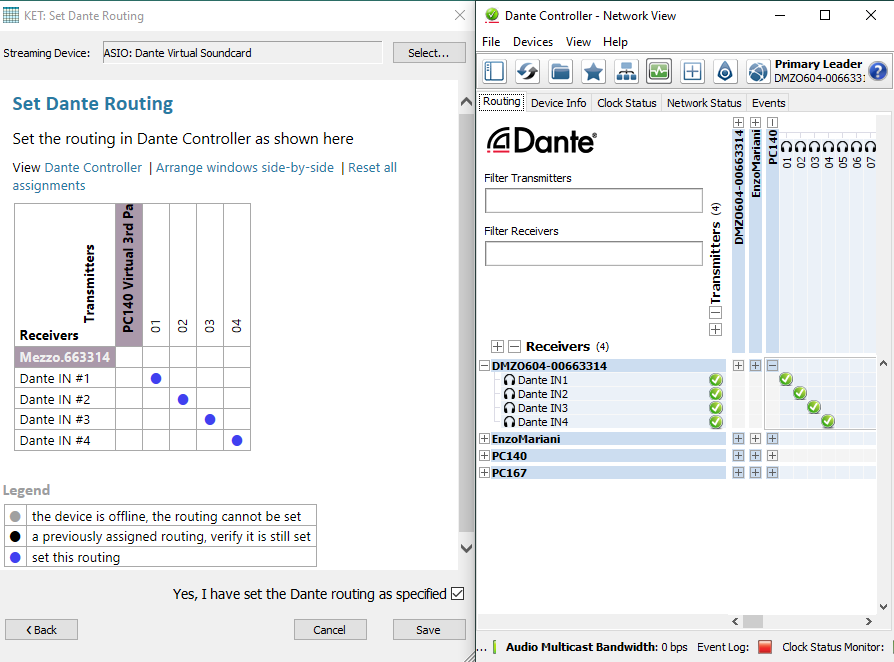
KET will rely on these routings being set in Dante Controller when playing audio.
The view on the left will show only the relevant devices; in Dante Controller you may have to expand the respective devices (rows) and the computer name (column).
The view on the left can only show the name you gave the device. A mouseover tooltip shows the original name as reported by the device.
Note
In Dante Controller, you can lock devices with a PIN. This prevents others from making (accidental) changes to the Dante routing.
To do so, start “Dante Controller”, select “Devices / Device View” from the application menu, select the device you want to protect in the toolbar, then click the “Lock” button.
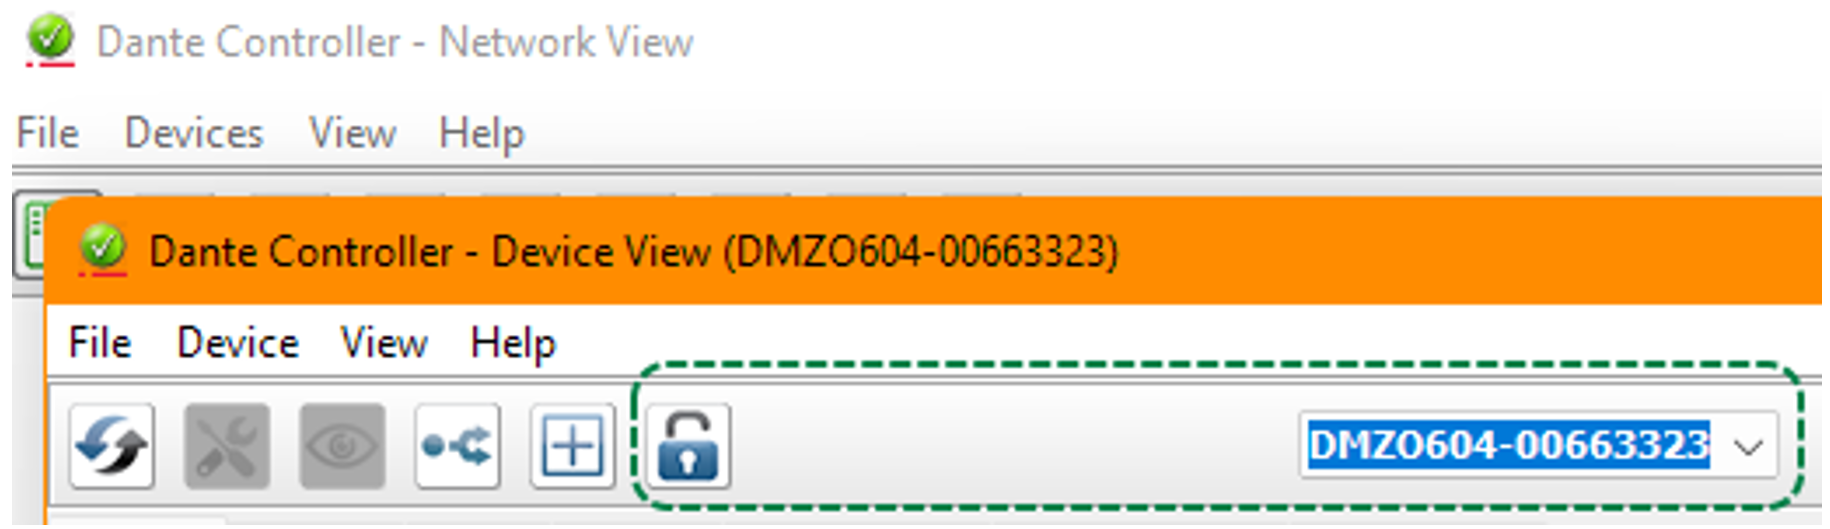
Note: Renamed devices in Dante Controller are not available to Klippel KET setup. Do either not rename devices in Dante Controller, or give them the same names in both Dante Controller and KET Hardware Config.
Configuring Dante Virtual sound card#
Note
When the virtual sound card is active, all inputs are disabled until you click [Stop] on the bottom right. After making changes, make sure to re-enable the virtual sound card by clicking [Start]!
Since KET measurements prefer robustness over low latency, set latencies to the highest - value.
Typically, there are two independent latencies to set: of the Dante network and the audio interface.
In KET Hardware Configuration, select “Dante / Start Dante Virtual sound card”
On the Settings page you need to
Stop the virtual sound card
Set number of audio channels and “Dante latency”
Start the virtual sound card
For the selected audio interface (ASIO usually), click “Options” and set the latency, if any, in the sub dialog
Calibration of the Test Hardware#
The KET hardware devices can be calibrated (adjusted is more correct according to metrology) in two domains. Calibration in the digital domain is mandatory to perform KET tests. Optionally voltage, current and gain can be calibrated in analog domain using external reference measurements.
The result of those calibration steps are sensor files per device and per channel that correct for minor deviation of the particular hardware from the manufacturer default values built into the supported KET devices.
Calibration in digital domain#
The voltage measurement needs to be calibrated using an automatic procedure without external measurements. For this reason a digital input signal is sent to each channel individually and the internally measured voltage \(V_{RMS}\) is used to calibrate the transfer characteristics from the digital input to the unloaded amplifier output seen by the internal voltage sensor. For accuracy reasons a relatively high level of about 10V is applied. Therefore make sure that no load or DUT is connected to the amplifier output at this time. For the calibration process the software needs exclusive access to the amplifier channels. Thus, the amplifier with all channels will be locked to make sure that no other source or software interferes with the process.
After successful Dante routing, select the first channel.
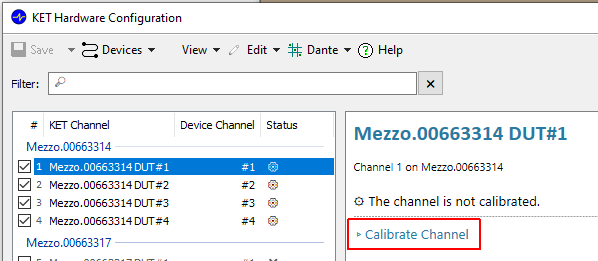
On the right pane click on the link Calibrate Channel and follow the instructions. The calibration process takes about 5 seconds per channel. After the short measurement Save Calibration results. Allow the checkbox Continue with next uncalibrated channel and proceed until all channels are calibrated.
Any channel which is successfully calibrated is marked with the icon  .
.
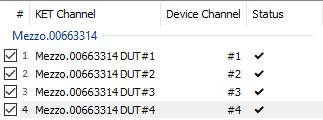
Make sure all desired channels are configured properly.
Note
The signal to noise ratio (SNR) of the calibration process is typically better than \(60 .. 70\text{ dB}\). If the SNR is considerably lower, this indicates connection problems, most likely by a network overload and hence unstable streaming.
Calibration in analog domain#
In addition to the mandatory calibration in digital domain the gain, current and voltage can be calibrated also using reference measurements by 3rd party equipment. Those measurements can be done by certified calibration labs (provides traceable calibration to national standards) or at customer site. Special instructions and software tools are provided by Klippel. Please contact the Klippel support team for details.
KET - Dashboard#
Overview#
The KET Dashboard is used to control and monitor multiple Klippel KET tests. All test run in their dedicated dB-Lab instance with which the KET Dashboard communicates.
When creating tests, the KET Dashboard uses object templates from the templated databases (Klippel and user templates) for the KET dB-Lab instance. That means that a customized KET test becomes available for new tests in the KET Dashboard once it is stored as a template (from within dB-Lab).
When the KET Dashboard detects dB-Labs with running KET tests, they are automatically shown in the KET Dashboard (if the channel is not used by a test that is currently not running).
The KET Dashboard comprises a server/backend (handling, control and monitoring of all dB-Labs) and a client/frontend (user interface). The server can only access dB-Labs that run on the same machine. The client can connect to the server running on the same machine (localhost) or to available remote servers. If the required dB-Lab is not found, the KET Dashboard can be run in pure client mode.
Tutorial#
This tutorial assumes a complete KET -Setup:
dB-Lab setup installation + KET setup installation
KET-Hardware, IP configuration, Dante configuration and routing
Furthermore, it is assumed that a customized test was saved as a template.
In this tutorial we go through the process of creating multiple instances of a test for testing multiple test objects of the same type. Cresting different tests would require the repetition of selected steps.
First execution of the Dashboard#
When the Dashboard is started for the first time, the user has to define a working directory for the Dashboard.
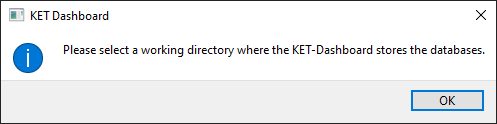
Hit OK and select a local folder where the Dashboard can create and delete databases.
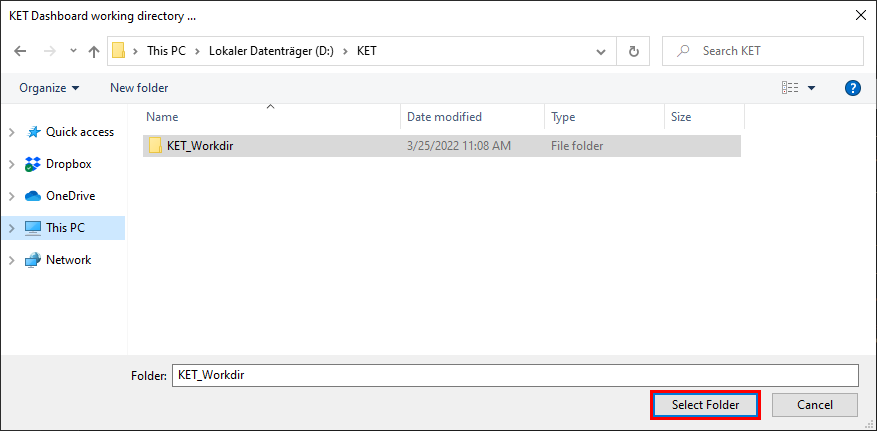
After confirming the dialog, the Dashboard opens and all available KET channels are listed in the table.
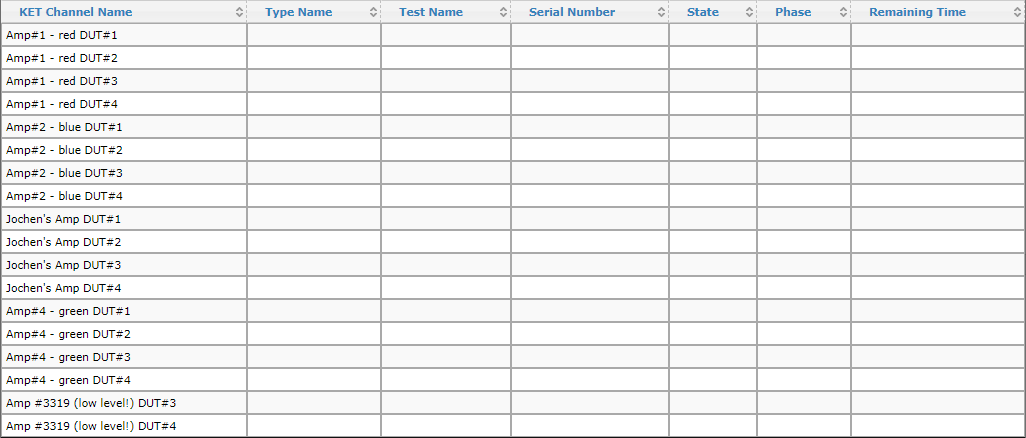
Create tests#
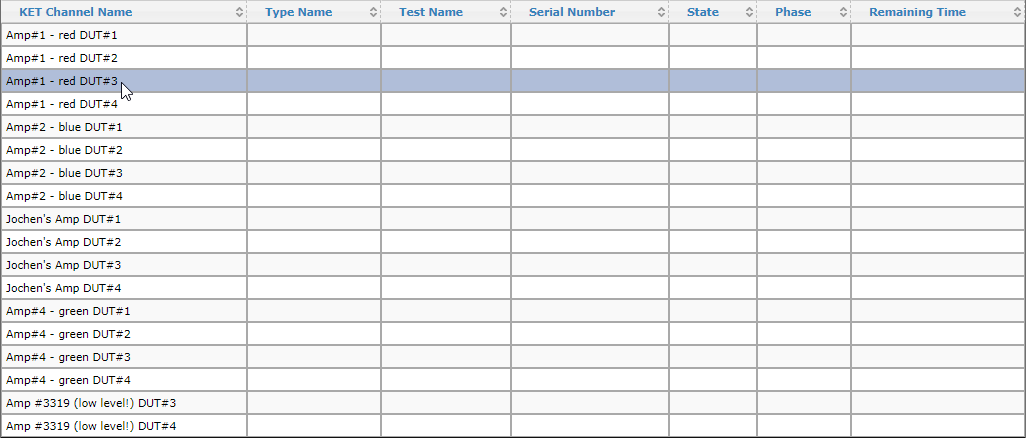
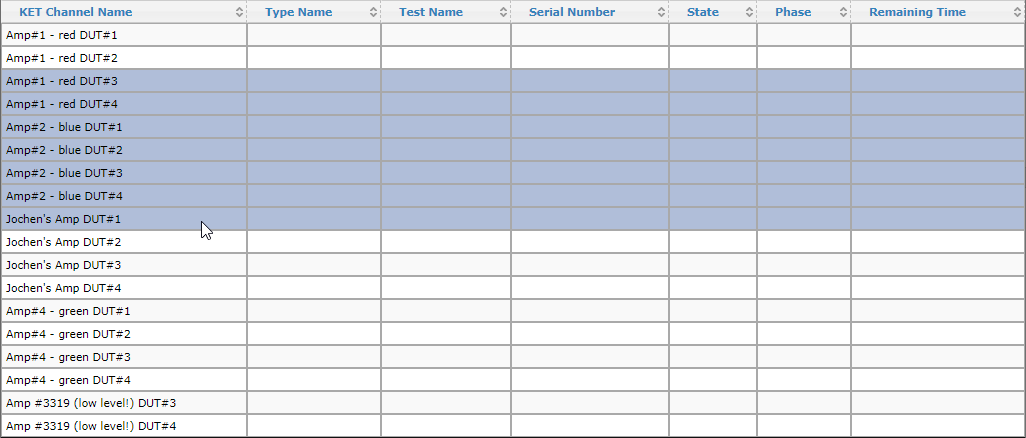
Select the KET channels that you want to create tests for. You can use the CTRL and SHIFT keys
along with left mouse button ( ) clicks.
Select the first channel with a
click.
Hold down the SHIFT key and use a
click on the last channel of the range you want to select.
If required, use the CTRL key along with
clicks to add/remove more channels to/from the
selection.
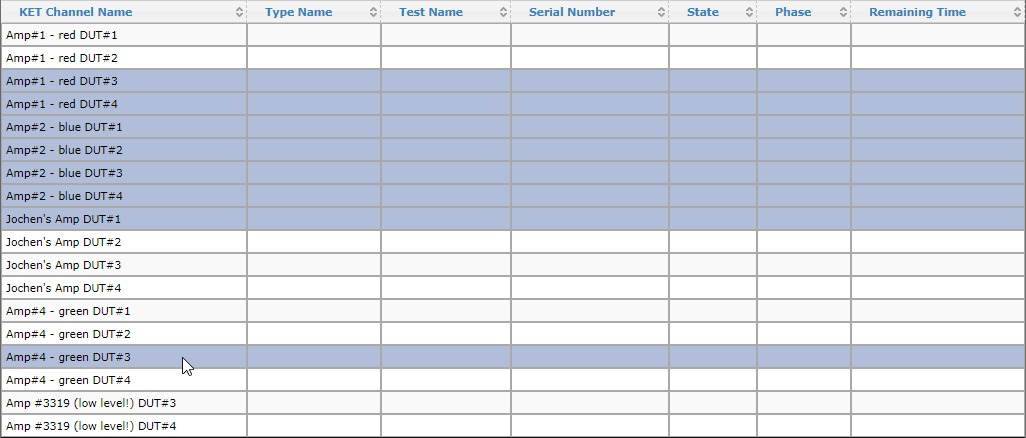
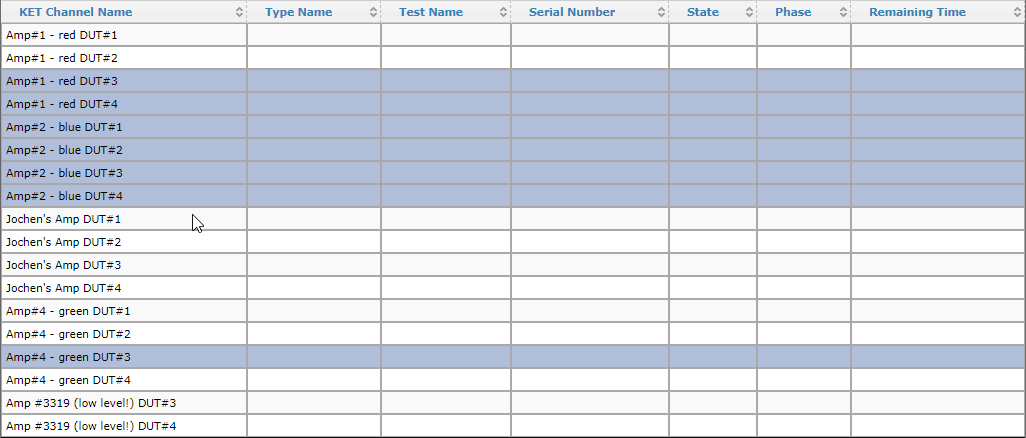
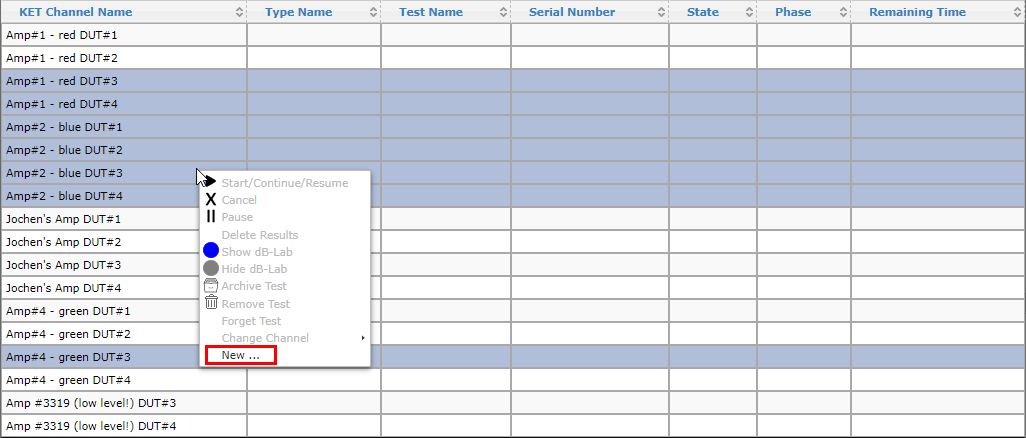
Use  click on a selected channel to open the context menu and select New …
Enter the sensible values for Type Name, Test Name and the first Serial Number. It is recommended to fill out all fields. Those values are used to Archive Tests.
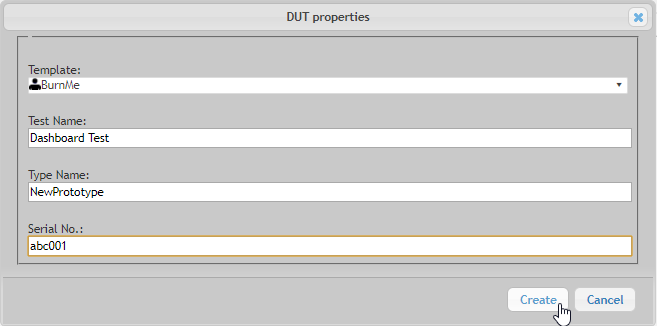
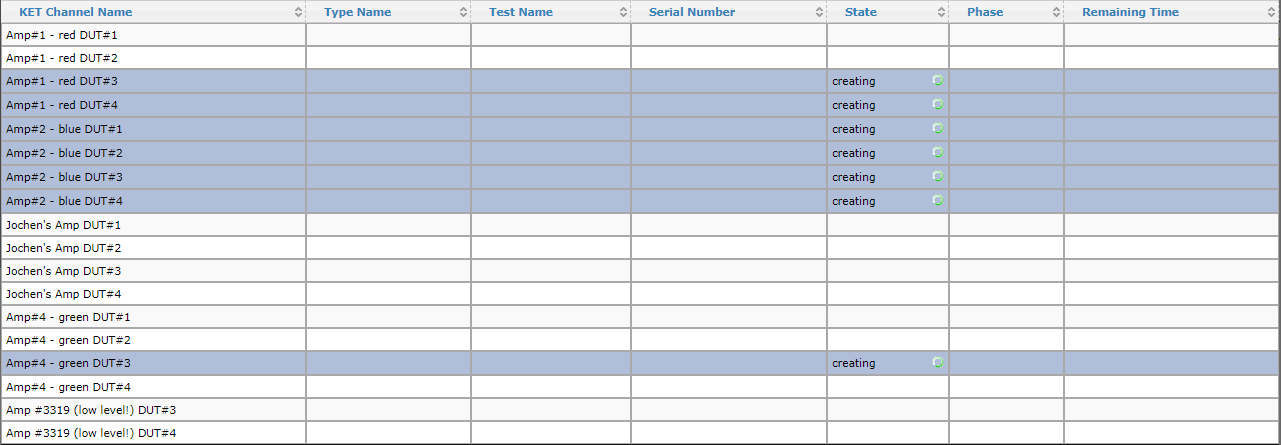
After using the Create button, the tests are created on the selected channels.
Verify the Setup#
To check the settings, you can open dB-Lab and check the settings of the KET-SEQ and KET-PH. They are the same settings as stored in the template except for maybe:
KET Channel
Type Name
Test Name
Serial Number
To open dB-Lab for one test use a
click on a channel (without CTRL key). Then only this
channel is selected. Use
to open the context menu and select Show dB-Lab.
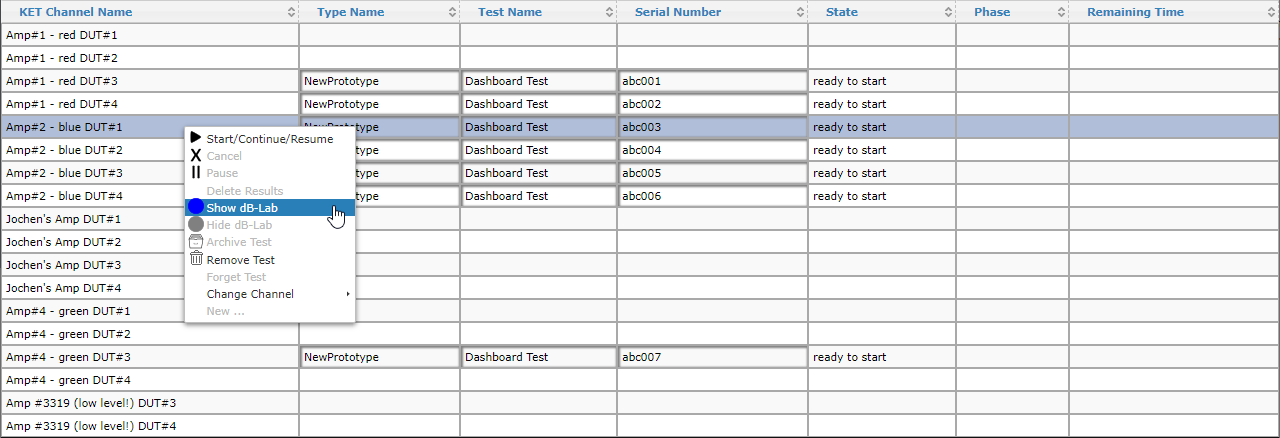
After the check is complete, close dB-Lab via the title bar or hide it via the context menu.
Start tests#
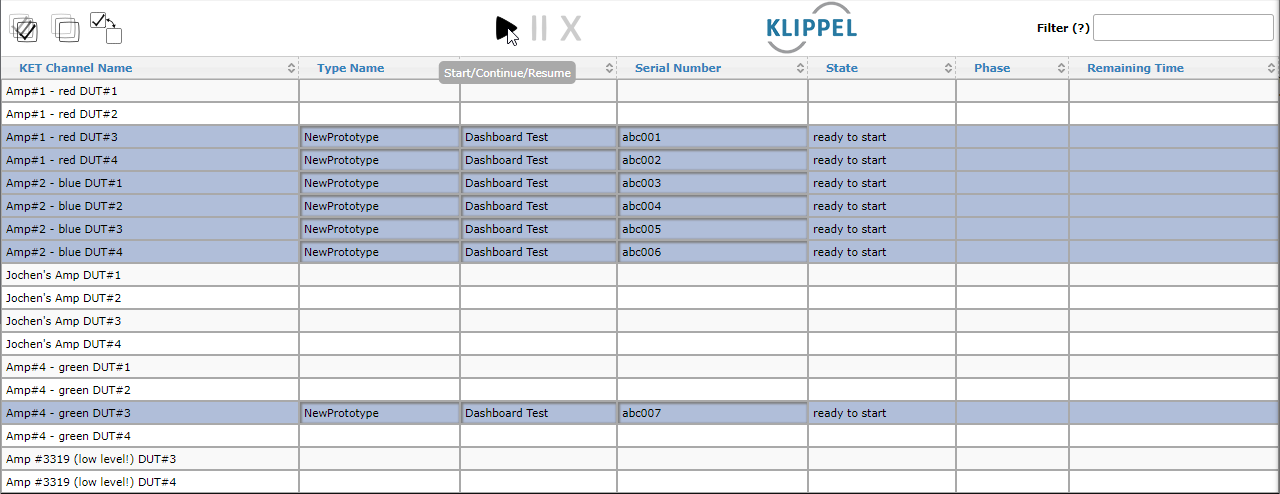
Select all channels that should be started (as done for creating the tests) and start those tests via the context menu or the toolbar.
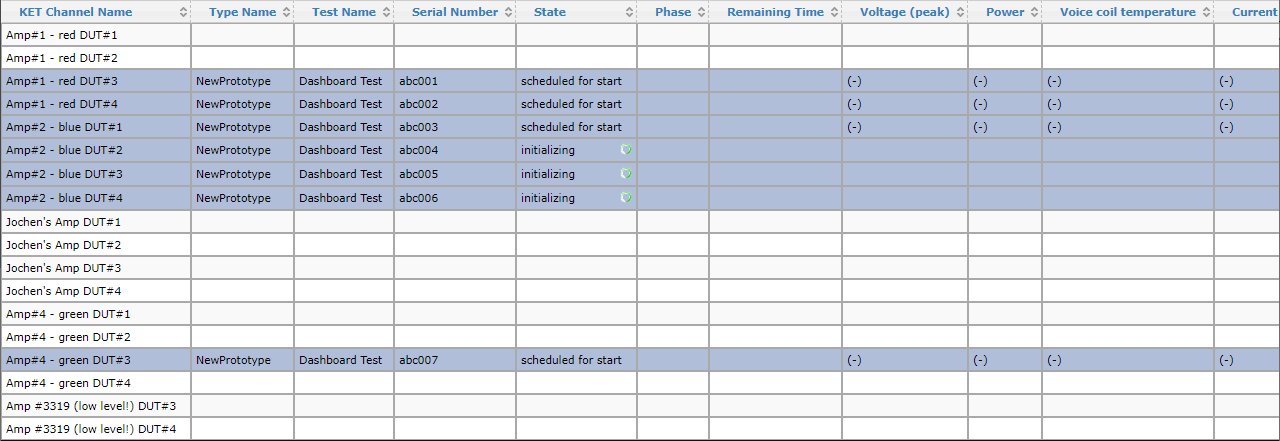
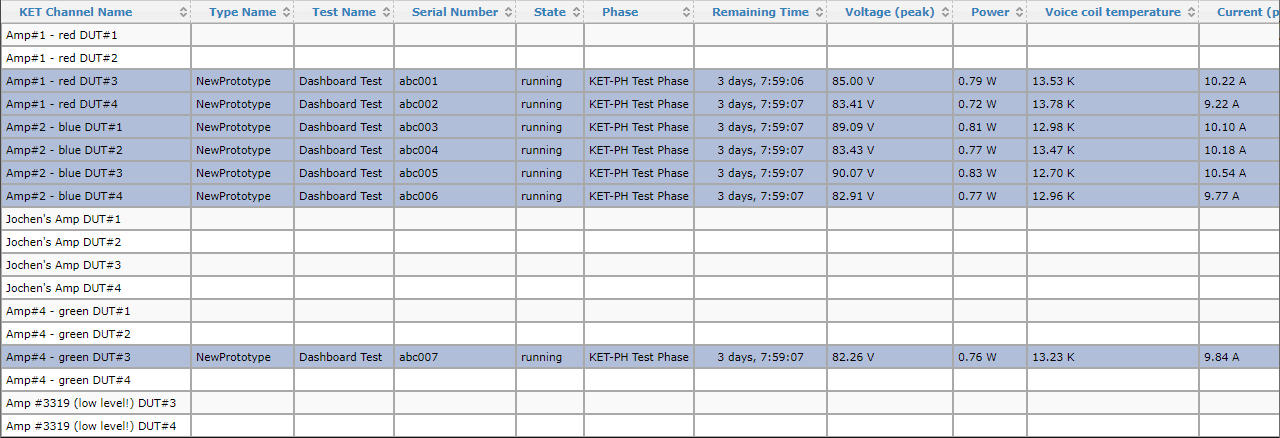
After the initialization, new result columns are displayed. All tests are initialized first before they are started simultaneously.
View Results#
All results that are provided by the KET test are displayed in the Dashboard table. Those columns can be used to sort the table (e.g. increasing by power, or decreasing by remaining time).
Running tests may be viewed in dB-Lab by showing / hiding the corresponding dB-Lab as done in Verify the Setup.
Tidy up#
Finished tests that were created in the Dashboard are still displayed and can be accessed. They block a KET channel in the Dashboard. When removing the test, the database is also deleted. To keep the results, it is recommended to Archive Tests.
Reference#
Component Overview#
Usually, there is one KET-PC that has access to the KET channel hardware (e.g. via Dante Virtual sound card). The KET channels need to be configured correctly on that computer. All dB-Lab (one for each running KET channel) run on that computer. Additionally, one Dashboard instance is started on that computer.
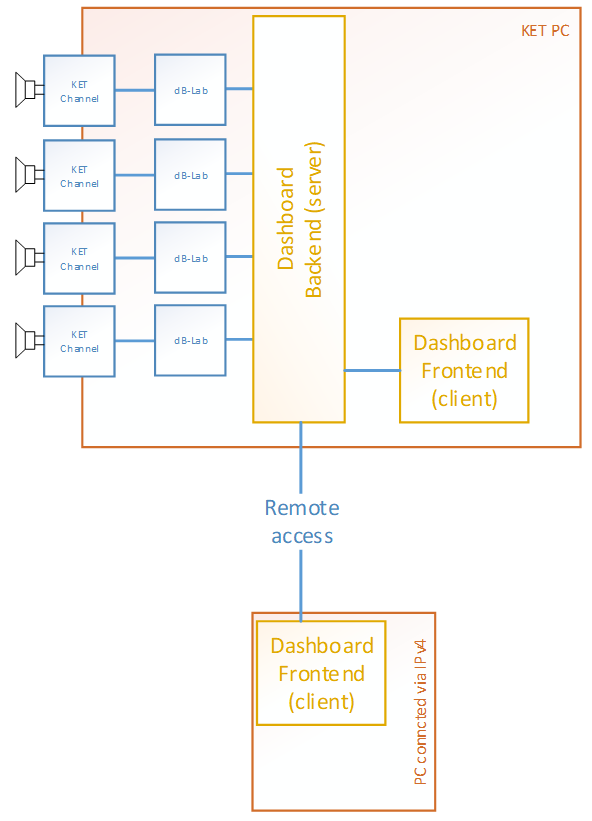
The Dashboard consists of a backend and a frontend. The Dashboard backend running on the KET-PC is the Dashboard server. The Dashboard client that runs on the KET-PC is a local client.
If remote access is allowed (Allow Remote Access), other PCs can run Dashboard clients that connect to the KET-PC’s Dashboard server for remote monitoring and control of the KET tests.
Application GUI#
The application GUI consists of a window that displays the Dashboard Table (HTML) of the connected server.
Dashboard Table and Toolbar#
The body of the Dashboard includes the Dashboard table and a toolbar with some general functionality. Both are available if the Dashboard server is accessed via a web browser.
The toolbar includes selection tools to select all channels, none channels and to invert the selection.

The run control button can be used to start/resume, pause or stop selected tests.

The filter may be used to filter the channels by any text to quickly find desired KET channel(s).

The Dashboard table lists all KET channels that are defined in the KET Hardware Configuration as individual rows. The columns can be used to sort the table by one column forward and backwards alphabetically. The columns consist of static columns and dynamic columns.
Static columns#
KET Channel Name#
This is the KET channel name as defined in the KET Hardware Configuration.
Type Name#
The Type Name is a property of KET object. It is initialized for all created tests at a time with the value entered in the creation dialog. The initial value defined in the object template. This property may be changed if the test is idle (e.g. not yet started or finished).
Test Name#
The Test Name is a property of KET object. It is initialized for all created tests at a time with the value entered in the creation dialog. The initial value is defined in the object template. This property may be changed if the test is idle (e.g. not yet started or finished).
Serial Number#
The Test Name is a property of KET object. The initial serial number is incremented automatically for all tests created at a time. The initial value can be changed in the creation dialog. The incremented serial number is kept as long as the KET Dashboard runs. The initial value is defined in the object template. This property may be changed if the test is idle (e.g. not yet started or finished).
State#
This column shows the current state of a test. The state defined which controls are available for a test (context menu).
If multiple channels are selected for an action (e.g. creating or starting a test), all channels are scheduled for that action. Some channels are processed parallel in working spots, the others wait in the processing queue for a free working spot. The number of available parallel working spots depends on the number of CPUs of the computer that is running the Dashboard backend. Each action is processed for all channels before the text action is started.
- <empty>
Only KET channels without tests can have an empty state.
- Scheduled for creation
The creation of a test for that KET channel is waiting in the processing queue. Once an open working spot is available, the state changes to “creating”.
- Creating
The test is currently being created from a template. Once created, the state changes to “ready to start”.
- Ready to start
The test may be started. Once started, the next state is “scheduled for initialization”.
- Pausing
A pause request be being sent to the test.
- Paused
The test is paused.
- Scheduled for initialization
The initialization of the test is waiting for an open working spot in the queue.
- Initializing
The initialization of the test is currently in progress.
- Initialization failed
The initialization of this test failed. Next possible steps are to remove the test or to re-try the initialization (by another start) when the impediments have been removed.
- Initialized
The initialization of the test is finished. The next state is “scheduled for start”.
- Scheduled for start
The test has been initialized and is waiting for start. All tests that have been started at the same time go through their initialization and wait until all selected tests are scheduled for start. Then all tests change to the “running” state at approximately the same time.
- Running
The test is currently running.
- Scheduled for archiving
The archiving of the test is waiting for an open working spot in the queue.
- Archiving
The archiving is in progress. If the process is successful, the test is removed from the KET Dashboard.
- Archiving failed
The archiving has failed. The test is not removed from the KET Dashboard
- Finished
The test has been running for the test time and is now finished without limit violation or errors.
- Stopping
A stopping request has been sent to the test.
- Failed
The test has been running but stopped because it failed (e.g. user cancellation or limit violation)
- Error
The test has errors and is not running.
- Crashed
The test has ended abnormally.
- Database gone
The database of the test cannot be found.
- Test in database gone
The database of the test is existing, but the path of the test inside the database cannot be found
- Auto-resume in X s
The test will be restarted in X seconds.
- Auto-resume aborted
The used aborted the recovery
- Scheduled for removing
The removing of the test is waiting for an open working spot in the queue.
- Removing
The test is currently being removed
- Scheduled for forgetting
The forgetting of the test is waiting for an open working spot in the queue.
- Forgetting
The test is currently being forgotten.
- Scheduled for deletion of results
The deletion of test results of the test is waiting for an open working spot in the queue.
- Deleting results
The test results of that test are being deleted.
Phase#
This column displays the current phase of the KET test. To change the phase notation, change the name of the KET-PH operation in the KET test template.
Remaining Time#
This column displays the remaining time of a test. If a test is running or paused, the table cell is also filled with a progress bar to display the relative progress.
Dynamic Columns#
The dynamic columns are filled with the results provided by the KET test.
Work with Tests#
Selection of channels#
KET Channels (table rows) are selected by left mouse button clicks (
-click).
When the key SHIFT is pressed, a range of channels can be selected. Using CTRL adds/removes channels
to/from the selection with every
-click.
A right mouse button click (
) on an unselected channel selects only the single channel. Any
selection is discarded in that case.
The toolbar offers selection tools for selecting everything, selecting nothing and inverting the selection.
Control Test Channels#
The tests are organized by KET channel. When one or more channels are selected, the controls in the toolbar become available, depending on the state(s) of the selected channel(s).
In addition to the context-menu, the toolbar also holds the controls:
Start/Continue/Resume
Cancel
Pause
Create tests#
In the KET Dashboard tests can only be created from test templates. Either Klippel templates or User templates. Existing test sequences need to be saved as a templated in order to make the sequence available for the Dashboard.
To create a test, select one or more channels and use the
to open the context menu.
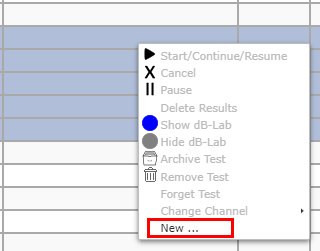
A dialog opens when “New …” is selected.
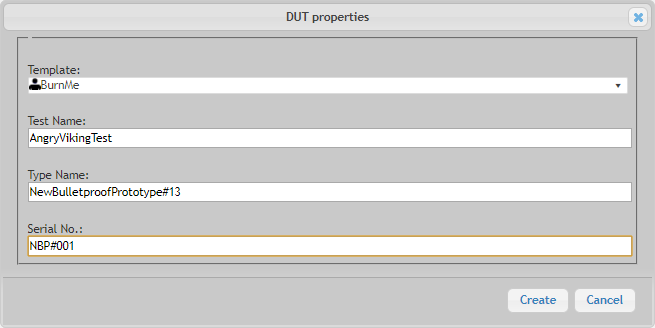
The initial values come are defined in the template database. The serial number is incremented automatically, the increment is not stored when the Dashboard is exited.
The properties Test Name, Type Name and Serial Number can be changed later when the test is not running. They are used for organizing to Archive Tests.
Run-Control of tests#
Start/Continue/Resume#
Those three actions are combined since they all usually result in a running state.
A test that has never run before is started. This test does not have results yet.
A test that was running before but is paused now is continued.
A test that was running before but is stopped now is resumed. Existing data is appended. If the tests should start from the beginning, the test has to be reset via Delete Results.
Pause#
A running test can be paused. The KET channel is still blocked when the test is in pause mode.
Cancel#
A canceled test stops and releases the KET channel.
Delete Results#
If a test has been running it contains results. If the control Start/Continue/Resume is used, the existing data is kept and new data is added. If the test should be started from the beginning the results can be deleted with this control.
Show/Hide dB-Lab#
If the tests are created (and started) via the Dashboard, the dB-Lab instance is hidden. At any time the test can be viewed in dB-Lab by showing this instance. If no dB-Lab is currently running for this test a new instance is created.
Showing dB-Lab is always possible even if the instance is already shown. The selected dB-Lab instance is foregrounded.
Archive Tests#
All tests can be archived to a dedicated archive folder. If the test was created by the Dashboard (in the working directory) the test can be archived from the Dashboard context-menu. Tests that have been created outside the Dashboard, can be archived from within dB-Lab. Archiving a test from the Dashboard context-menu will delete the test database in the working directory.
Archive Organisation#
<Archive_Directory>\<TestName>\<DutTypeName> <SN>.kdbx
The test results inside the database “<DutTypeName> <SN>.kdbx” if organized by database objects that are named:
<DutTypeName> <SN> <TimeStamp>
Note
The original KET channel is not part of the archiving schema.
Examples#

If a SerialNumber of a DutTypeName runs the same test multiple times, the resulting database contains more objects:

If the same test is run by different SerialNumbers or different DutTypeNames the results are located in dedicated databases:

If different TestNames are run by the same DutTypeName with the same SerialNumber the results are divided by the TestName directory:

Remove and Forget Tests#
If a test is finished but should not be archived it can be removed. This cleans the row in the Dashboard table and deletes the database in the working directory.
A test that was not created in the Dashboard cannot be removed. This test can be removed from the Dashboard by forgetting it. The database file is not deleted.
Change the Channel for a test#
If a test is not running and does not have results, the KET channel may be changed to another free KET channel. It is not possible to change the KET channel of multiple tests at once.
Differences between created and started outside of the Dashboard#
Tests that are not created in the Dashboard, are still listed in the Dashboard table once they block a KET channel (when they are started). Those tests are automatically controllable via the Dashboard. Those tests are different in the following aspects:
Tests cannot be archived via the Dashboard. They can be archived via dB-Lab.
Test cannot be removed via the Dashboard. They can be forgotten.
The reason for the different behavior is that the Dashboard’s archiving and removing actions delete the test database. If the test is not created by the Dashboard, the database is most likely not located in the working directory and this directory could be under control of another process. Furthermore, could be organized with a custom schema and contain other objects that would also be deleted if the Dashboard would remove the database file.
Filter#
The filter can be used to quickly find tests via text matching. If quotes are used for the search term, an exact matching is used.
Sorting Tables#
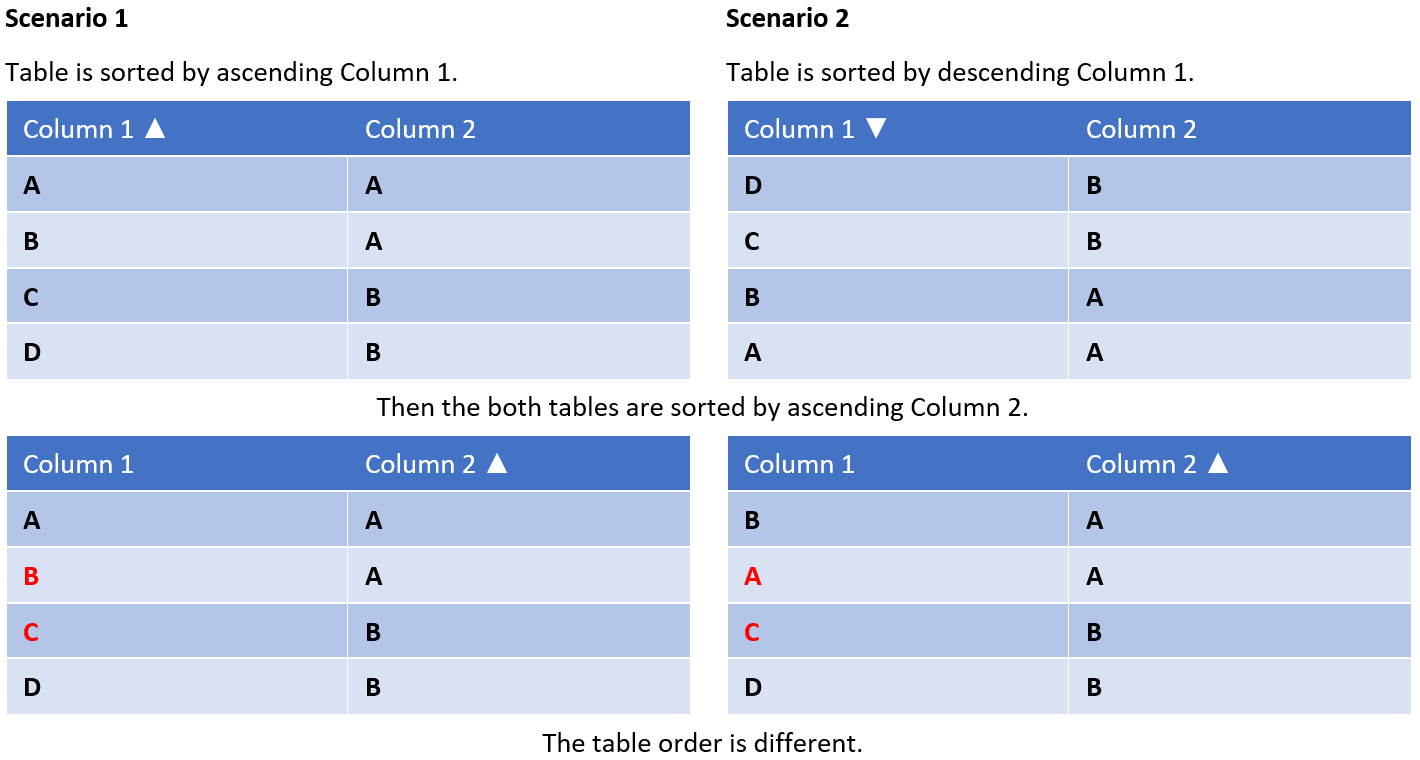
The table can be sorted alphabetically ascending or descending. The sorting is cumulative.
Example:
Watchdog#
The Dashboard can activate an independent watchdog process. In the case of an abnormal termination of the Dashboard, the Dashboard is recovered by the Watchdog process.
Remote Access#
The Dashboard can be accessed remotely if the Dashboard server allows remote access (Configuration menu in the Dashboard). If the Dashboard application is used as a client, servers are detected automatically. They are listed in the Configuration menu under KET Dashboard Server List.
The Dashboard table can also be accessed via a web browser under <ipv4>:<port>. The port is chosen on the Dashboard server startup. It is visible in the application title bar.
It can also be accessed programmatically via the windows registry:
HKCU\SOFTWARE\Klippel\KET\Dashboard --> port
When accessed remotely, the Dashboard cannot show/hide the dB-Lab instance.
Since there are no additional security measures, the remote access should only be activated in thrusted environments. The responsibility for network security lies with the user. Please consult with your IT administrator.
Frequently asked Questions#
- I cannot change Type Name, Test Name or Serial Number.
Those properties can only be changed for tests that are stopped. To change the properties, double-click on the dedicated cell. However, it is more comfortable to define the properties when creating the tests.
- Can I use the Dashboard without dB-Lab?
Yes, but only as a client for accessing another Dashboard (server) instance for remote monitoring and control. Please use the dedicated Dashboard client setup.
- My Dashboard client does not find my Dashboard server.
Please check that the server allows remote access in the Configuration menu.
The detection of servers is based on UDP broadcast messages. Please consult with your IT administrator.
- My Dashboard client cannot open my Dashboard server.
If the server can be found, but cannot be opened, the problem lies probably with the firewall of the server that does not allow the access. Please consult with your IT administrator.
- I activated the Autostart but it seems it is not started automatically.
First, check the system tray. The KET Dashboard is started in tray mode when auto-started.
- I want the KET Dashboard to be started in non-tray-mode on autostart.
The easiest way to do achieve this is to disable the tray mode in the configuration menu. If you want to use the tray mode but want to show the KET Dashboard remove the /startintray from the autostart entry in the registry:
Computer\HKEY_CURRENT_USER\SOFTWARE\Microsoft\Windows\CurrentVersion\Run Klippel KET Dashboard
Note
This key is changed when the Autostart is changed in the configuration menu. You might want to consider to create a separate key for your custom auto-start.
Not so frequently asked questions#
- I want to change the ports for the UDP broadcast messages for automatic server detection.
On your Dashboard server and all clients, change the registry values (valid range 0-65535, usually 0..1024 are reserved for the system):
HKCU\SOFTWARE\Klippel\KET\Dashboard --> port_ask_for_servers
and
HKCU\SOFTWARE\Klippel\KET\Dashboard --> port_server_response
- Why is the webserver port not constant?
The port is implemented dynamically, because the port might already be occupied. The port can be read (but not set) via the registry value
HKCU\SOFTWARE\Klippel\KET\Dashboard --> port
programmatically.
KET - Sequence Control & Phases#
Introduction#
The Klippel Endurance Test (KET) allow performing of long‑term, aging and/or destructive testing of transducers, permanent monitoring the states of the device under test (DUT) and/or External Sensors data. It consists of the KET Sequence Control (KET-Seq) and KET Phases, which define a test sequence of a DUT. Using multiple test phases, the sequence can be tailored to the specific endurance test task, allowing to
define different stimuli at different time steps,
log data provided by External Sensors,
control external peripherals, such as heating chambers (and other),
Both internal and external stimuli can be applied in every test phase. For internal stimuli, apart from different supported signal types, the amplitude, spectral bandwidth and/or crest factor can be defined. The support of pre‑defined on/off‑cycling and voltage stepping gives additional flexibility.
During the endurance test, the instantaneous variables (e.g., voltage, current, resistance, temperature) are sampled periodically. Additional high‑resolution curves of the last-minute help to create death reports in case of DUT failure. This allows to assess the maximal limits of the DUT more precisely.
Basic Principle#
A test sequence consists of at least one test phase. While a test phase defines stimulus, stepping/cycling, limits, etc., the sequence control manages the KET channel and test specific settings. By adding more than one test phase, the user is able to define complex test sequences. The sequence control will handle connection to the playback/capture device, control repetitions and stop the test if it is finished, a limit is violated, or another fail condition is reached.
The setup of a complete test consists of sequence specific settings, such as used channel, number of repetitions etc. (for more, see KET Sequence Control). Those settings are automatically propagated to the test phases, which in case have a set of test specific settings, which may change from phase to phase (see KET Test Phase).
Every test phase allows to add limits to the measures. There are no sequence specific limits, every test phase defines independent limits.
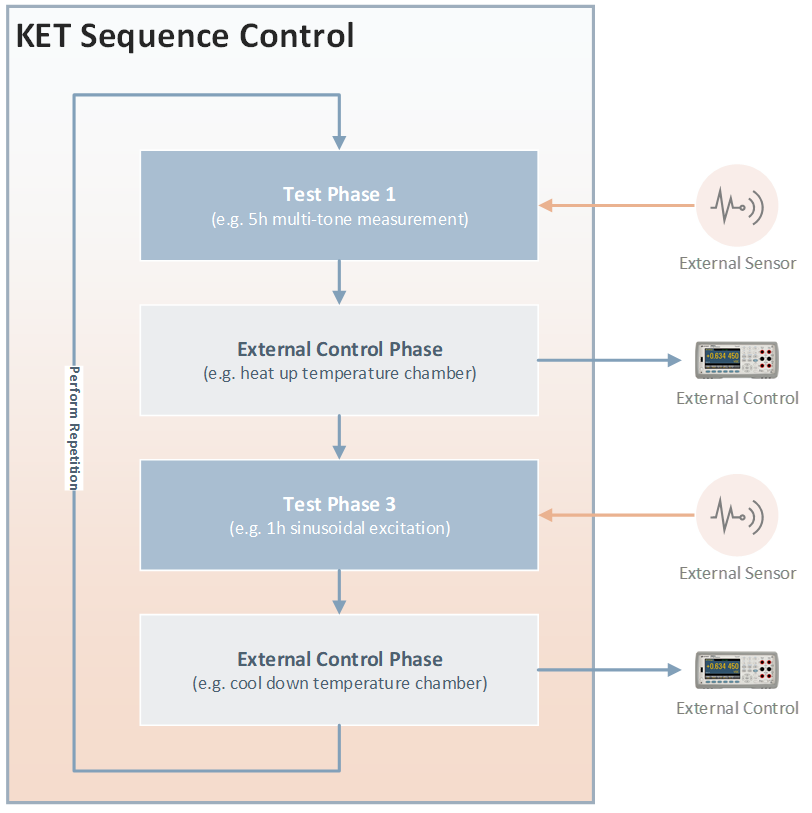
Figure 1.1: Example test sequence, consisting of 4 test phases, external sensor readout, external control as well as repetition of the sequence
To configurate the sequence, simply open a DUT-object in dB‑Lab:
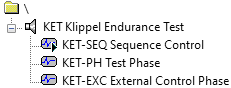
The sequence control can be identified by the applied badge  . One sequence control per DUT
is supported. In contrary to the other dB‑Lab operations, the test phases are solely used for
setting up the endurance test; they will hold no results after the measurement.
. One sequence control per DUT
is supported. In contrary to the other dB‑Lab operations, the test phases are solely used for
setting up the endurance test; they will hold no results after the measurement.
During (and after) the measurement, the sequence control operation will provide all necessary information, such as
general overview about measured values,
long‑term curves,
applied limits,
etc.
What is the Difference to the Power Test (PWT)?
Although the Klippel Power Test shares some similarities with the endurance test, the endurance test focus more on long‑term monitoring of DUTs while enabling to use other Klippel R&D modules for special measurement tasks:
monitors up to 64 DUTs simultaneously (depending on hardware),
provides limits for every logged measure,
no protection of the driver but failure detection,
user defined noise generator, limiter and band-pass filter,
user defined amplitude and cycling scheme,
no transducer identification algorithm.
Phases of the Endurance Test#
General#
The sequence control supports two kinds of phases:
Test phases (intended for endurance testing), and
External Control phases (controlling external devices via script).
The test sequence is not limited by a certain number of phases, and can repeat them as long as desired. Data reduction may be performed, as specified in the phases, while high resolution data of the last minute is kept to aid “cause of failure”-analysis. Roughly every 10 minutes, the result data is stored on HDD to cope with data loss issues e.g., on power cycling.
Test Phase#
As aforementioned, a test phase is the basis for every sequence. Multiple test phases can be sorted sequentially, giving the opportunity to run complex test scenarios. Every test phase can provide a different stimulus setting, different excitation levels, stepping / cycling profiles and limits.
Data logged in a test phase is made available in result windows. Depending on the configuration, the windows will be shown after the start of the sequence.
External Control Phase#
As implied by the name, the external control phase is intended to communicate with external devices and to control those.
For high flexibility implementing control and communication tasks, an external, user-defined script can be triggered by this KET-phase.
Executable and batch files can be specified and are started at the position of the external control phase in the KET sequence. The KET sequence waits until the called program is finished and proceeds with the next phase in the sequence. Multiple external control phases can be executed after each other.
Python or other scripts that cannot be called directly require a wrapping batch file. If you’ve added Python to your PATH then you can use a simple batch file like this:
python <myScript.py>
No data are measured during this phase. For setup see KET External Control Phase.
Application Note 84 provides an example how to control an external heating chamber using Python scripting.
Setup Reference#
KET Sequence Control#
Metadata#
Programmatically evaluable information about the test and the DUT.
- Serial Number
Serial number of the DUT. The format is defined by <PREFIX><NUMBER>, where
<PREFIX> is a sequence of UTF8 characters ending with a non‑integer character,
<NUMBER> is a sequence of integer numerals.
Example: KET-DUT8-123456789
- DUT Type Name
Description of the DUT type, e.g. “Mid-range woofer”
- Test Name
Name of the running test
Sequence Configuration#
General configuration defining the sequence behavior.
- KET Channel
Channel used for running the sequence. A channel is configurated in the KET Hardware Config, and represents a supported playback/capture device with a valid Dante® configuration.
- Repeat Sequence
If checked, the complete sequence is re-run after the last phase has finished.
- Mode
If the sequence is repeated, represents the mode of repetition. Available modes are:
Stop After: The test will be stopped after the sequence has been repeated by a given number of repetitions.
Infinite: The test will be repeated indefinitely. It is only stopped by user interaction, limit violation and/or hardware error.
- Stop After
If the sequence is repeated and the mode is set to Stop After, defines the number of sequence repetitions. The complete number of sequence runs is 1 + \(N_{repetitions}\).
- Pilot Tone Frequency
Frequency of the pilot tone, applied if a phase is measuring \(R_e\) (and does not override the setting locally).
- Pilot Tone Amplitude
Amplitude in V of the pilot tone, applied if a phase is measuring \(R_e\) (and does not override the setting locally).
See also
For more information on pilot tone setup, see Pilot Tone Adjustment
Driver#
- Voice Coil Material
Choose a default material (Copper, Aluminum) or Custom to enter a custom temperature coefficient.
- Temperature Coefficient
Temperature coefficient of the voice coil (available if Custom is selected for Voice Coil Material).
- Re (ΔTv =0)
Override measurement of rest temperature resistance.
KET Test Phase#
Measurement Setup#
Stimulus#
Settings for the used excitation signal.
- Type
Defines the type of the stimulus used in this phase. Can be
White Noise: White noise according to standards
Pink Noise: Pink noise according to standards
Multi-tone: A sparse multi-tone signal as defined according to IEC 60268-21 Standard.
WAV file: A customer defined wav-file. Note that the signal will be clipped if defined outside the [-1, +1] digital domain.
MTON based: Based on the Multi-tone Measurement (MTON) module.
Log Sweep: Logarithmic sweep
Two-tone: Two-tone signal, comprising of two sinusoidal tones.
Sine: Sinusoidal excitation at one frequency.
- High‑Pass Filter
Activates the high‑pass filtering of a noise signal. It is available for: White Noise, Pink Noise
- Slope
Filter slope in dB/octave. Available values:
6 dB
12 dB
24 dB
Sharp Transition (rectangular window)
- Cut‑off Frequency
Cut‑off frequency fhp of the high‑pass filter
- Low‑Pass Filter
Activates the low‑pass filtering of a noise signal. It is available for: White Noise, Pink Noise
- Slope
Filter slope in dB/octave. Available values:
6 dB
12 dB
24 dB
Sharp Transition (rectangular window)
- Cut‑off Frequency
Cut‑off frequency flp of the low‑pass filter
Note
The frequency resolution for filters is 3rd octave. Cut off frequencies are rounded to the next 3rd octave frequency (Standardized R10 series applied). A minimum bandwidth of at least one 3rd octave shall be defined.
- Target Crest
Target crest factor of a noise (or noise‑like) signal in dB. Increases time of sequence initialization.
Available for: White Noise, Pink Noise, Multi‑tone
- Amplitude Shaping
If set, an additional 3rd octave amplitude shaping according to standards is applied to the stimulus.
Available for: Pink Noise, Multi‑tone
- fmin
Minimum excitation frequency
Available for: Multi‑tone
- fmax
Maximum excitation frequency
Available for: Multi‑tone
- Relative Resolution
Number of excited spectral lines per octave in pts/octave
Available for: Multi‑tone
- Path
Path to a wav‑file to use as stimulus. The file must have a sampling rate of 48kHz or less.
Available for: wav‑file
- Channel
Used channel of a wav‑file, if more than one channel is available
Available for: wav‑file
- MTON Operation
Provides the multi‑tone stimulus according to the setup in this operation.
Available for: MTON based
- fstart
Starting frequency of the logarithmic sweep
Available for: Log Sweep
- fstop
Stop frequency of the logarithmic sweep
Available for: Log Sweep
- Time
Length of the sweep in s
Available for: Log Sweep
- f1
First excitation frequency of a two‑tone stimulus
Available for: Two‑tone
- f2
Second excitation frequency of a two‑tone stimulus
Available for: Two‑tone
- U2/U1
Ratio between voltage of the second and first excitation tone in dB
Available for: Two‑tone
- Frequency
Frequency of the sinusoidal excitation
Available for: Sine
Level#
Specifies the stimulus level.
- \(u_{rms}\), \(u_{start}\)
Level of the stimulus in Volt. If stepping is activated, this parameter defines the starting voltage of the stepping.
- Voltage Reference Mode
Defines the reference value for a digital wav‑file. The two options are
Digital RMS (auto): The wav‑file is analyzed, and the digital RMS value over maximum 10 minutes is calculated.
Digital RMS (custom): The user may define the digital RMS value as pleased.
- Digital RMS
Digital RMS value, either calculated, or entered by the user.
This value is used as a base to determine \(u_{rms}\) resp. \(u_{start}\) for wav‑file stimuli.
Timing#
Define test phase length, cycling interval and stepping/cycling related options.
- Enter Duration in
Specifies if the entered Duration is displayed in seconds, minutes or hours
- Duration
Target duration of the test phase. If no limit is violated (or no other error occurs), the test phase will be stopped after this time.
- Stepping/Cycling Mode
Define if stepping and/or cycling should be used for the test phase. Available options are:
Continuous (no stepping/cycling)
Cycle
Voltage Stepping
Cycle + Voltage Stepping
Custom Profile
- Cycle: “On”-Interval
Length \(t_{on}\) of the applied signal at the DUT
- Cycle: “Off”-Interval
Length \(t_{off}\) of the muting after an “on”‑interval at the DUT
- Stepping: Type
- Defines stepping type. Can be either |
Linear: Use absolute voltage \(U_{step}\) for stepping.
Relative: Perform stepping based on a relative gain Gstep.
- Stepping: Voltage
Voltage increment Ustep used for every step
- Stepping: Gain
Gain increment Gstep used for every step
- Stepping: Maximum Voltage
Perform stepping until this maximum allowed voltage Umax is reached.
- Stepping: Maximum Gain
Perform stepping until this maximum allowed gain Gmax is reached.
- Stepping: Step Length
Length tstep of one voltage step. If both cycling and stepping are active, step length equals “on”‑interval (tstep =ton).
- Stepping: Profile: Type
Type of the applied custom cycling/stepping profile.
Can be either
- Absolute
- Use voltage and time based profiles.Format: [tstep, Utarget]
- Relative
- Use gain and time based profiles. Scaling is performed relative to Ustart.Format: [tstep, Gtarget]
Pilot Tone#
- Purify Stimulus
If activated, the pilot tone frequency setting is considered for stimulus generation for accurate resistance and temperature monitoring. Available for white noise, pink noise, multi-tone, MTON-based, and two-tone stimuli. Available only, if resistance or temperature monitoring is activated.
- Use Local Settings
If deactivated, pilot tone settings are managed by the KET sequence control. If activated, global settings are replaced by local pilot tone settings.
- Amplitude
Amplitude of the pilot tone, applied if the phase is measuring \(R_e\). The frequency of the pilot tone cannot be modified locally.
See also
For more information on pilot tone setup, see Pilot Tone Adjustment
Measures#
Logged Data#
Select logged data in this phase.
- Voltage
Log voltage signal versus time. Peak and RMS values are logged.
- Current
Log current signal versus time. Peak and RMS values are logged.
- Resistance
The resistance is calculated at the pilot tone frequency. The method of calculation depends on amplifier hardware:
Mezzo Amplifier: \(R_{\text{e}} = \text{Abs} (\underline{Z}(f_{pilot}))\)
Unica Amplifier: \(R_{\text{e}} = \Re (\underline{Z}(f_{pilot}))\)
The real part improves the accuracy of input impedance measurement attenuating the backinduced voltage from the mechanical domain. It is available for Unica-series only.
- Voice Coil temperature
Log temperature derived from resistance measurement using a pilot tone. The temperature may be smoothed using the Temperature Speed option.
- Power
Log apparent power (product of voltage and current RMS values).
External Sensors#
One or more external sensors can be logged during a test phase.
See External Sensors for interface details.
- Logged External Sensor
Semicolon separated names of the external sensors.
Format: ExtSensor_1; ExtSensor_2; …
Limits#
General Limit Setup#
All logged measures may have one or more limit applied. If the limit is violated, the sequence will stop.
- Limit Mode
Defines the type of the used limit. Available options depend on the logged measure. Available modes are:
No Limit: Do not apply any limit to this measure.
Absolute: Apply absolute values to the measure.
Relative (Fixed Reference): Apply relative limits to the measure. Use a custom value as reference.
Relative (Start Value): If supported, use the result of a pre‑measurement as reference.
- Min
If the measure falls below this value, the measurement is stopped
- Max
If the measure is below this value, the measurement is stopped
- Reference
Use this value as a reference for relative modes with fixed reference
Limit ΔTv Voice Coil temperature#
- Temperature Speed
Defines smoothing time interval for the measured temperature of the voice coil. Available options are:
High: No smoothing for temperature result. The result is not delayed, most accurate but also noisy. In case of noise problems, select other speed option. For estimations on thermal time constants use this mode.
Medium: smoothing of 10s for temperature result. The temperature result is delayed and smoothed over the last 10s.
Slow: smoothing of 30s for temperature result. The temperature result is delayed and smoothed over the last 30s. For woofer and subwoofer this mode recommended.
Compression Limits#
The output compression of power amplifiers is monitored and warnings and errors are generated automatically.
See also
See section Result Window: Device Compression.
KET External Control Phase#
External Control#
- Control Script Path
Path to a control script. There is no limitation in the used language, as long as it is installed on your PC.
Note
Script finish will be interpreted as “success” if the return code is 0.
- Arguments
String passed as argument list to the control script. Can include one or more arguments, depending on the used script.
- Timeout
Stop the script execution if it is not finished after this time.
Results Reference#
Aggregated results from all phases are available at the KET-SEQ Sequence Control operation.
State Signals#
The phase setup determines which state signals are logged.
Result windows displaying state signals over time comprise the following types of curves:
- State signals
They are aggregated over ca. one second from the high resolution signals reported by the device
- High resolution state signals
For each state signal, the raw, high-resolution state signal is available for the most recent 60 seconds of the current or last phase. They are labeled with a “(HiRes)” suffix, e.g., “Voltage rms (HiRes)”.
For Powersoft Mezzo series amplifiers, the high resolution data has 3 samples per second on average.
For Powersoft Unica series amplifiers, the high resolution data has ca. 4 samples per second on average.
By default, they are shown only after a DUT failure. In the chart’s Subset settings, you can choose which curves should be shown.
- Limits
Limits, if set in the test phase setup, will be shown in the state signal windows. By default, they are dashed lines in the same color as the state signal.
- Curves with additional smoothing (ΔTv only)
See description of ΔTv (smoothed) later in this paragraph. By default, it replaces the state signal aggregated over ca. one second (ΔTv). In the chart’s Subset settings, you can change which of the curve(s) will be shown.
Result windows are available only when needed, windows without any logged measure are hidden.
The following result windows with state signals are available:
- Result Window: u(t) Voltage, i(t) Current
Voltage rms
Voltage peak
Current rms
Current peak
- Re(t) Resistance
Re resistance,measured by the pilot tone configured in the sequence and/or Test Phase.
See also
For more information on pilot tone setup, see Pilot Tone Adjustment
- ΔTv(t) Temperature, P(t) Power
ΔTv (smoothed) change of voice coil temperature with additional smoothing.
ΔTv change of voice coil temperature with one second sampling, hidden by default.
P power, synthesized from u rms and i rms.
The interval for smoothing ΔTv (smoothed) is determined by the Temperature Speed option of the Test Phase. The smoothed temperature change becomes available a few seconds after the start of each phase.
The ΔTv curve with one second sampling (aggregated from high resolution data) is hidden by default, in favor of the smoothed curve. It can be enabled in the chart’s Subset settings.
To reduce noise of the temperature curves, improve pilot tone frequency and level.
See also
For more information on pilot tone setup, see Pilot Tone Adjustment
Result Window: Device Compression#
Amplifiers may reduce the output signal, e.g., under high load. This chart shows the compression as reported by the amplifier, in dB over time.
The following thresholds for warnings and errors / abortion of measurements are implemented. Warnings are shown in the KET dashboard as well in the dB-Lab operation KET-SEQ. Compression may be also caused by other channels that require more power or voltage than the hardware can supply. Those thresholds cannot be modified by the user.
Severity |
Compression threshold |
|---|---|
Warning |
5 % |
Abortion / Error |
50 % |
Result Window: Overview#
The Overview window lists the most important settings and information about each phase. If repetitions are enabled for the sequence, the list of phases is extended for each phase.
Result Window: Protocol#
The protocol window lists details of the measurement, including hardware settings, errors, temporary warnings. You can also see interruptions to the measurement.
Result Window: External Sensors#
If external sensors are configured, one or more windows will be added to show the sensor signal over time.
External sensors can be configured in the Test Phase setup. For more information, see External Sensors
Measurements#
Logged Measures#
Depending on the used hardware, the endurance test supports measurement of
effective and peak voltage \(U_{rms}\) and \(U_{peak}\),
effective and peak current \(I_{rms}\) and \(I_{peak}\),
mean voice coil resistance at pilot tone frequency \(R_e\),
voice coil difference temperature (heating) \(ΔT_v\). See also Increase of Voice Coil Temperature.
apperent power \(P\)
Using External Sensors, every test phase is able to log additional arbitrary signals provided by external sensors via a user script.
Reference Resistance#
The voice coil temperature is calculated by comparing the dc resistance Re(t), corresponding with the absolute voice coil temperature Tv(t) at measurement time t, with a reference resistance Rcold measured at the reference temperature T(tref). The reference temperature corresponds to the ambient temperature, when the driver is in thermal equilibrium, either at the beginning of the test or during a long OFF-Cycle. The electrical dc resistance can be estimated by measuring the electrical impedance Ze(fpilot) at a very low frequency (fpilot= 2…5 Hz is recommended for woofers) or at other frequency where the impedance is minimal (recommended for loudspeaker systems with crossover).
See also
For more information on pilot tone setup, see Pilot Tone Adjustment
Increase of Voice Coil Temperature#
The increase of the voice coil temperature during the test is expressed in Kelvin. It is calculated by using the reference resistance Rcold = Re(t0), measured at the starting time t=t0, the resistance during the measurement Re(t), and the temperature coefficient α for the voice coil material.
Pilot Tone Adjustment#
The proper setup of the pilot tone defines the accuracy of resistance and coil temperature measurements. Furthermore, the Temperature Speed option in the KET phase setup may be used to further smooth out the variance of temperature.
Frequency#
The pilot tone can be set to any audio frequency (\(2\,\text{Hz}-20\,\text{kHz}\)). It is recommended to select a frequency where the electrical input impedance is minimal. For transducer testing, a very low frequency close to DC (\(2-5\,\text{Hz}\)) shall be used. Also the impedance minimum above resonance may be used for pilot tone.
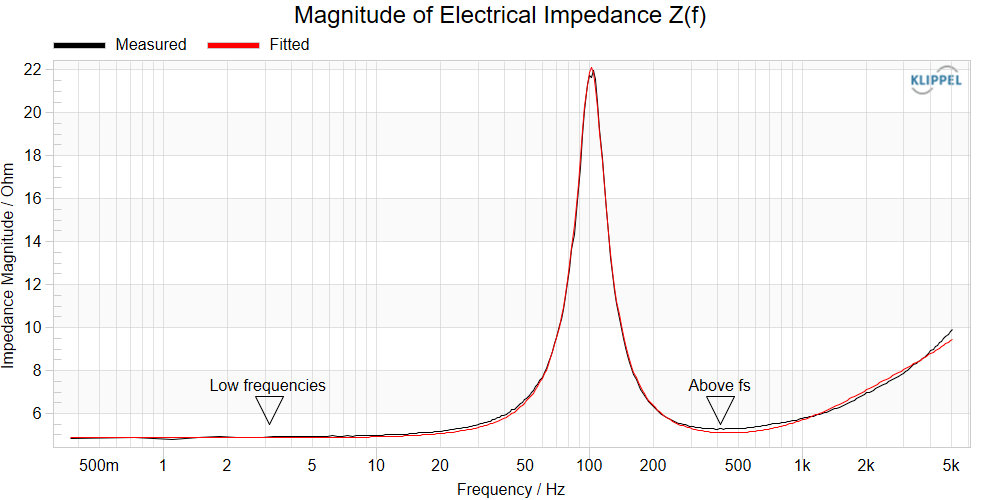
For passive systems with cross-overs also select the frequency range of minimal impedance.
Generally speaking make sure, the pilot tone frequency is far away from potentially varying resonance (such as mechanical resonances at \(f_s\) or cone break up resonances, which are visible as small peaks in impedance curve above \(f_s\)). A variation of the resonance (which is typically the case, when the level is altered), shall not influence the resistance at the pilot tone frequency. To figure this out, impedance tests may be compared at different level (at least low, medium, high).
Level#
The amplitude of the pilot tone is specified as the voltage at the terminals of the speaker. A compromise between too high and too low level must be found. Due to many factors that influence the level, there is no automatic mode available.
If the level is too high, the induced power at the pilot tone may heat up the coil and the low frequency vibration may disturb the regular behavior of the device under test.
If the level is too low, the resistance monitoring is noisy and the variance of resistance and or temperature may be too high.
A good starting point is a level \(10-20\,\text{dB}\) lower than the test signal. For automatically increased stimuli, the pilot tone may be selected even a bit higher which yields better results at higher amplitudes.
The accuracy of higher DC resistances than \(16 \Omega\) might suffer from noise limitation in the current channel. Those devices require a higher level of the pilot tone than set in the templates.
Multi-tone Purification#
Even with a properly defined pilot tone, at high level, the main contribution of resistance and temperature variance is intermodulation distortion found at the pilot tone frequency. Special configurations based on multi-tone stimuli are available for white noise, pink noise, multi-tone, MTON-based, and two-tone stimuli. Using the purification option, intermodulation distortion are significantly suppressed. This option is available only, if resistance or temperature monitoring is activated and if the pilot tone frequency is \(\le 10\,\text{Hz}\). See section Purify Stimulus for setup.
External Sensors#
Data from external sensors can be monitored by KET sequences. A typical example is to include data from climate sensors in the KET test to document the conditions of a DUT in a climate chamber during a test.
One sensor (e.g. power test room temperature) can provide data for multiple KET tests, so the sensor data is stored in a global container (KetExternalSensorStorage). Every sensor needs to open its own slot inside the KetExternalSensorStorage where it can store the measurement data.
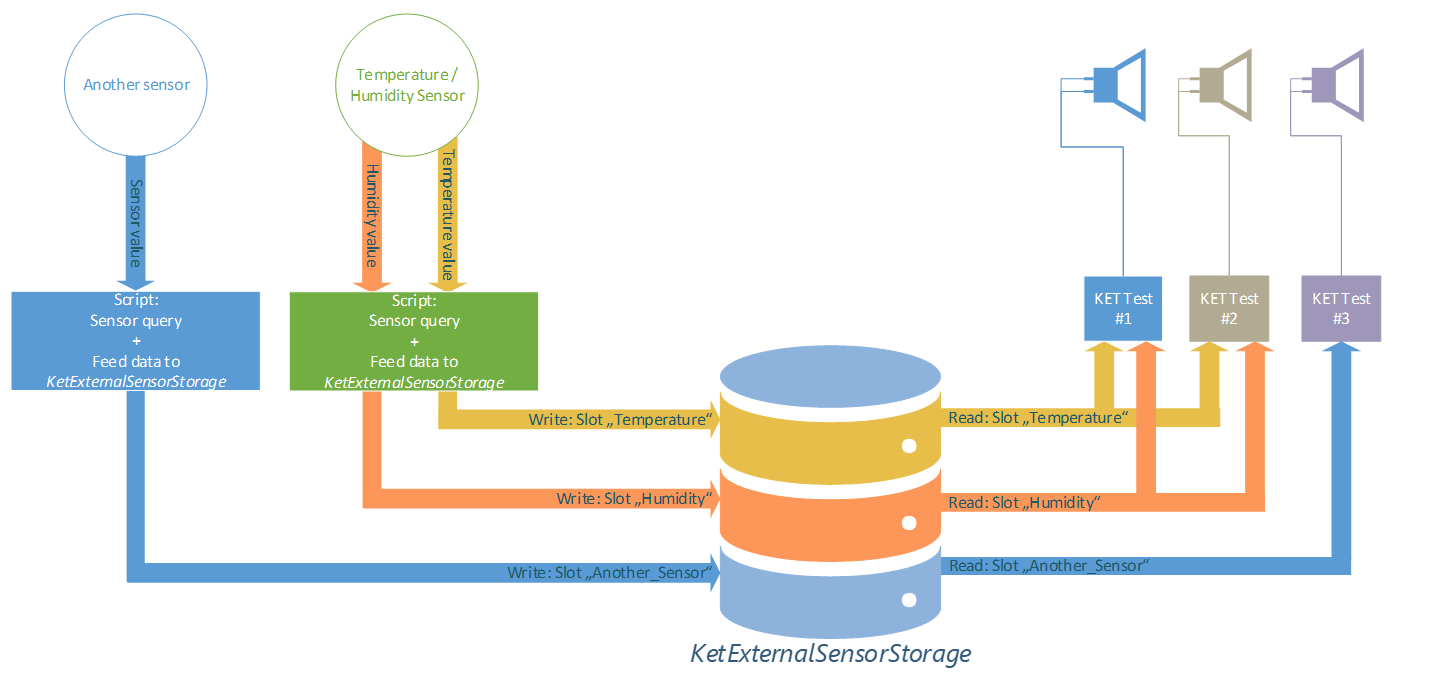
A process (e.g. a script) needs to read the sensor out and put its data into the KetExternalSensorStorage. The individual KET-PHs can access the data via the Measures tab.

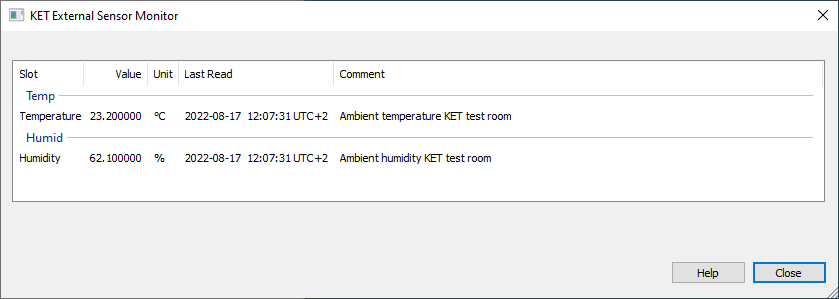
The current contents of the KetExternalSensorStorage can be viewed in real-time via :
KET - Troubleshooting#
Overview#
This chapter will provide information that can help you to solve common problems that occur with the Hardware unit.
Configuration, diagnostics and most troubleshooting options for KET devices is available in the Hardware configuration dialog.
If you cannot find a description here that matches your problem, try these options:
Software Messages#
Firmware Update Required#
The KET device requires a firmware update. This may happen after a KET software update or when you have acquired the KET device from a 3rd party.
For Powersoft devices, you need to download their product ArmoníaPlus from their website, powersoft.com. The firmware required is available from their website, too.
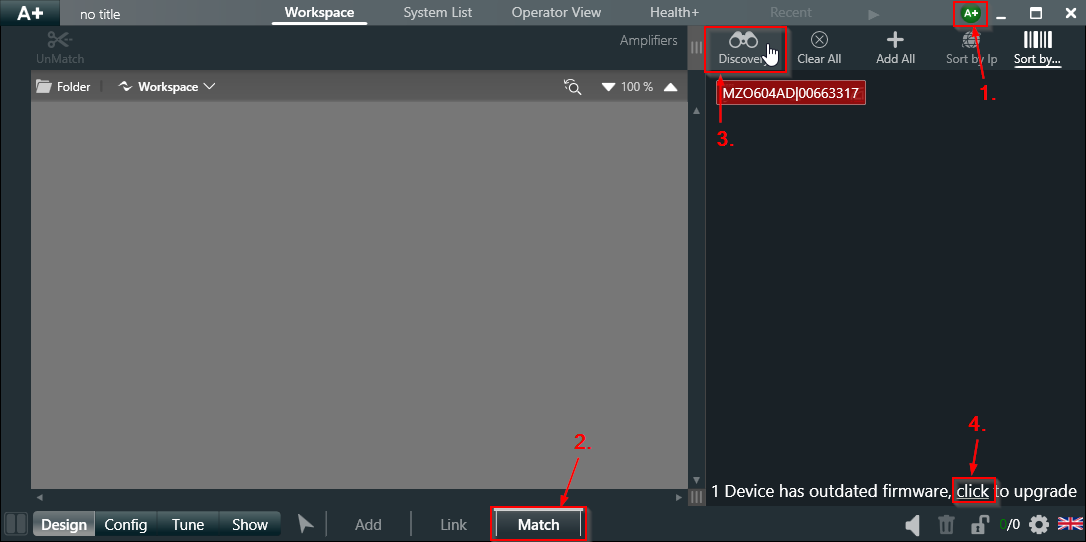
After installing the ArmoníaPlus software, please open it and ignore all questions for login or creating a project (you can simply skip these steps). Then you need to activate the Synchronization in the upper-right corner of the program, navigate to the Match panel and hit the Discovery button. You should now see all amplifiers that are connected to the PC as well as the hint that some of the connected amplifiers have pending firmware updates. Please follow the steps for the firmware update and wait for the installation to finish (might take some time). Finally, you can simply close the ArmoníaPlus software and use the amplifier in KET.
Invalid Setup Configuration#
- Cause
The setup configuration of the KET Sequence Control is invalid.
- Remedy
Open the property page, and change the erroneous value.
No Phases for the Sequence Available#
- Cause
The sequence consists of no phases.
- Remedy
Add phases to your test sequence.
No Valid Setup Found for Phase …#
- Cause
The setup of a phase could not be read.
- Remedy
Check the setup of the displayed phase for validity. Try to restart the test sequence.
KET Channel Already in Use#
- Cause
The selected KET channel is used by another instance of the KET Sequence Control.
- Remedy
Select another KET channel for the test, or finish the test running on the selected channel.
No Valid KET Channel Selected#
- Cause
The selected KET channel is not available on the running machine.
- Remedy
Select another KET channel for the test, or configure the selected channel using the KET Hardware Configuration.
Cannot Instantiate KET Player/Recorder#
- Cause
The playback device could not be initialized.
- Remedy
Try to restart the test sequence.
Try to restart the computer.
Uninstall and re-install the Klippel Endurance Test.
If the problem still persists, contact KLIPPEL support.
Phase Properties not Initialized#
- Cause
The sequence consists of not supported phases.
- Remedy
Make sure that you have installed the most recent version of the Klippel Endurance Test.
Exceeded Number of Licensed DUTs#
- Cause
test sequence should be started, but the maximum permitted number of parallel running tests is exhausted.
- Remedy
Upgrade your license, or stop another test sequence.
Unknown License Device#
- Cause
The license device could not be identified.
- Remedy
Make sure you have connected a valid license device (e.g. Klippel Dongle).
License File not Available#
- Cause
No supported license file is available for your license device.
- Remedy
Make sure you have connected the license device matching your license. If the problem persists, contact KLIPPEL support.
Lost Connection to License Device#
- Cause
During the running sequence the connection to the license device was lost.
- Remedy
Make sure that license device is connected to the host PC during the test sequence.
Measurement Slot Seized by Another Measurement#
- Cause
nother measurement took control of the licensed measurement slot.
- Remedy
Upgrade your license, or stop another test sequence.
Phases Were Added While the Sequence was Interrupted#
- Cause
While the running sequence was interrupted (e.g. caused by power-cycling), phases were added to the test sequence.
- Remedy
Delete the added phases.
Phase Setup or Order of Phases Were Changed#
- Cause
While the running sequence was interrupted (e.g. caused by power‑cycling), the setup and/or order of one or more phases were altered.
- Remedy
Restore the old setup/order of the phases.
Result Data not Continuously Stored#
- Cause
While the running sequence was interrupted (e.g. caused by power‑cycling), the order of one or more phases were altered (mixing run/not run phases).
- Remedy
Restore the old order of the phases.
Unable to Initialize Repetition Buffer#
- Cause
While the running sequence was interrupted (e.g. caused by power‑cycling) on a sequence with repetition, the next repeated phase could not be found.
- Remedy
Make sure that the old setup/order of the phases is recovered.
Channel Gain Differs Significantly#
- Cause
The determined channel gain differs significantly from the typical value of the supported device.
- Remedy
Check if the Dante® routing is valid. Check for hardware errors.
Channel Gain Changed on Continuation#
- Cause
If the measurement was stopped (e.g. by power-cycling) and restarted, the determined channel gain differs significantly from the previous measurement.
- Remedy
Check if the Dante® routing is valid. Check for hardware errors.
Requested Pilot-tone Frequency Not Supported#
- Cause
The requested pilot-tone frequency is not supported by the measurement device.
- Remedy
Choose a valid pilot-tone frequency, as hinted by the error message, or use a different measurement device. See hardware specification for details.
Requested Pilot-tone Amplitude Not Supported#
- Cause
The requested pilot-tone amplitude is not supported by the measurement device.
- Remedy
Choose a valid pilot-tone amplitude.
Re(ΔTv=0K) Could not be Determined#
- Cause
The reference voice coil DC resistance Re at ambient temperature could not be measured.
- Remedy
Check the DUT connection. Increase the amplitude of the pilot tone.
See also
For more information on pilot tone setup, see Pilot Tone Adjustment
Device channel limiter exceeds boundary#
- Cause
This error is triggered by compression monitoring when compression measure is below -6 dB on 3 consecutive datapoints.
- Remedy
The power amplifier is overloaded. Reduce the output level, number of channels per amplifier or use a more powerful amplifier.
… Violated Limit#
- Cause
The execution was stopped, because a user defined limit was violated.
Error Reading External Slot#
- Cause
An error occurred reading data of External Sensors.
- Remedy
Make sure that the External Sensors data is written to the data slot.
External Control Script Error#
- Cause
The execution of an external control phase was stopped prematurely by an error of the script.
- Remedy
Solve the error in the external control script.
External Control Script Failed to Finish in Time#
- Cause
The external control script timed out (failed to finish before Timeout was reached).
- Remedy
Increase the Timeout setting, or solve the possible error in the external control script.
“Pause” of Execution Currently not Supported by …#
- Cause
Trying to pause a running sequence during a phase which doesn’t support “pause”.
- Remedy
Do not try to pause the sequence in such a phase.
Failed to initialize output device KETPlayRec … failed to create buffers#
- Cause
The DVS (Dante Virtual Soundcard) is not configured correctly.
- Remedy
Set the number of Audio Channels in DVS to 64x64. The DVS Settings page is available from the Windows start menu (search for “Dante Virtual sound card”), or from the Hardware configuration dialog’s menu by selecting .
Hardware Messages#
The Installed Firmware Does Not Support …#
- Cause
Feature requires a newer firmware version than installed on the measurement device.
- Remedy
Perform a firmware update.
Thermal error: …#
- Cause
The measurement device reported a thermal error. Typical causes are overheating of the amplifier, e.g. by a broken fan.
- Remedy
Improve cooling of the device. If this does not help, contact support.
Output voltage error: …#
- Cause
The measurement device reported problems with the output voltage. Typically, these problems are caused by blown fuses or reaching the rail voltage.
- Remedy
Contact support.
Miscellaneous error: …#
- Cause
The measurement device has raised a generic error.
- Remedy
Contact support.
Device error: …#
- Cause
An unknown device error was issued.
- Remedy
Contact support.
Nack Response From …#
- Cause
The device refused to perform the last send command.
- Remedy
Contact support.
