3DL – 3D Limits#
3DL – Tutorial#
Overview#
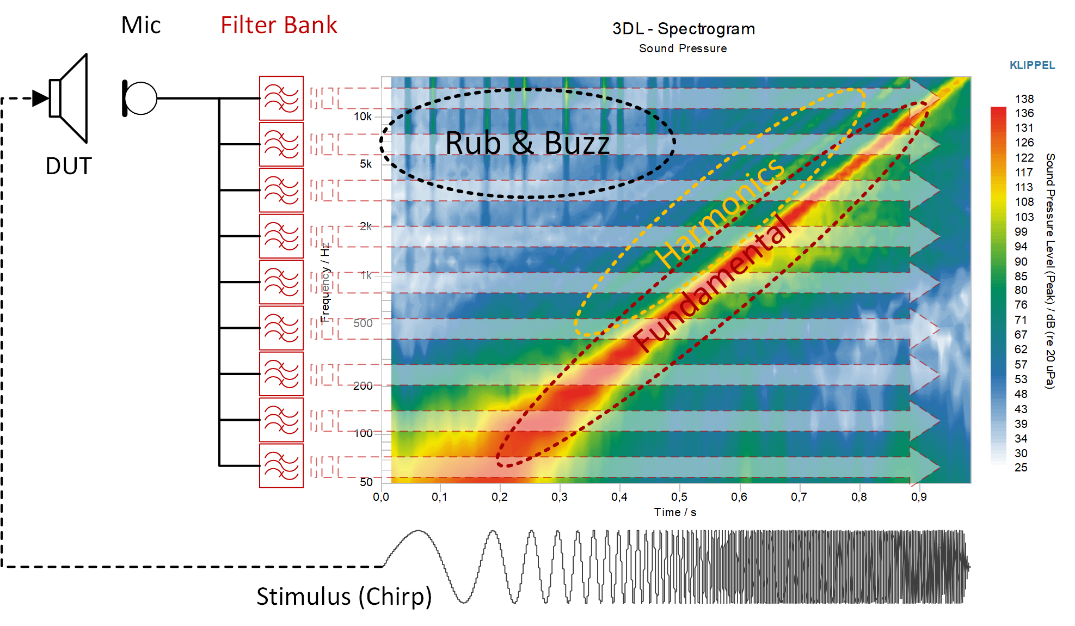
The Spectrogram 3D Limits (3DL) is an add-on module for the SPL Task of the KLIPPEL QC Software. In addition to the standard results of the SPL Task, the 3DL performs a time-frequency analysis of the measured chirp response using an auditory filter bank which based on human hearing. In contrast to common Short-Time Fourier Transform (STFT) this filter bank provides a superior time resolution for identifying impulsive distortion (Rub&Buzz).
The resulting spectrograms provide enhanced diagnostics of the spectral fingerprint of any abnormal sound and distortion produced by the measured audio product. Testing is made easy through three-dimensional limits that are automatically calculated based on approved reference units and efficient limit parameters.
For a chirp signal, both the excitation frequency (time point) as well as the dominant spectral components (symptom) of any distortion are identified easily in the provided Exceedance plots that indicate where the spectrogram limits are exceeded. Diagnostics is simplified by derived 2D projection plots.
The 3DL is closely related to the KLIPPEL TFA – Time Frequency Analysis which is a general-purpose diagnostics tool that provides additional features an in-depth off-line analysis any waveform measured with the KLIPPEL Analyzer System or provided by wave files. In addition to the filter bank, further analyses are provided such as Wavelet transform. Also, it is possible to play back band-pass filtered parts of the waveform with adjustable playback which makes it a powerful tool for defect diagnostics.
Creating a Test with 3DL#
Note
The number of SPL-tasks within a test sequence that provide 3DL result windows is limited to 10.
Activating 3DL for an Existing Test#
The 3DL is an add-on to the SPL Task, hence no separate task needs to be inserted in the task sequence when using existing QC operation that already contains at least one SPL Task. The 3DL feature is simply made available by installing the corresponding license.
If the license is installed and valid, the 3DL features are shown in the SPL Task’s property page in section Results.
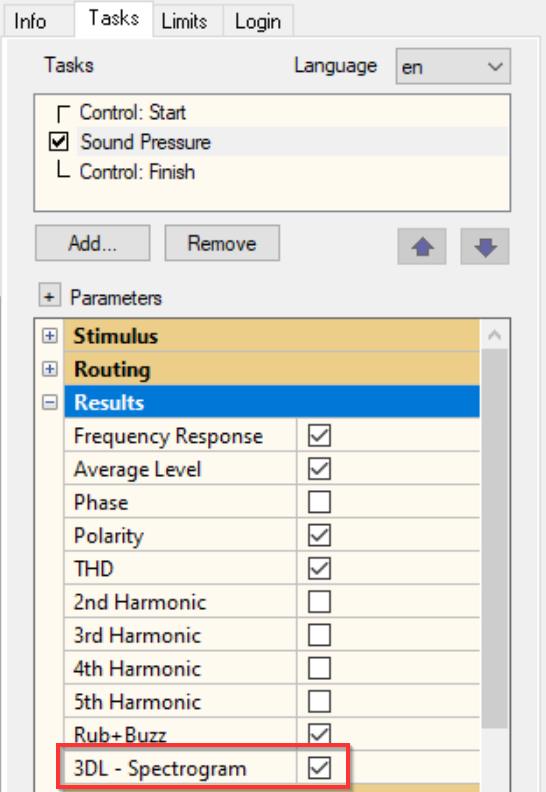
Now make sure that all relevant 3DL result windows are activated
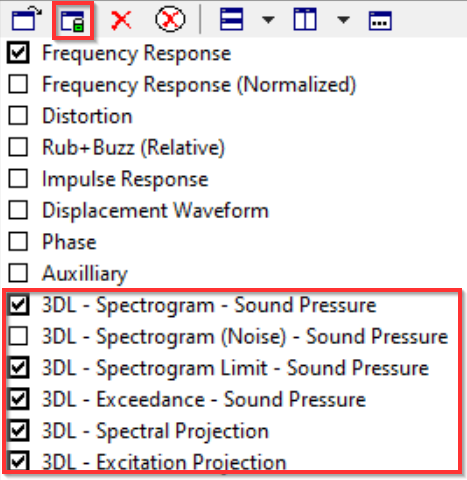
Rearrange your result windows and store the window configuration.
Creating a New Test#
QC Start Template#
For creating a new test
Open the
Click
Give the test a clear name and choose a suitable template that contains 3DL, then click Ok.
You may log into the test now by clicking the Measure button.
For instance, the following test templates are specifically preconfigured for operation with 3DL:
– standard woofer test template (SPL and IMP) enhanced with spectrogram limits
– multi-purpose test template using a single SPL Task for chirp-based testing enhanced with spectrogram analysis (e.g., for defect diagnostics or Rub&Buzz filter tuning)
Note
You may use any other test template that suits your application and includes at least one SPL Task. In this case create the test and then follow the instructions in Activating 3DL for an Existing Test and rearrange the result windows.
Operation Template (R&D Framework)#
If you intend to operate the 3DL within the KLIPPEL R&D Software framework, you may use a dedicated operation template:
Create or open a KLIPPEL database
Add a new operation by using the operation icon or
Select Categories and Modules: QC-Software - QC quality control and Template: QC SPL and Spectrogram 3D Limits (SPL+3DL); you may enter 3DL in the filter input field instead to quickly find the template
Choose a name and click OK to create a new QC operation
Click Run
 to log in
See dB-Lab Software Manual for more information.
Performing a 3DL Test#
This section guides you through a first test using 3DL.
It is assumed that the hardware, routing and test setup is valid and that the basic stimulus (voltage, frequency range) and routing settings of the Sound Pressure (SPL Task) Task have been set up in a suitable way, previously. Refer to QC User Manual for more information.
First Test Run#
Make sure that 3DL – Spectrogram check box in properties parameter group Measurement is activated and run a measurement using the Start button in Control Panel.
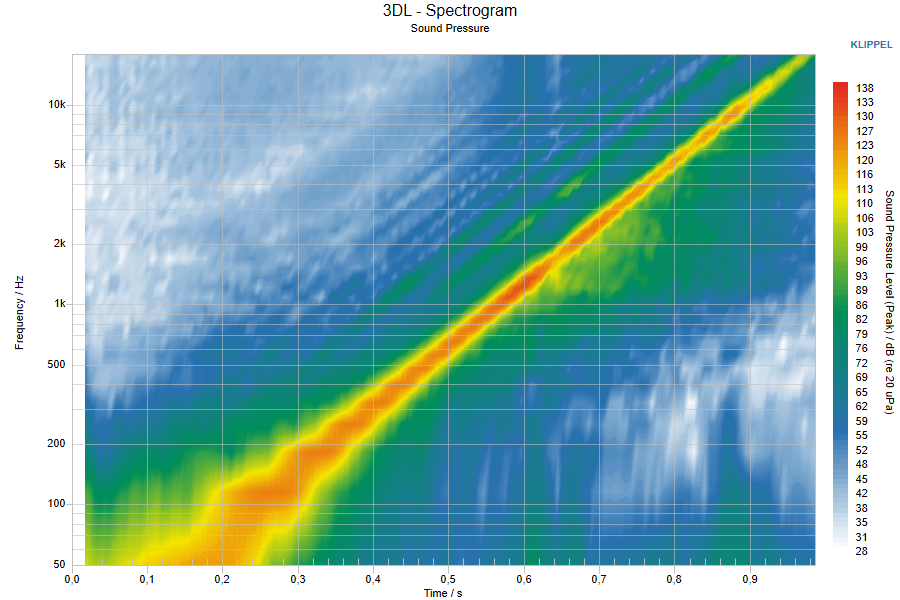
The chart 3DL – Spectrogram shows the main result plot of the 3DL. Refer to section 3DL – Spectrogram for more information.
Also check the 3DL- Spectrogram (Nosie) window in case Ambient Noise feature was activated. The sound pressure level should be significantly lower than in the main plot.
Note
All other 3DL plots show no results as long as no limit is defined.
Testing with Limits#
Since limits are required to generate result plots such as Exceedance, it is recommended to active Limit Calculation Mode in the property page tab Limits in order to generate a first set of limits to get an overview.
Navigate to parameter section 3DL - Spectrogram, where several limit calculation options are available.
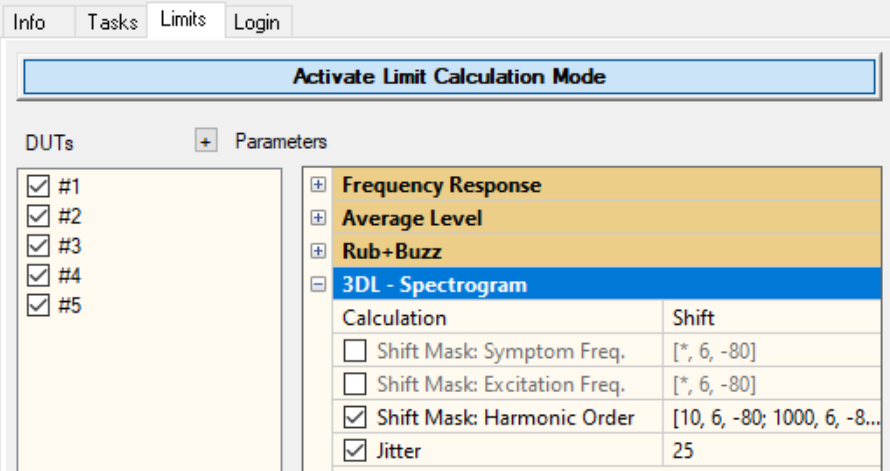
As a starting point, you may stick with the default settings: limits will be based on shifted maximum of the measured reference DUT pool above 10th harmonic order of the chirp signal.
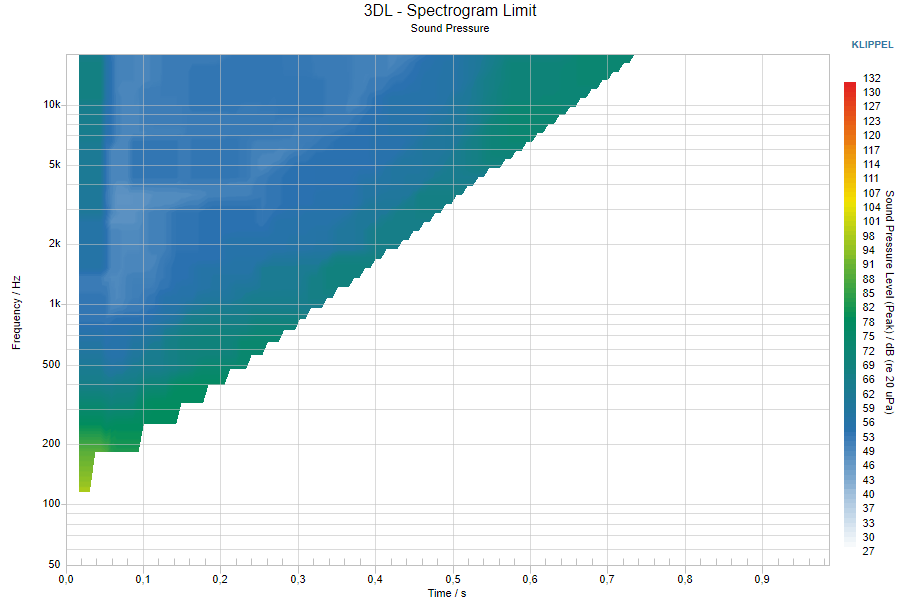
Measure at least one reference DUT and press Calculate or deactivate Limit Calculation Mode. The window 3DL – Spectrogram Limit should now contain limit data. If multiple reference DUT’s are measured, the overall pool’s peak value at each time-frequency point defines the reference level.
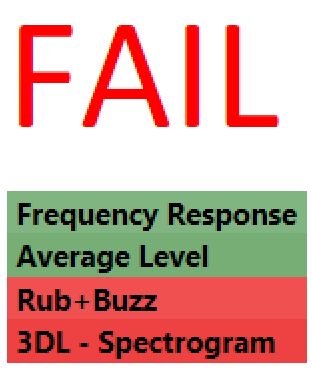
Once a 3DL limit is defined, all consecutive measurement will be checked against it. The verdict list in the Summary Window will indicate whether 3DL – Spectrogram has passed the test.
When testing an approved DUT which is consistent with the reference DUT’s, the overall verdict should be PASS and the 3DL – Exceedance will only show a green surface or a completely empty chart, depending on display settings. Both indicates no limit violation.
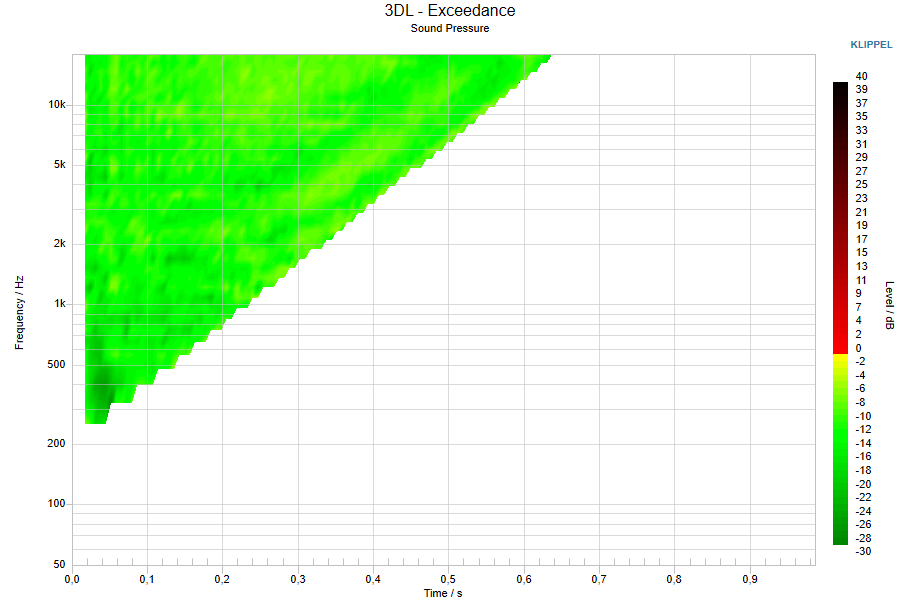
Refer to section Working with Limits for more information about testing with 3DL limits.
Viewing 3DL Results#
3DL – Spectrogram#
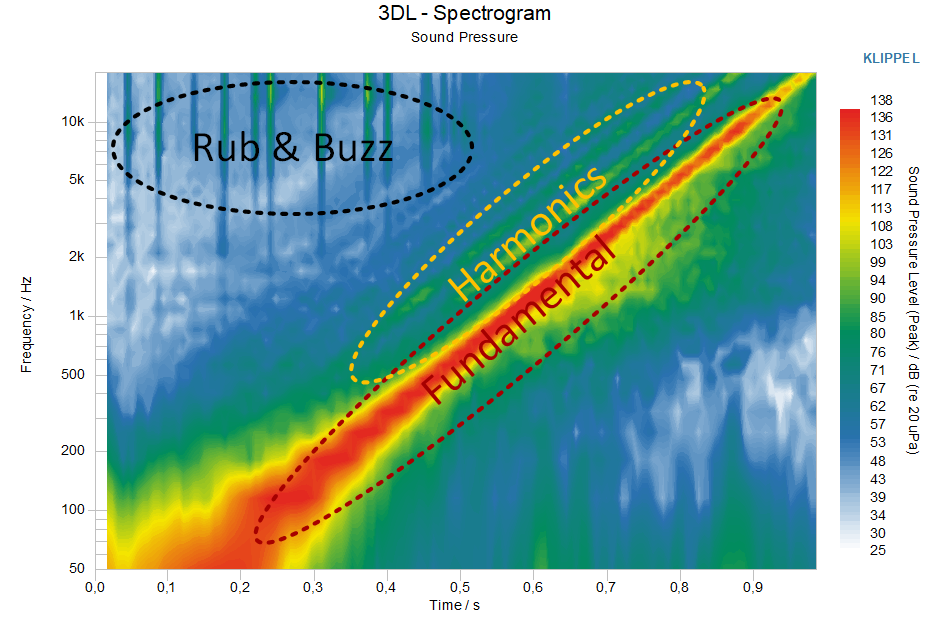
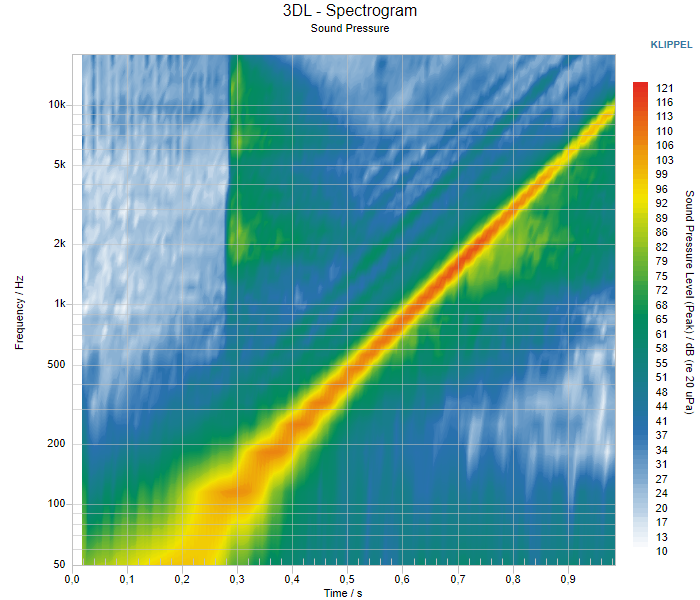
The 3DL -Spectrogram window contains the most important result graph that shows the measured peak sound pressure level (color scale) over time (x-axis; linked to excitation frequency) and spectral frequency (y-axis) of the Device Under Test (DUT) response to the chirp test signal.
In this example we can observe the fundamental response to the chirp signal as well the lower order harmonic distortion displayed as straight, parallel lines in the result plot. All other spectral components displayed, typically reflect abnormal sound and noise such as impulsive distortion as caused by defects (Rub&Buzz) or other disturbances.
The maximum value as well as the dynamic range of the colormap can be modified using the display parameters 3DL – Max. Value Spectrogram and 3DL – Dynamic Range Spectrogram. See section Display Properties for further information.
Note
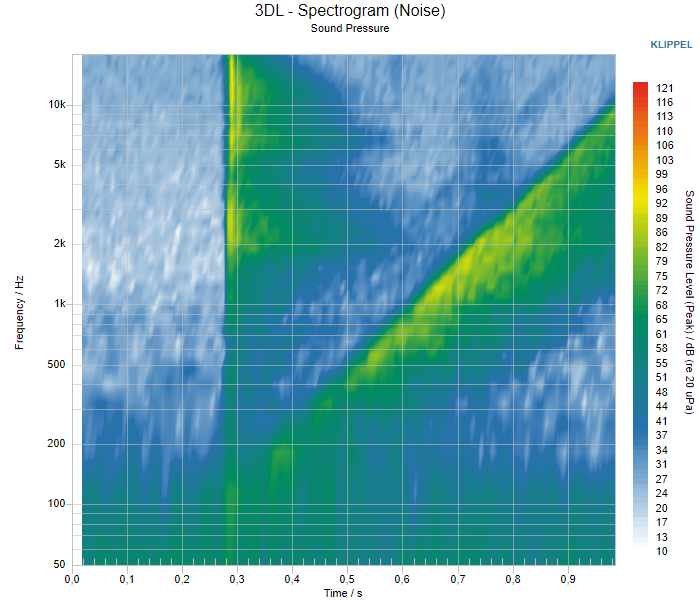
When Ambient Noise measurement is activated, an additional result window 3DL – Spectrogram (Noise) will be available that shows the equivalent result for the ambient noise microphone. Both plots use the same SPL Task scale range in order to ensure comparability.
3DL – Limit#
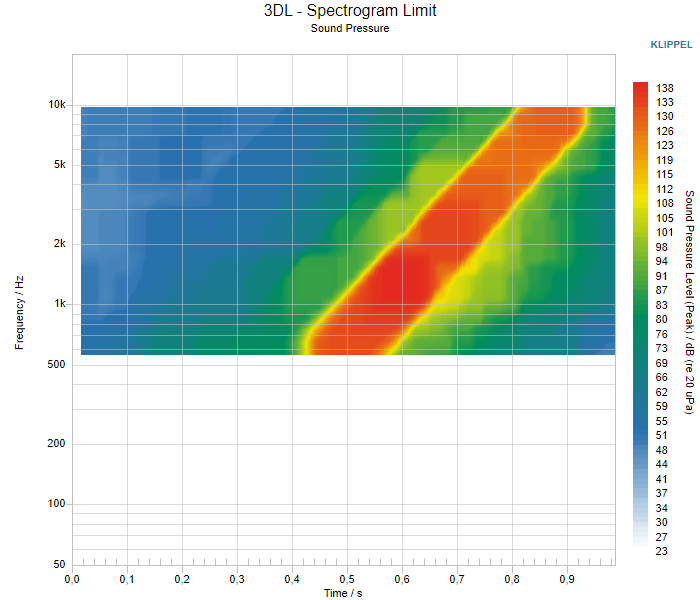
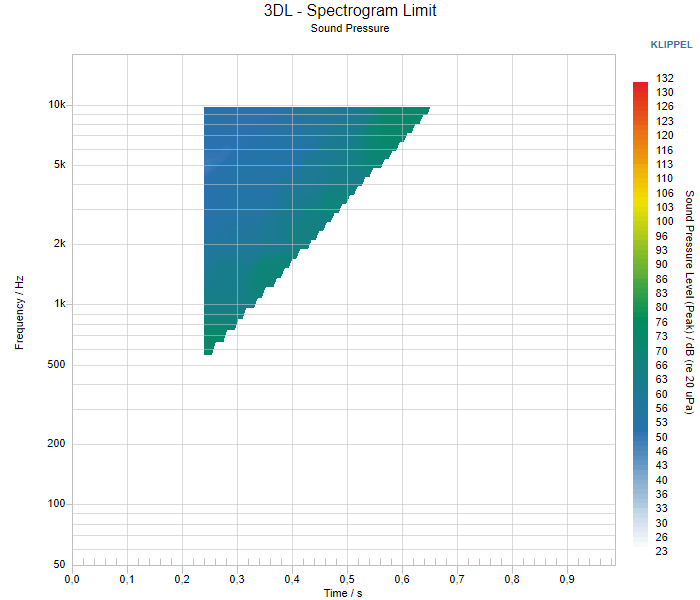
This chart is closely related to the 3DL - Spectrogram window but instead of the measured response, it shows th 3D Limit which is the maximum allowed level for a PASS test verdict.
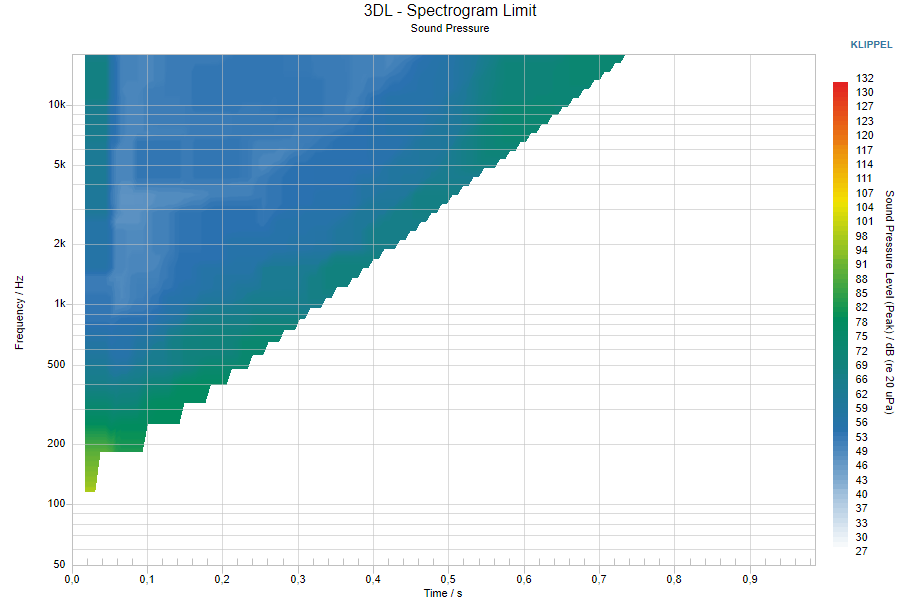
The limit is derived from the maximum level measured at each spectrogram point of all reference units in Limit Calculation Mode based on the corresponding calculation parameters. Typically, the limit does not cover the full spectrogram, but only frequency ranges where irregular defects symptoms are expected (e.g., \(>\) 10th harmonic of the chirp signal).
3DL – Exceedance#
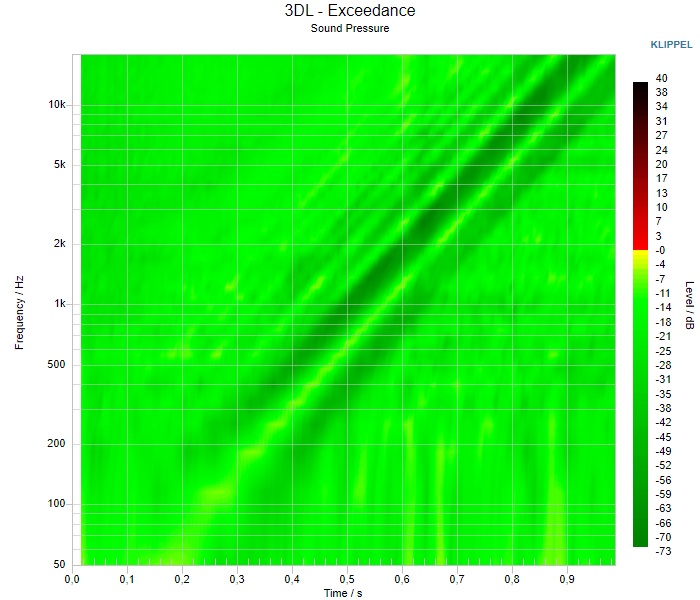
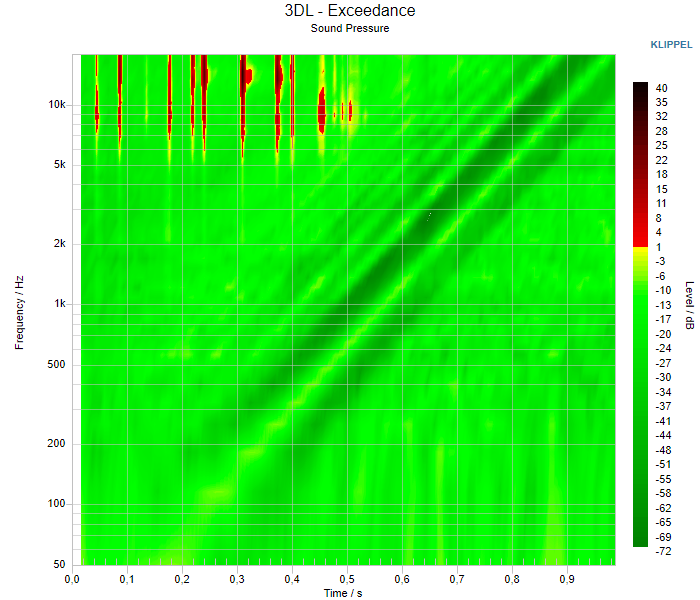
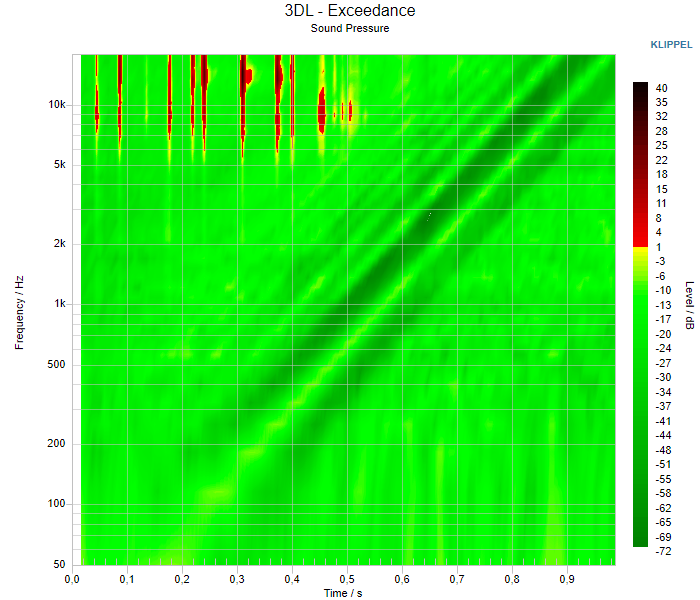
The data shown in 3DL – Exceedance plot is very important for quality control testing since it indicates critical deviation of the tested DUT’s response from the reference units that lead to limit violation. It is a result of both the 3DL - Spectrogram and the 3DL - Limit windows highlighting clearly where the limit was exceeded.
A positive exceedance means that the measured response exceeds the limit and is assigned with a FAIL verdict. On the contrary, a negative exceedance yields a PASS verdict since the measured response is below the limit level for all time points and frequencies. With default display settings, the plot stays empty in this case. However, the display floor value can be adjusted using the parameter 3DL – Minimal Value Exceedance in order to indicate the limit headroom.
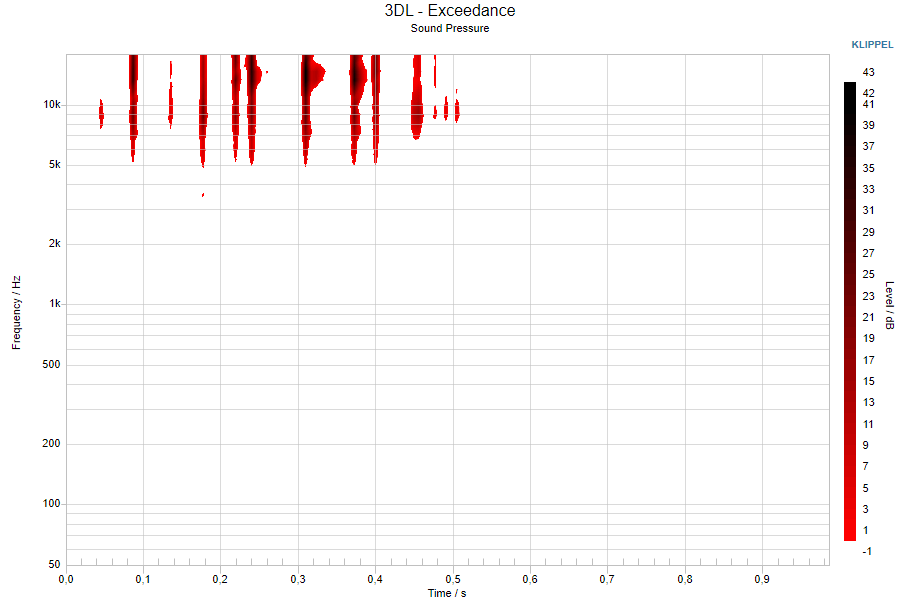
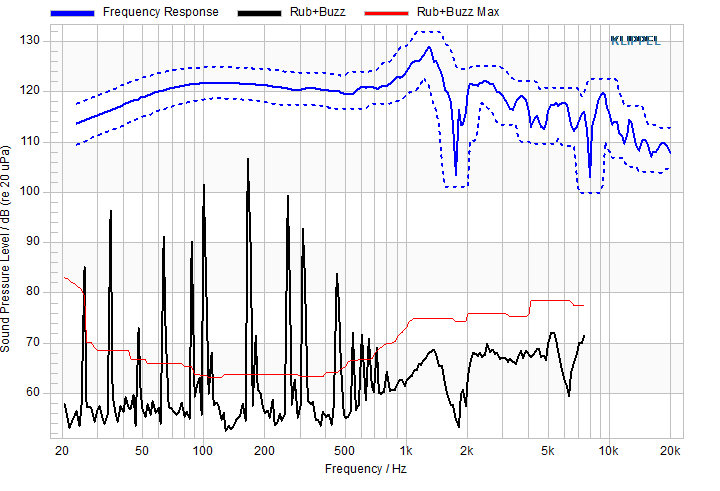
In this example we observed a positive exceedance caused by a loose particle defect resulting in impulsive distortion at high frequencies which is detected by both Rub&Buzz and 3DL Spectrogram result.
The traditional Rub&Buzz measurement analyses the high-pass filtered response peak level in time domain plotted over excitation frequency. The 3DL Spectrogram in contrast provides more detailed diagnostic information since it indicates both the temporal and spectral pattern of the defect. For more information regarding the Rub&Buzz measurement, please refer to QC User Manual.
Note
In many cases Rub&Buzz plot is very similar to the 3DL - Excitation Projection plot as explained in the next section.
3DL – Projections#
Although the 3DL- Spectrogram and Exceedance plots provide an intuitive and colorful overview over the spectral and temporal patterns of any kind of distortion, the full complexity is not always required. Also, reading exact frequency values is rather difficult.
For this reason, the so called 2D projections are derived from the 3DL – Exceedance plot. Two projections are available: one mapped over the stimulus frequency (Excitation Projection) and one over symptom frequency (Spectral Projection).
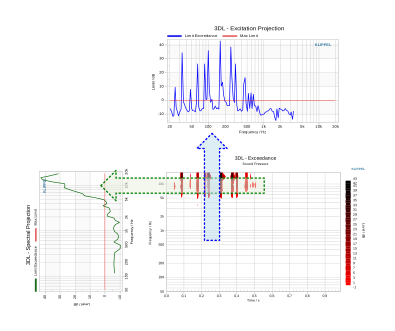
As shown in the example above, the projections can be regarded as the shadows of the 3DL - Exceedance cast over the two available axes.
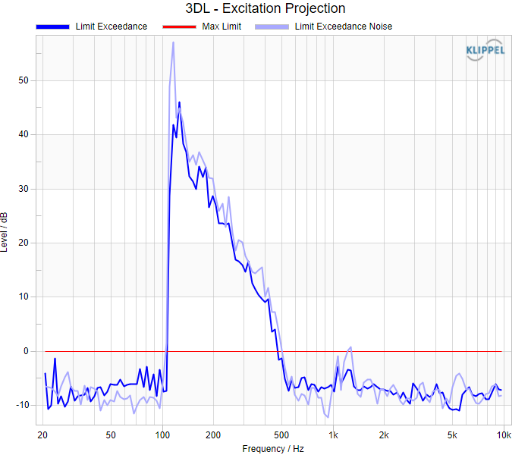
Since the Excitation Projection maps the exceedance over the excitation frequency of the chirp signal, it can be used to identify the most critical frequencies that trigger the defects. The curve shape is roughly comparable to the (relative) Rub&Buzz curve, depending on the limit setting.
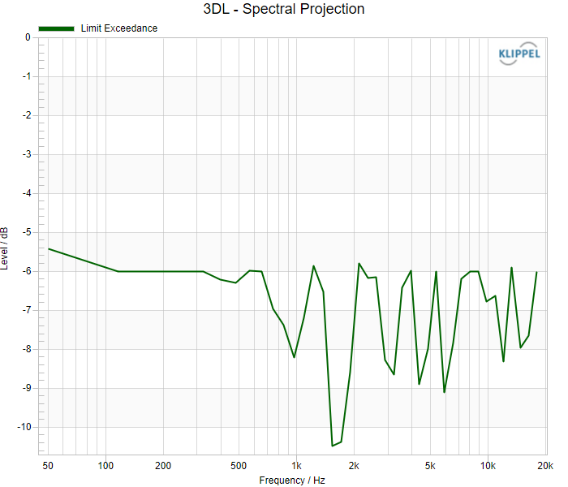
The Spectral Projection on the other hand provides valuable diagnostic information since it reflects the dominant frequency content of the defect distortion. Therefore, it can be used to classify the defect root cause, adjust the 3DL limit frequency range or even for optimizing the Rub&Buzz band-pass filter settings.
Working with Limits#
Limit Setup#
As mentioned in section Testing with Limits, various limit calculation parameters are available to define absolute 3D limits or to derive shifted limits from the reference DUT pool.
This chapter will mainly focus on quick limit setup for comparing interpreting the 3DL results for PASS and a FAIL measurement.
Information about working with the different limit parameters is given in detail in section Limit Properties.
Find more general information about working with limits in QC User Manual section Limit Calculation.
3DL – Limit#
The 3DL – Limit shows the maximum tolerated spectrogram level for passing the test. In case of shifted limits, the overall peak level of the reference DUT pool at each time-frequency point will be used as the shift reference. Therefore, carefully select you reference units and deactivate/remove corrupted measurements to ensure reasonable limits.
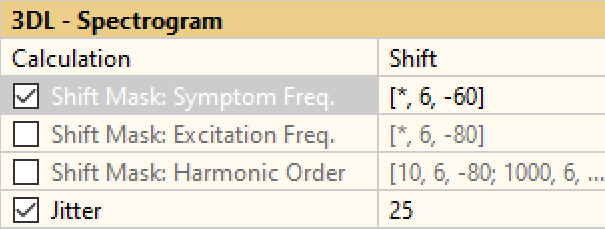
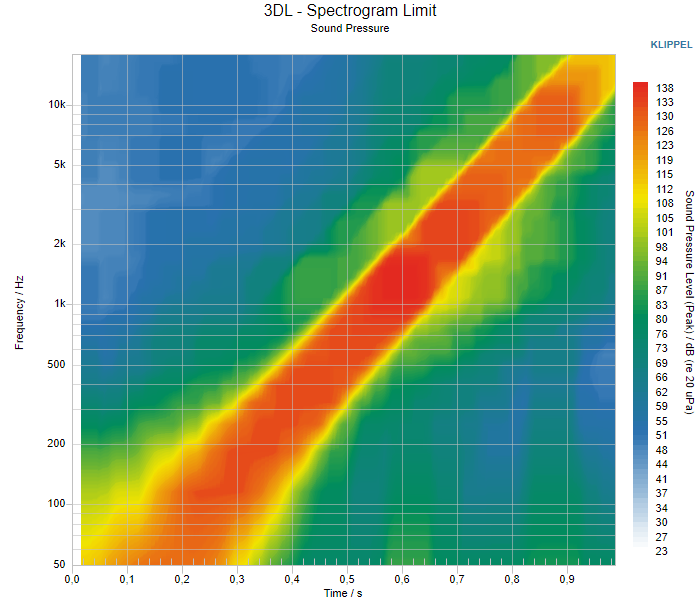
According to the settings section (3DL – Spectrogram of Limit Mode) in this example, a plain 6 dB shift was applied to the reference pool. It is combined with a limit floor of -60 dB relative to the measured Average Level to reduce sensitivity at reference points that are mainly dominated by noise.
The additional Jitter is important to ensure a smooth and robust limit by widening the limit around local peaks and dips, such as the fundamental (red area) in the example below.
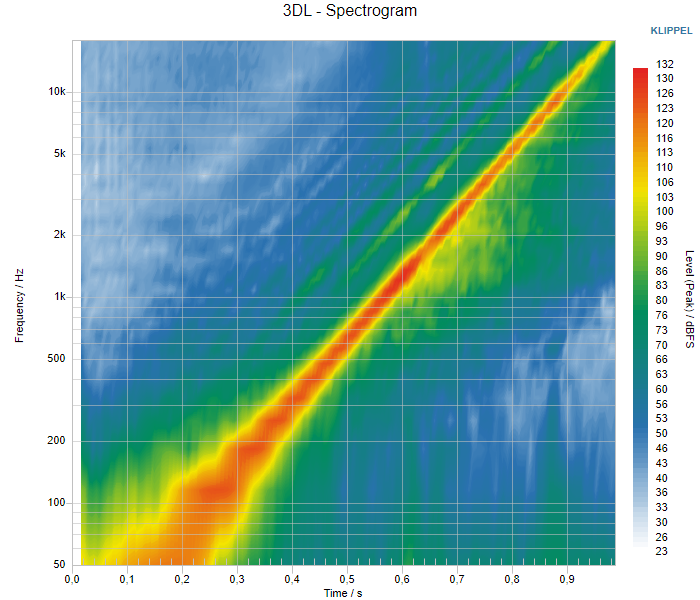
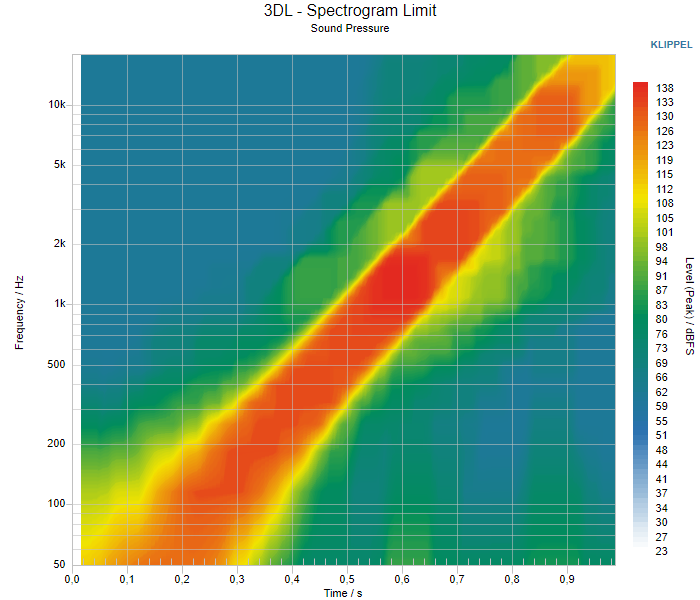
Note
In most cases it is recommended to exclude the fundamental and the lower order harmonics from the 3DL – Limit using Harmonic Order limit definition. since these parts of the response can be tested through dedicated Frequency Response and THD/Harmonics measurement in a more convenient and reliable way.
3DL – Spectrogram#
Comparing the time-frequency plot of a passed and a failed measurement indicates the temporal and spectral characteristics of the total responses in an intuitive way without losing information.
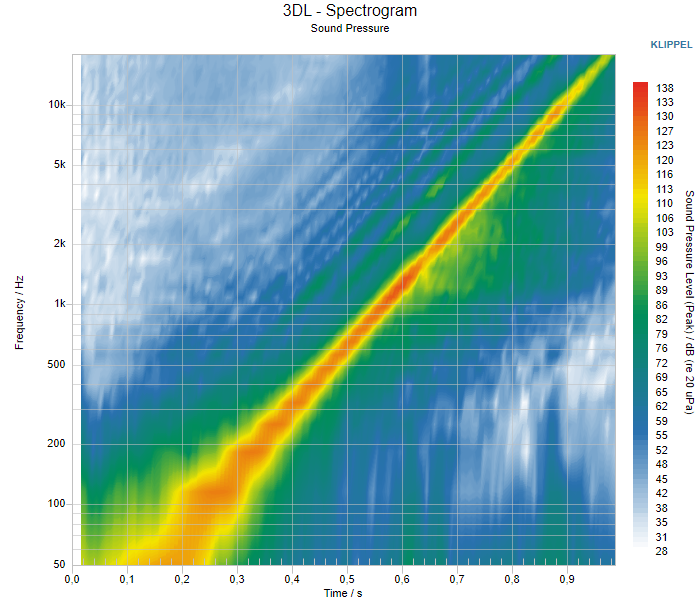
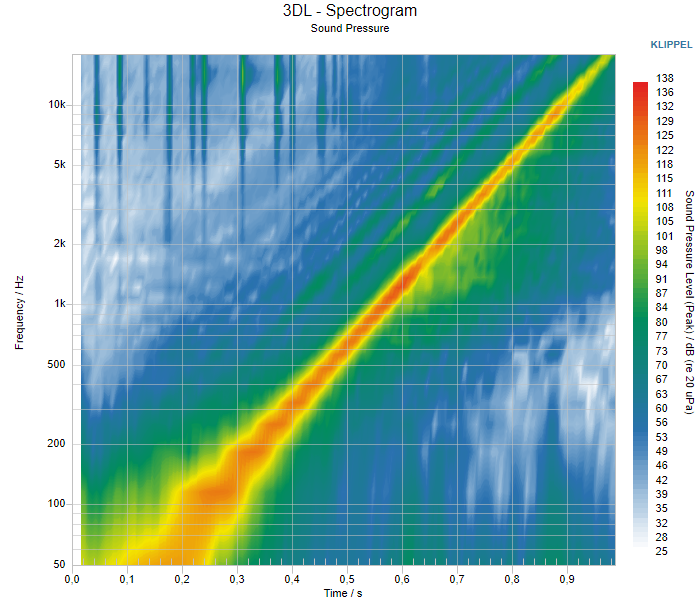
However, since the fundamental response and the regular low order harmonics dominate the plots in both cases and no limit information is given, it is difficult to identify differences between good and bad DUT responses.
Therefore, it is more critical and relevant to evaluate the difference to the reference DUT pool by the Limit Exceedance and the resulting projections in order to focus on defect symptoms and their relevance as shown in the following sections.
Note
The maximum display range of the color map is defined by the limit to ensure comparable scales in all spectrogram plots.
3DL – Exceedance#
The Exceedance indicates the difference between measured spectrogram and the limit. If all data points are below 0 dB (green-yellow color range) the limit is not violated and the test verdict is PASS. In case of a failed measurement, all data points above 0 dB are displayed with a red to black color map according to amount of exceedance.
Note
Whether the green range is displayed or not depends on the chart floor setting defined by display parameter 3DL – Minimal Value Exceedance.
3DL - Spectral Projection#
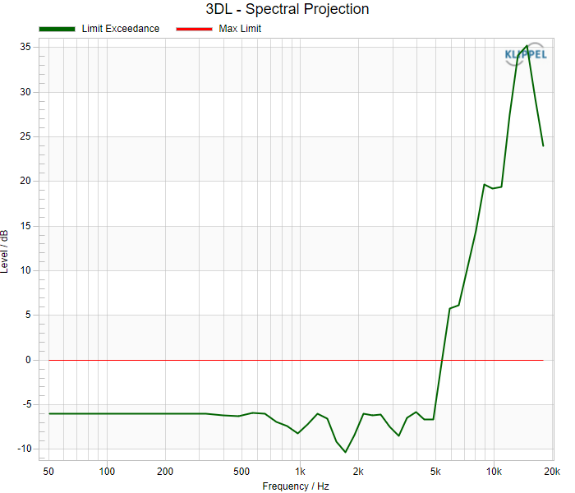
The Spectral Projection is 2D graph indicating the maximum value of the 3DL – Exceedance plot along the symptom frequency (spectrogram \(y\)-axis). Since this parameter is based on the relative exceedance, the limit is always at 0 dB for all frequencies.
The test is passed when the complete curve is blow 0 dB. In the FAIL example, the spectral projection exceeds the limit above 5 kHz by more than 30 dB which indicates that the measured defect is both significant and mainly contains high frequencies which is typical for loose particles and Rub&Buzz defects.
3DL – Excitation Projection#
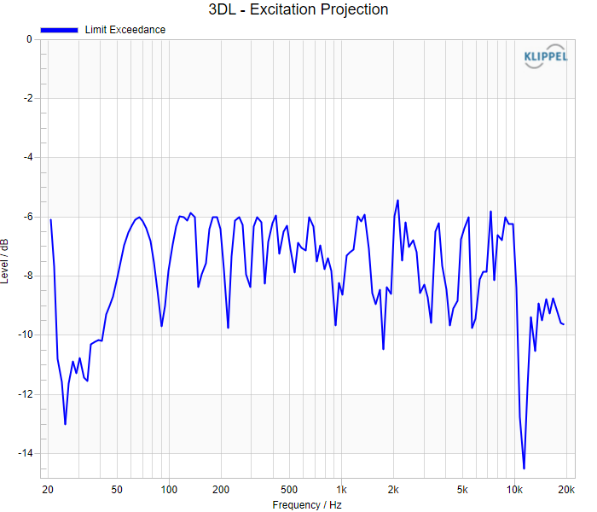
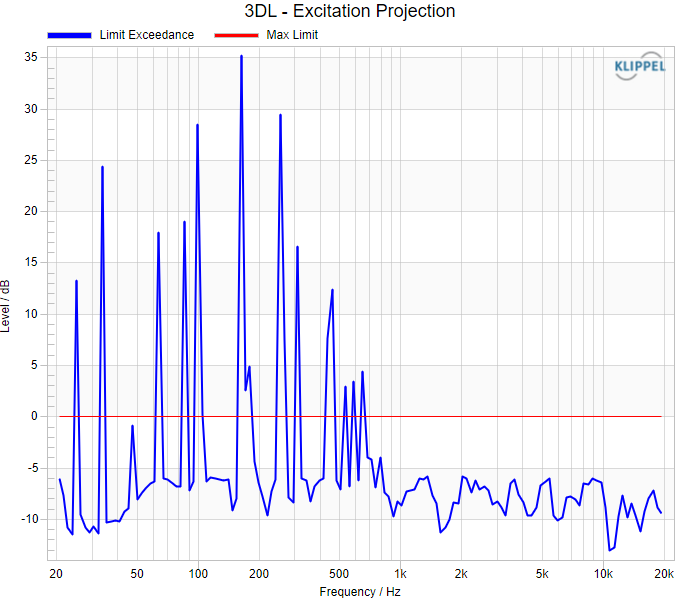
Observing the same result data in the Excitation Projection can provide valuable information about the root cause of the potential defect as this 2D graph shows the maximum value of the 3DL – Exceedance plot along the excitation frequency (spectrogram x-axis).
Again, a passed unit will result in a curve below the 0 dB limit for all frequencies. The failed measurement in this example shows a rather random and impulsive pattern at low stimulus frequencies where transducer displacement is high. This indicates that this is probably a loose particle or a similar defect.
Ambient Noise Handling#
The Sound Pressure (SPL Task) Task is designed to be operated with an additional ambient noise microphone in order to prevent false rejects caused by external noise disturbance such as production machine noise. This also applies for the 3DL extension which supports both standard noise detection as well as advanced ambient noise handling provided by the Production Noise Immunity (PNI) add-on.
Ambient Noise Detection#
With a QC Standard or Stand-alone base license (required to operate 3DL), the ambient noise detection feature is also included. It only requires a dedicated ambient noise microphone with sufficient distance to the test fixture or on the outside of test box in addition to the dedicated test microphone(s) to get started.
Note
This section will only give a quick introduction into using ambient noise detection focusing on the particularities of 3DL. For detailed guideline about dealing with ambient noise and setting up the noise microphone, refer to Production Noise Detection.
Setup#
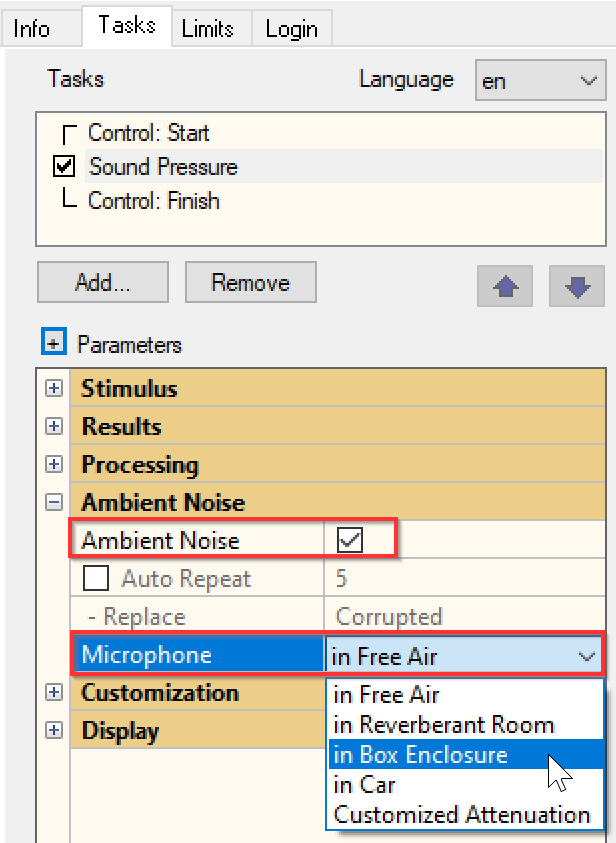
After having insured that the ambient noise microphone is set up, connected and calibrated correctly, you may start with activating the Ambient Noise in the SPL Task’s properties. Select a suitable microphone position (noise microphone!) such as in Box Enclosure or enter a Customized Box Attenuation for best performance.
Note
All reference DUT’s and limits will be discarded when activating Ambient Noise.
Also make sure to activate and display the dedicated Spectrogram (Noise) window.

At least during setup phase, it is recommended to activate Show Noise in Parameter category Display to make sure that all curves based on the noise microphone are displayed. Otherwise, they are hidden and can be shown via the context menu of each result window anytime.
Now run a first test and compare both microphone’s responses in the two available spectrogram windows. Since the both use the same color map scale, the levels are directly comparable. The noise channel SPL should be significantly lower at all frequencies, particularly at those which are dominated by the chirp response
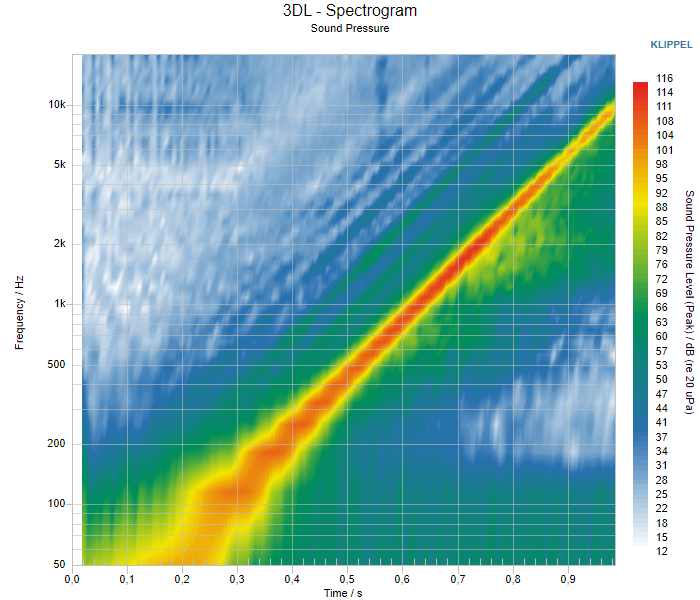
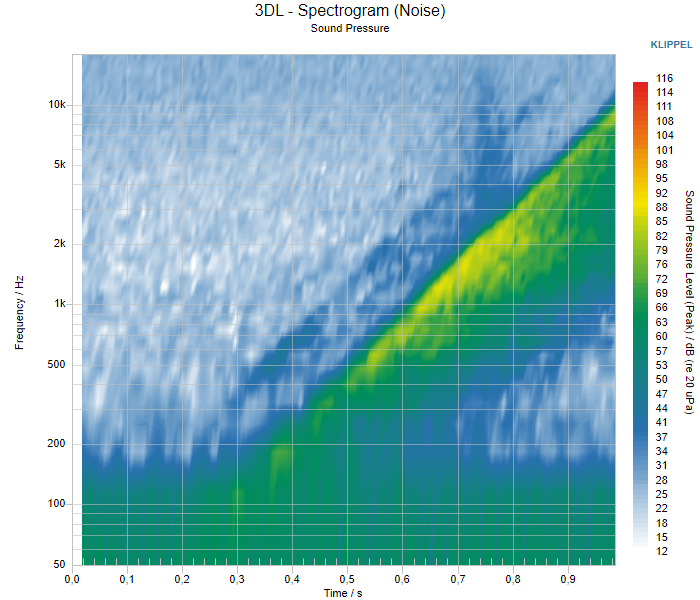
Since the ambient noise detection completely relies on test limits based on undisturbed reference DUT’s, the feature will not be active unless limits are available. Therefore, make sure to set up new limits considering the ambient noise channel according to section Testing with Limits.
Note
When ambient noise measurement is active, shifted 3DL limits will be based on the global peak level of either the test mic channel or the predicted noise at the test mic position (considering the box attenuation), depending on which level is higher at the particular time-frequency point. Therefore, make sure to use a properly sealed test enclosure and enter Customized Attenuation curve accordingly when testing in a loud environment. Otherwise, the test sensitivity may be impaired due to more tolerant limits.
Operation#
Apart from the potential impact on limit setup, the ambient noise detection feature will have no impact on normal test operation when the test result is within pass range.
However, in case a 3DL Spectrogram test fails the limit (Exceedance \(>\) 0 dB) in the main test channel, the ambient noise check is triggered to identify whether the limit violation is caused by a potential noise disturbance. Since the same processing is performed for both test and noise channel, both results can be correlated (considering box attenuation) to answer this question.
The example below shows the results of a woofer tested in free air. The measurement was disturbed by an impulsive noise incidence as caused by a tool dropped on the floor. The impulse is visible in both spectrograms and the limit violation is indicated clearly in the exceedance plot.
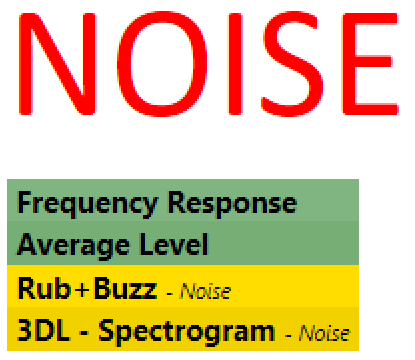
The NOISE verdicts clearly indicate that this test is invalid and shall be repeated.
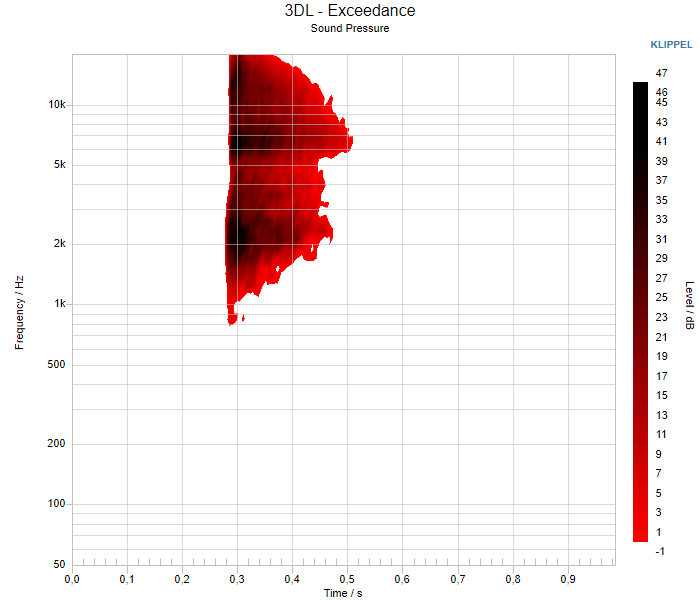
The actual noise detection is based on the Excitation Projection curves of the Exceedance as shown below. Here, the test mic and noise curve can be monitored and compared. There is no doubt that the limit violation in both channels was caused by the same event.
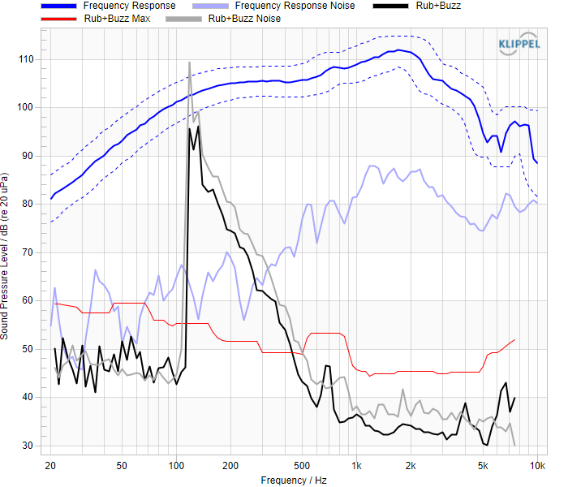
The course if the conventional Rub+Buzz plots displayed to the right corelate very well with the 3DL Excitation Projections for both test and noise channel.
Production Noise Immunity (PNI add-on)#
The Production Noise Immunity (PNI) is another licensed add-on for the SPL Task that enhances the standard Ambient Nosie Detection feature with a smart auto-repeat and merging algorithm for time-efficient testing in noisy environments.
Refer to PNI Manual for detailed information about how to setup and use the PNI feature.
PNI is activated as soon as the Auto Repeat option in SPL Task properties category Ambient Noise is enabled.
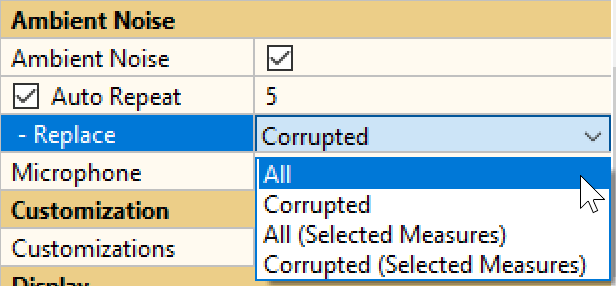
This means that the test step is repeated automatically if a noise disturbance was detected. The maximum number of allowed loops before a test is aborted with NOISE verdict is specified here as well.
Note
The key feature of the PNI is the merging of valid (undisturbed) parts of the chirp measurement using Replace – Corrupted mode. This allows to obtain a valid test even under harsh conditions with constantly present disturbance. However, when 3DL is activated only Replace – All mode can be used. Due to the complexity of the Spectrogram, the merging algorithm would cause unwanted cause artifacts and glitches in the data. Therefore, the full signal must be discarded on repeat.
Detailed Analysis Using Time-Frequency Analysis (TFA) Module#
The Time Frequency Analysis (TFA) is a general-purpose off-line diagnostics tool for impulse responses and any other waveform generated by the KLIPPEL Analyzer System or provided as a wave file.
In addition to conventional STFT and Wavelet Transform analysis, it provides the same auditory filter bank processing as the 3DL, but enhanced with further result plots and a powerful auralization feature. The waveform can be band-pass filtered and slowed down for in-depth diagnostics and root cause analysis of failed DUT responses. Also, this can help to optimally adjust the band-pass filter setting of the Rub&Buzz analysis in SPL (see Optimize Rub&Buzz Detection).
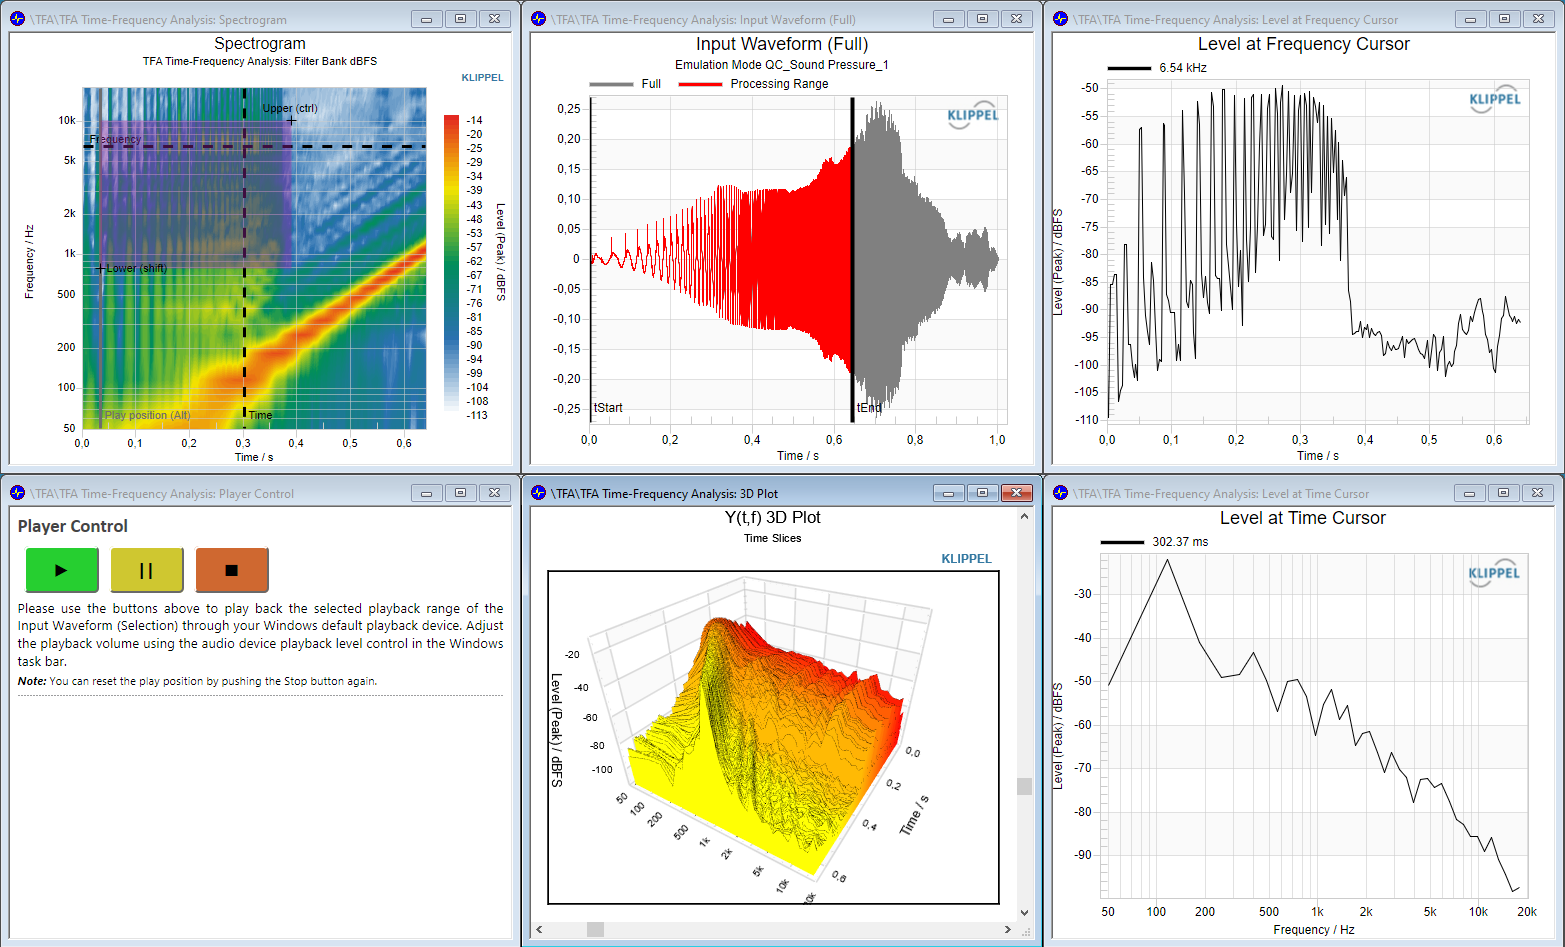
The most straight-forward way for off-line analysis of test data generated by the SPL Task is by using the Save Input Signals data logging feature that can be activated in Control:Finish.
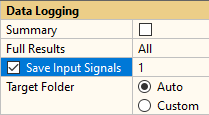
This allows exporting the measured microphone signals as well as the filtered Rub&Buzz signal to standard wave files to the specified data logging folder
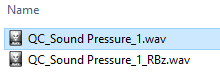
Refer to Storing Results for more information. These exported wave files can be directly loaded by the TFA.
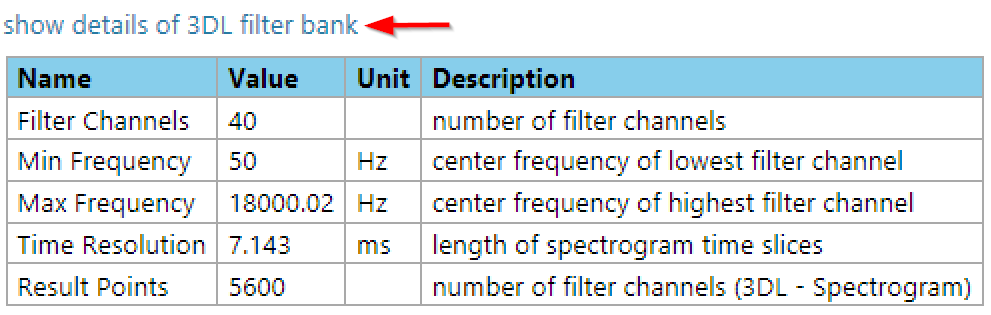
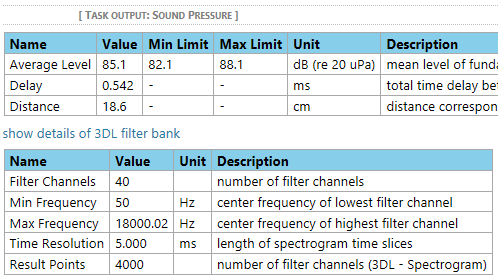
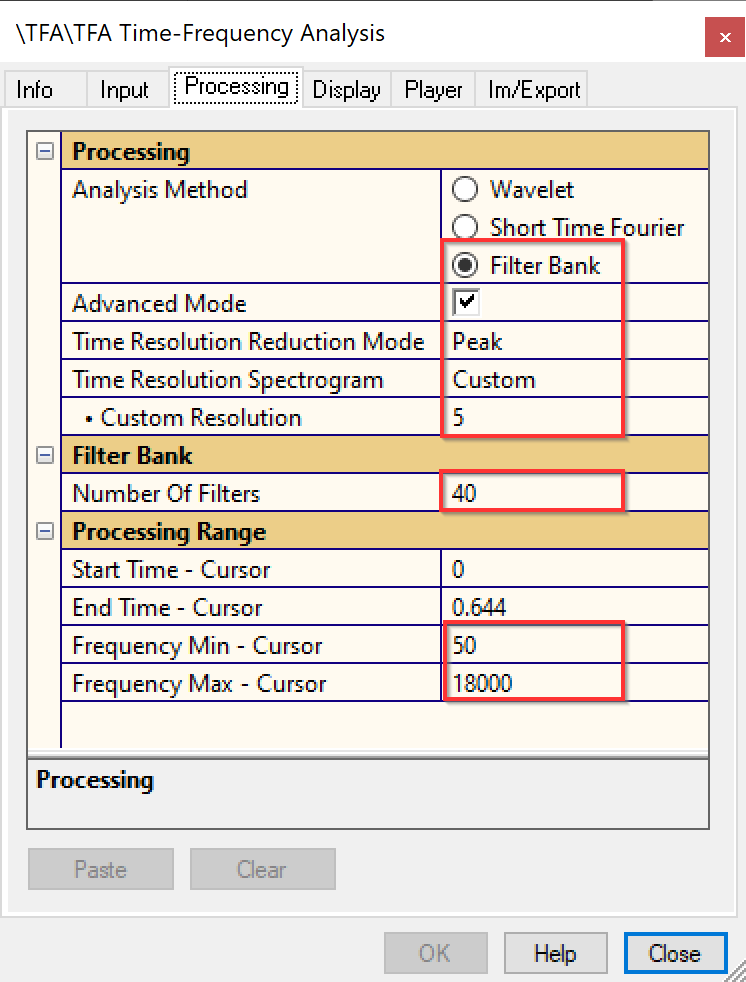
For best compatibility, use the TFA operation template 3DL compatibility which is provided with your dB-Lab. However, you can also adopt the 3DL filter bank setup from the QC Summary window available via the show details of 3DL filter bank link.
For more information about operating the TFA refer to TFA User Manual.
3DL - Reference#
Display Properties#
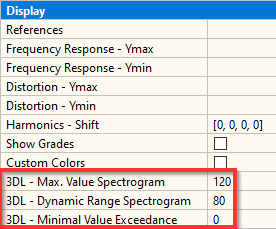
Apart from limit setup, the 3DL does not provide any processing parameters since default or automatic settings are used. However, there are properties for customizing the result plots located in the Display properties of the SPL Task.
Note
The listed properties are no private task parameter, currently. If multiple SPL Tasks are present in the test sequence, the setting of the first task will be used as global value in all spectrogram charts.
3DL – Max. Value Spectrogram#
Description#
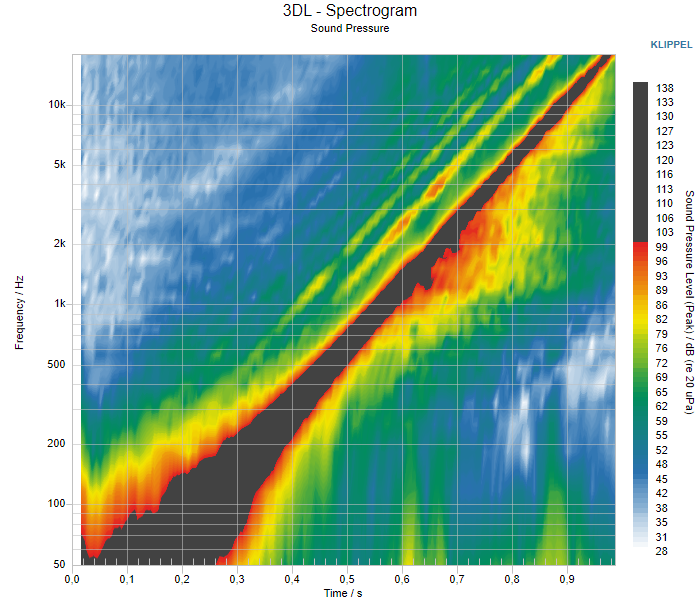
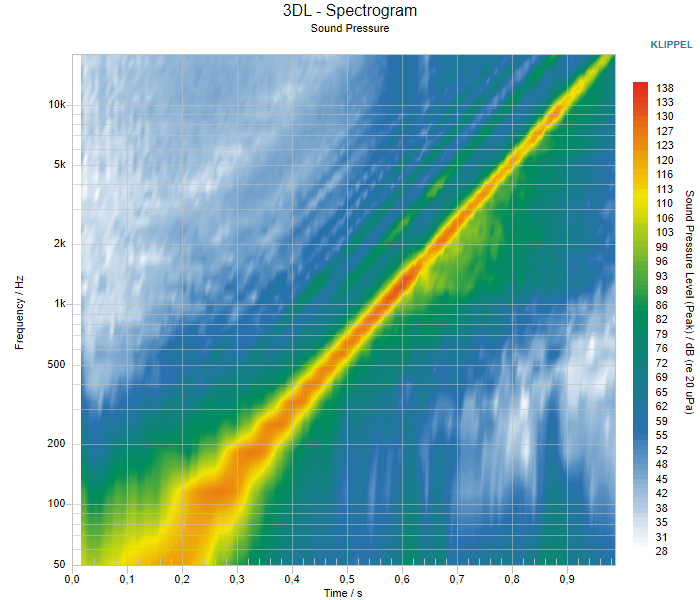
This parameter defines the maximum level of the colormap in both 3DL – Spectrogram and 3DL – Limit charts. Spectrogram values that exceed this value are highlighted in black color. If left empty, the global peak level of both charts is used (default).
Example#
3DL – Dynamic Range Spectrogram#
Description#
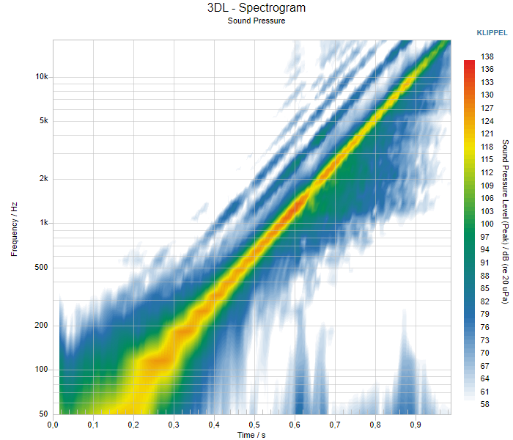
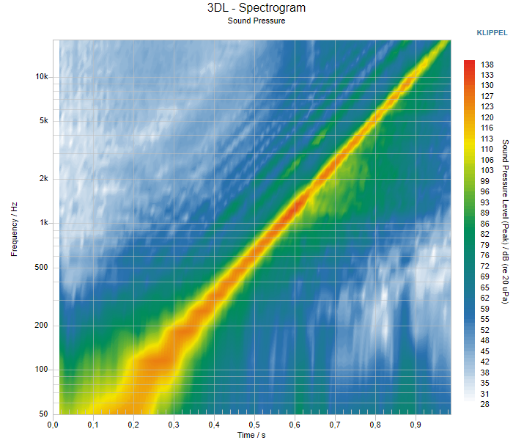
This property affects the displayed range of the color maps in 3DL – Spectrogram and 3DL – Limit charts. Depending on the setting of Max. Value Spectrogram the upper range limit will be defined by the global peak level or the entered level, respectively while the lower range limit is defined by the entered dynamic range relative to this peak level. Data points below this threshold will not be displayed.
The full range of the spectrogram is shown if this parameter is left empty (default).
Example#
3DL – Minimal Value Exceedance#
Description#
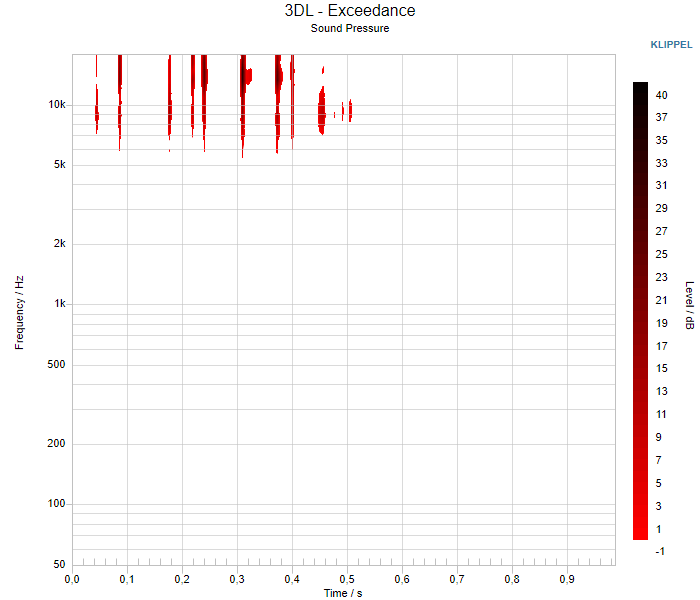
This numeric parameter defines the floor of the chart 3DL – Exceedance. Since this chart is normalized to the measurement limit, a pass verdict is obtained if no positive exceedance is produced. Therefore, only the time-frequency points above the limit are shown if the 3DL – Minimal Value Exceedance is 0. If this parameter is empty, the whole contour plot is shown, independently of the difference between measured spectrogram and limit.
Example#
Limit Properties#
Limits can be configured based on a single or a combination of multiple parameters. The limit parameters are accessible in the Limit Calculation Mode accessible in Limit tab of the Property Page. Select and expand category 3DL- Spectrogram to access them. Since the Spectrogram is a 3D plot, it provides two different axes (symptom and excitation frequency) to define limit range.
As an alternative, limits can be defined in terms of harmonic order relative to excitation frequency of the chirp signal. This method is the most suitable option in most cases because it helps to focus on frequency ranges where defect symptoms are located (e.g. impulsive, high-order distortion) while neglecting the fundamental response to the chirp signal. However, all three definition methods can be used in conjunction.
Different limit calculation methods are available:
- Shift
Shift limit calculated by adding the shift to the max. value of all active reference DUT’s
- Absolute
Absolute: custom, user-defined limits
- Absolute + Shift
Absolute + Shift: combination of absolute and shift limits
Shifted limits are preferrable in most cases since they consider the actual response levels of the reference DUT’s.
For further details on limit calculation methods, import of reference DUT’s and control rules, please see the Limit Calculation.
Note
The Spectrogram Limit is an intersection of all limit parameters in combination. The highest resulting limit level (z-axis) at each point will prevail.
Shifted Limits#
In most cases, shifted (relative) limits are preferrable since the limits are simply derived from the reference DUT responses by applying a certain tolerance to every measured data point. An additional benefit is that those relative limits allow Limit Calibration based on the Golden DUT to account for systematic changes in the test setup or environment (temperature, humidity). See Golden Unit Handling for more information.
Note
All shift masks provide an optional Floor which is defined relative to the Average Level. When used, Average Level measurement must be activated in Result properties.
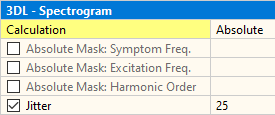
In addition, limits can be widened around local peaks and dips in the spectrogram using the Jitter parameter to yield smoother and more robust limits. It is recommended to stick with the default settings.
Shift Masks#
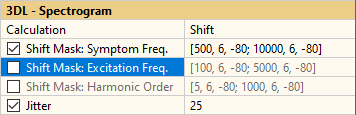
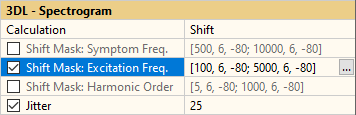
Shift masks can either be defined for the full available spectrogram using a simple one -line definition (frequency \(= *\)) or restricted in terms of excitation and symptom frequency or harmonic order, respectively.
- Symptom Frequency
Format :
[Frequency, Level, Floor][f1 L1 fl1; f2 L2 fl2; ... fN LN flN];
- Excitation Frequency
Format :
[Frequency, Level, Floor][f1 L1 fl1; f2 L2 fl2; ... fM LM flM];
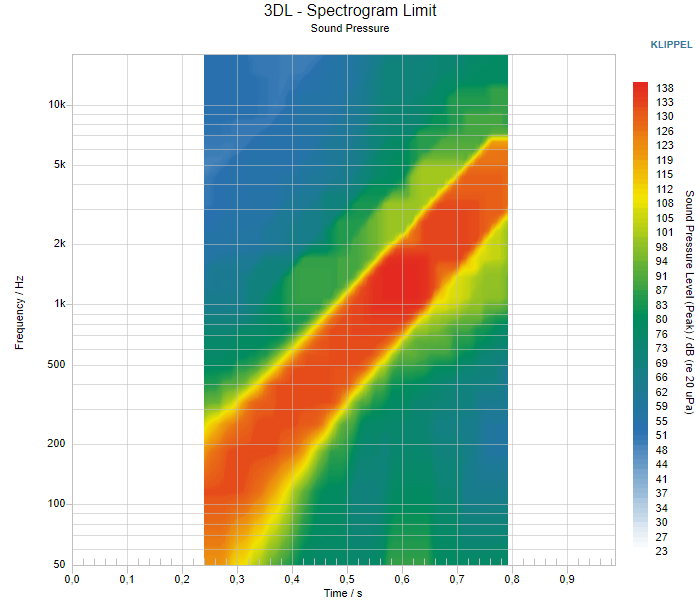
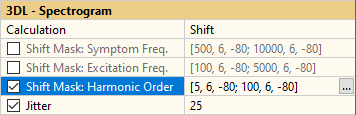
- Harmonic Order
Format :
[Harm. order, Level, Floor][n1 L1 fl1; n2 L2 fl1; ... nM LM flM];
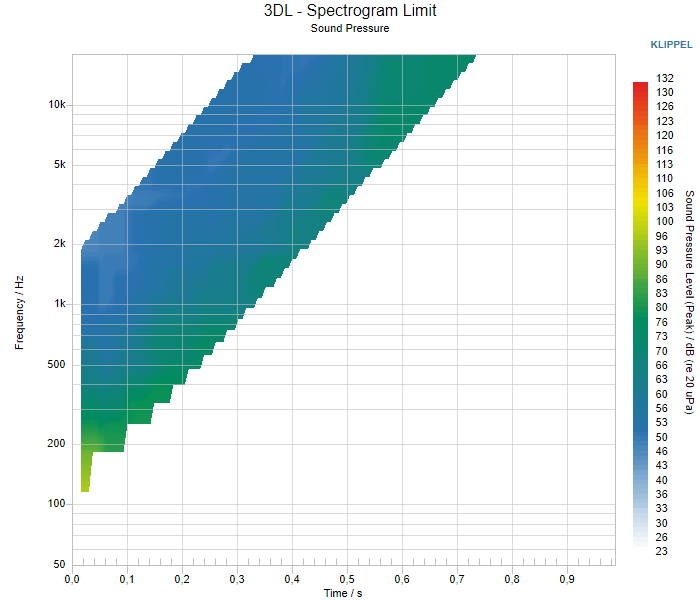
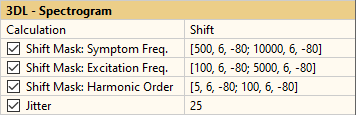
- Limit Intersection
multiple shift masks active
Limit Floor#
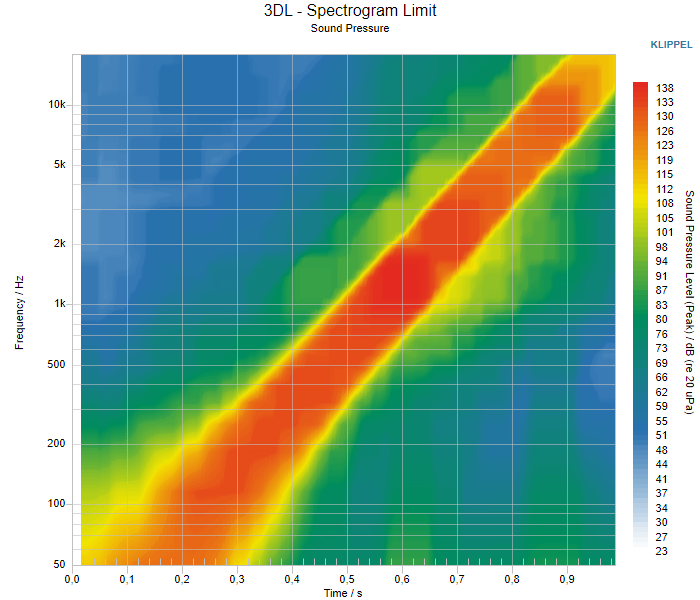
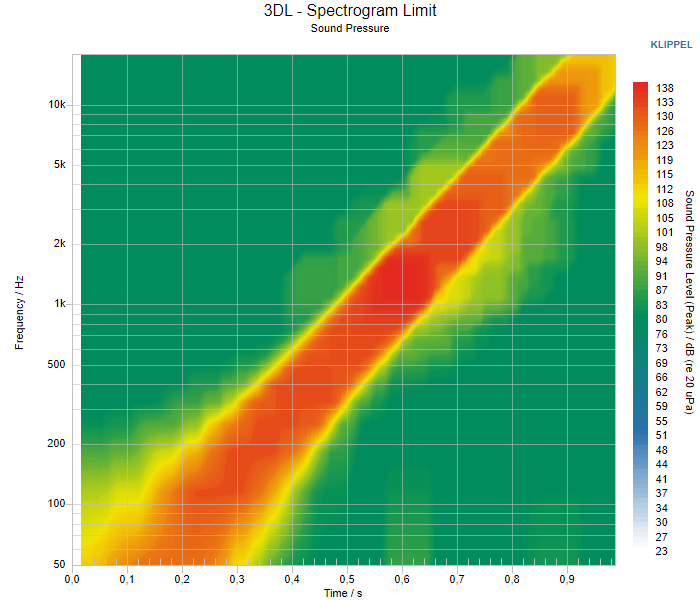
As mentioned before, the Limit Floor allows defining a minimum threshold for the 3D limit based on the Average Level of the fundamental frequency response which is roughly at 120 dB SPL in the example below.
If no floor is specified, all spectrogram data points will be shifted by 6 dB (left hand side). On the right side however, the limit floor at – 40 dB results in an effective lower limit of 80 dB SPL at most parts of the spectrogram which makes is less susceptible to minor variation of noise-dominated parts, but also less sensitive towards defect symptoms.
No Limit Floor:

Limit Floor = -40 dB:

Jitter#
Using Jitter feature is important to be tolerant for small temporal and frequency-wise variations among multiple measurements and DUT’s. This is especially useful for areas where SPL is low and mostly dominated by noise.
As shown in the example below, the limit without jitter strictly follows the reference data while the limit using Jitter is much smoother and homogenous.
No Jitter:

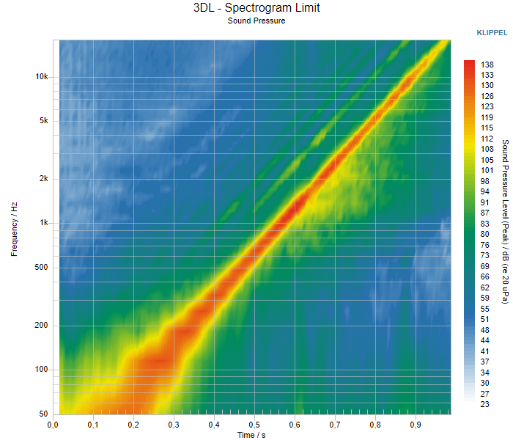
Jitter = 25%:

Absolute Limits#
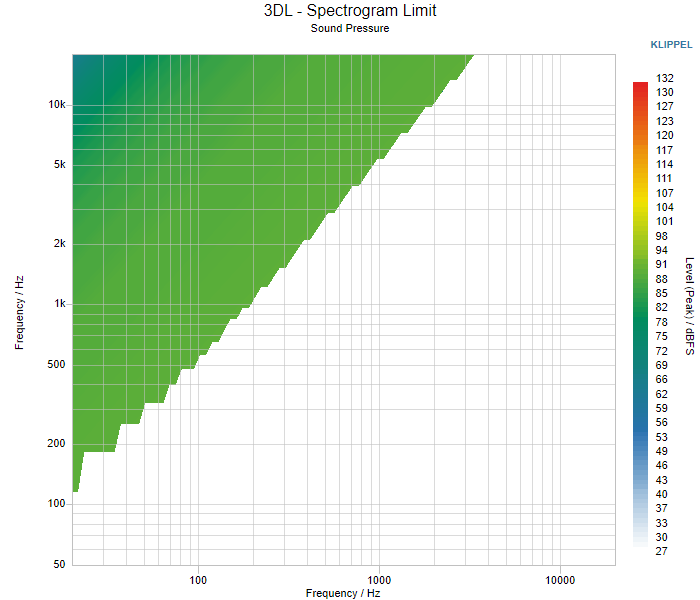
Absolute Limits are suitable when static limits are desired that do not depend on particular reference DUT responses.
However, the limits must be set up carefully for stable testing with meaningful verdicts.
Note
Limit Calibration is not available when using absolute limits case and Ambient Noise detection may be impaired if limits are not optimally set.
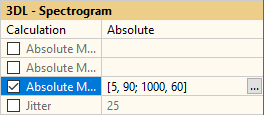
The available absolute limit definition masks correspond to the shift masks explained in Shifted Limits. The straight-forward way to define an absolute limit is by using Harmonic Order definition as shown in the example below. Here “ramp” limit is defined where the limit level decreases with rising harmonic order.
- Harmonic Order
Format:
[Harm. order, Level][n1 L1; n2 L2; ... nM LM];
Filter Bank Details#
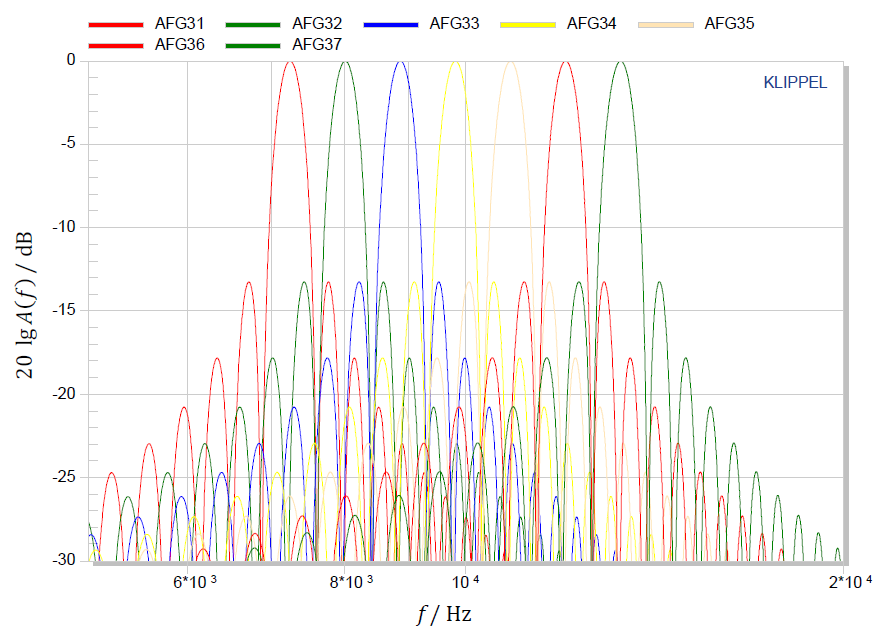
The auditory filter bank used by 3DL and TFA is based on ITU~R BS1387~1 recommendation. It consists of 40 auditory band-pass filters that are distributed on the Bark frequency scale between 50 Hz and 18 kHz with based on human auditory model.
The center frequencies \(f_{\text{c}}\) in Hz for each filter channel are listed in the following table.
\(\text{k}\) |
\(f_{\text{c}}\) |
|---|---|
0 |
50 |
1 |
116.19 |
2 |
183.57 |
3 |
252.82 |
4 |
324.64 |
5 |
399.79 |
6 |
479.01 |
7 |
563.11 |
8 |
652.97 |
9 |
749.48 |
10 |
853.65 |
11 |
966.52 |
12 |
1089.25 |
13 |
1223.1 |
14 |
1369.43 |
15 |
1529.73 |
16 |
1705.64 |
17 |
1898.96 |
18 |
2111.64 |
19 |
2345.88 |
20 |
2604.05 |
21 |
2888.79 |
22 |
3203.01 |
23 |
3549.9 |
24 |
3933.02 |
25 |
4356.27 |
26 |
4823.97 |
27 |
5340.88 |
28 |
5912.3 |
29 |
6544.03 |
30 |
7242.54 |
31 |
8014.95 |
32 |
8869.14 |
33 |
9813.82 |
34 |
10858.63 |
35 |
12014.24 |
36 |
13292.44 |
37 |
14706.26 |
38 |
16270.13 |
39 |
18000.02 |
Each filter provides a bandwidth of roughly 0.7 Bark. The plot below shows the transfer function magnitudes of a subset of filters and the filter bank response for a logarithmic sweep (chirp) signal without graphical interpolation to show the individual filter bank responses.
Although the output of each filter channel provides the full sample resolution of the input signal, the time-frequency plot is segmented in blocks to reduce data load. The default time resolution (block length) is 7.14 ms. In case of very long or short measurements the value is adjusted to provide sufficient resolution for very short tests as well as limits overall data size for very long measurements.
The block-wise data reduction is based on a peak detector in each filter channel time block in order to provide optimum sensitivity for detecting impulsive distortion as caused by Rub&Buzz defects. However, the total energy
The actually applied properties of the filter bank can be accessed in the Summary window using the link show details of 3DL filter bank.