
LST – Linear Suspension Test#
Overview#
The Linear Suspension Test (LST) is a software module and hardware accessory for the Klippel Analyzer System in the QC – Quality Control end-of-line testing framework. It is dedicated to the quality control of suspension parts (spiders, cones, domes, diaphragms) and passive radiators (drones) based on small signal measurements. The LST is the counterpart of the KLIPPEL R&D System module SPM Lite and MSPM Lite.
Linear mechanical parameters like resonance frequency, stiffness/compliance and Q factor (LST Lite) or relative mass and stiffness deviation (LST Pro) are determined from the displacement and microphone (optional) frequency response. The device under test (DUT) is stimulated by the sound pressure generated by a speaker in the test bench and the displacement response is measured by a cost-efficient laser displacement sensor.
Suspension parts are easily attached to the LST measurement bench without time consuming mounting effort by using a set of mounting parts (rings, cones) for any round DUT up to 222 mm diameter. Larger test objects may be tested with the SPM bench and custom clamping rings while small diaphragms may be tested with the MSPM Bench extension.
The fast-loading technique is designed to change DUTs as fast as possible while ensuring stable and robust measurement conditions. The efficient mounting and measurement times guarantee a short cycle time.
Quality control limits can be calculated based on reference units to provide PASS / FAIL verdicts.
Setting Up the Hardware#
Overview#
In this section step-by-step instructions are provided to set up the hardware for the Linear Suspension Test for the first time. Different suspension part test benches by Klippel may be used for LST testing. The setup of all compatible benches and the shared parts is explained separately.
The ring and cone set for clamping circular DUT is optional equipment and may be replaced by customized mounting parts. However, for standard spider or surround testing this set is recommended and will be included in the setup instructions.
Please find additional instructions for installing the QC software in the QC User Manual and general information about the analyzer hardware in the Hardware Manual.
The setup contains the following main components
Suspension part test bench
LST Bench with internal or external laser mounting or
MSPM extension or
SPM Bench
laser displacement sensor and controller (+ cables)
microphone (optional)
clamping parts (cones, rings) – optional equipment
analyzer hardware
Amplifier or Amplifier Card or QC Card for the KA3 hardware
Software
QC Basic or Standard version or
QC in R&D framework
Linear Suspension Test (LST) license (Lite or Pro)
List of Parts#
This section focuses on the parts provided by Klippel which are dedicated to the LST test. First, all shared and optional components are listed. The parts of the test benches are listed individually for each supported type and revision. Setup instructions can be found in the section Setting Up the Test Bench.
Laser Set IL-30/IL-65#
Item No. 2102-041 / 2102-042
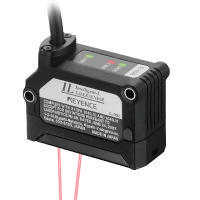
- L1 Laser sensor head Keyence IL-30 or IL-65
- Units: 1Dimensions: IL-65: 48.5 mm ; 42.8 mm ; 24.1 mm (WHD)
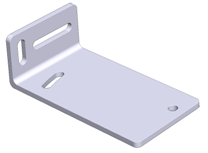
- L2 Laser protection plate
- Units: 1
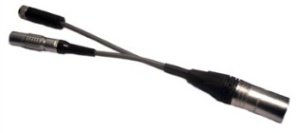
- L3 Adaptor cable for power supply of laser controller (Only required for Production Analyzer hardware)
- Units: 1
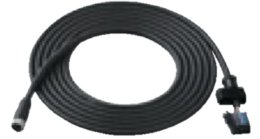
- L4 Connection cable for laser head
- Units: 1Dimensions: 2 m (OP-87056)
- L5 Laser controller Keyence IL-1000
- Units: 1Dimensions: 79.3 mm ; 37.4 mm ; 28.3 mm ; (WHD)
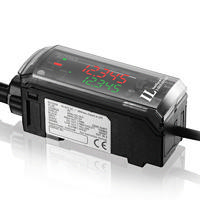
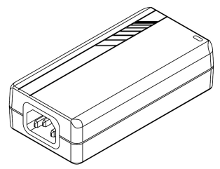
- L6 Power supply for laser sensor, incl. power cable (Only required for Production Analyzer hardware)
- Units: 1Dimensions: 119mm ; 32mm ; 60mm (WHD)
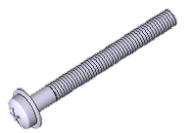
- L7 Mounting screw for laser head
- Units: 2Dimensions: M3x30
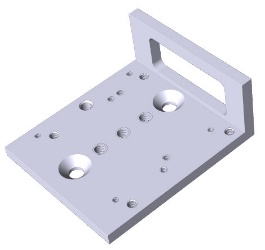
- L8 Laser mounting plate
- Units: 1Dimensions: 66 mm ; 76.2 mm ; 30 mm (WHD)
- L9 Allen screw
- Units: 2Dimensions: M6x12
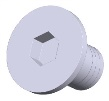
Laser Set LK-H052 (+ Translation Stage)#
Item No. 2102-041 & 2300-001
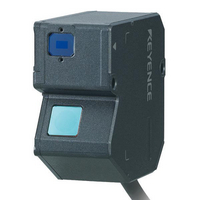
- L10 Laser sensor head Keyence LK-H052
- Units: 1Dimensions: 68 mm ; 68.5 mm ; 33.4 mm ; (WHD)
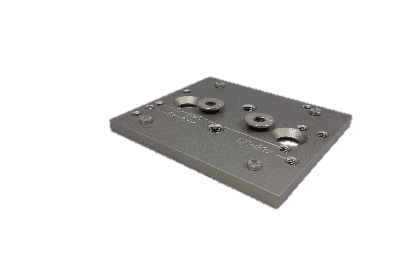
- L11 Laser mounting plate
- Units: 1
- L12 Discs
- Units: 2Dimensions: M4
- L13 Allen screw for laser head
- Units: 2Dimensions: M4x25
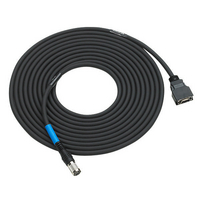
- L14 Connection cable
- Units: 1Dimensions: 5 m (CB-A5)
- L15 Laser controller LK-G5001P
- Units: 1
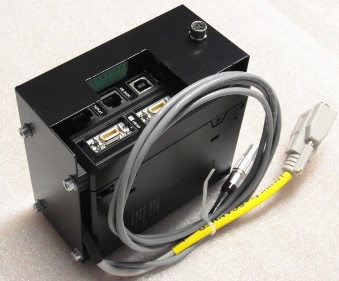
- L16 Power supply for laser controller
- Units: 1
- L17 Translation stage
- Units: 1
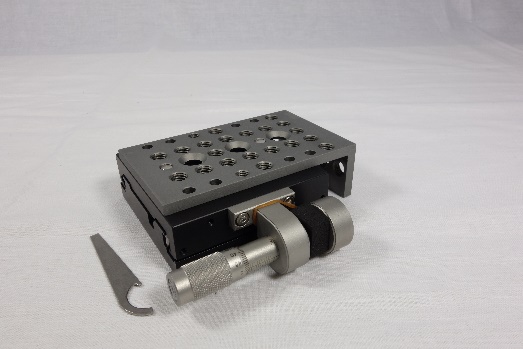
Clamping Set (Optional)#
Item No.: 2500-301
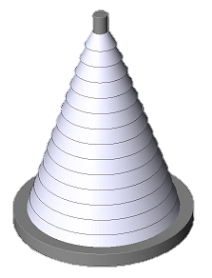
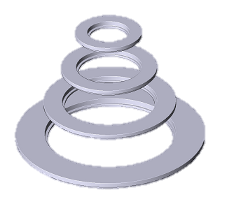
- cone set
- Amount: 14 conesDimensions: see separate table
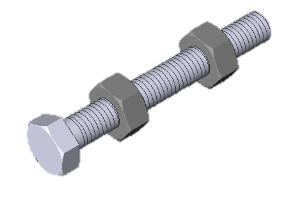
- Plastic hexagon bolt + knurled nuts
- (part of: Cone Set (plastic) for LST or SPM, item-no.: 2500-301)Bolt dimensions: M10x80Amount: 2 bolts in rev.1.1, 3 bolts in rev.1.0Bolt dimensions: M10x40 | Amount: 1 bolt in rev.1.1Nut dimensions: M10Amount: 4 nuts
- 2500-302 ring set
- Amount: 6 sets (A-F)Dimensions: see separate table
Microphone Set MIC 40PP-S1 (Optional)#
Item No.: 2400-007
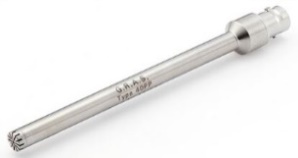
- M1 G.R.A.S. 40PP-S1 IEPE
- Amount: 1Dimensions: ¼’’ (cartridge)
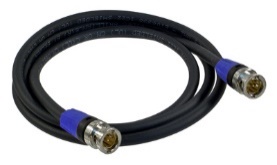
- M2 BNC cable
- Amount: 1Dimensions: 2 m
LST Bench Set - For Internal Laser Mounting#
Item No. 2500-300
LST Bench Rev. 1.0-1.1#
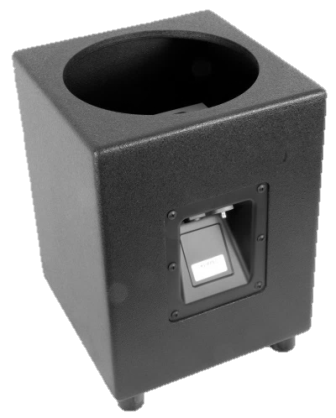
- B11 LST work bench (speakON connector for internal driver, laser cable terminal)
- Units: 1Dimensions: 297 mm ; 374 mm ; 297 mm (WHD)
- B12 Laser mounting platform
- Units: 1Dimensions: 90 mm ; 100 mm ; 30 mm (WHD)
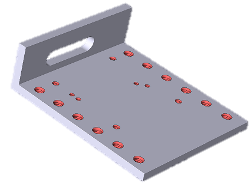
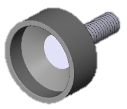
- B13 Hand screw for laser mounting plate
- Units: 2Dimensions: M6x20
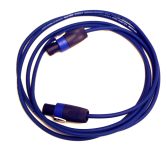
- B14 Cable speakON female 4 x 2,5 mm²
- Units: 1Dimensions: 5 m
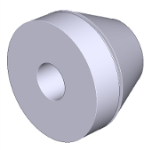
- B15 Rubber terminal
- Units: 1
LST Bench Rev. 1.2#
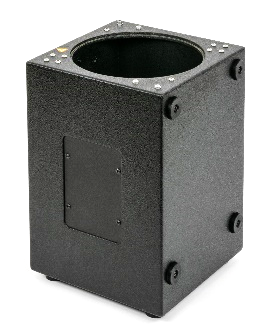
- B21 LST work bench (speakON connector for internal driver, laser and mic terminals)
- Units: 1Dimensions: 297 mm ; 416 mm ; 297 mm (WHD)
- B14 Cable speakON female 4 x 2,5 mm² or 2 x 2,5 mm² (for direct use with Amplifier Card)
- Units: 1Dimensions: 5 m
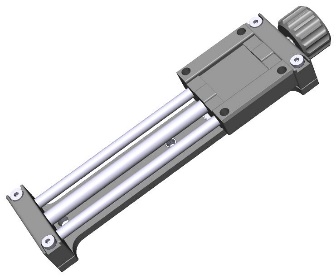
- B23 2-dimensional internal laser mounting and adjustment unit
- Units: 1Dimensions: 45 mm ; 186 mm ; 27 mm (WHD)
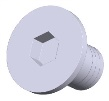
- B24 Allen screw (incl. 6 washers)
- Units: 2Dimensions: M6x12
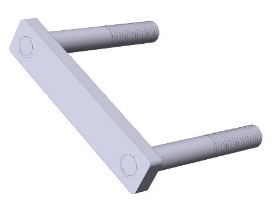
- B25 Mounting bracket (threaded)
- Units: 2Dimensions: M5x35
- B26 Screw head incl. washer
- Units: 4Dimensions: M5
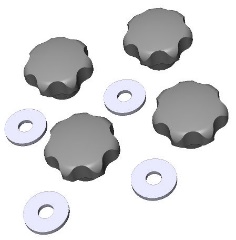
- B15 Rubber terminal
- Units: 2
LST Bench Set - For External Laser Mounting#
Item No. 2500-310
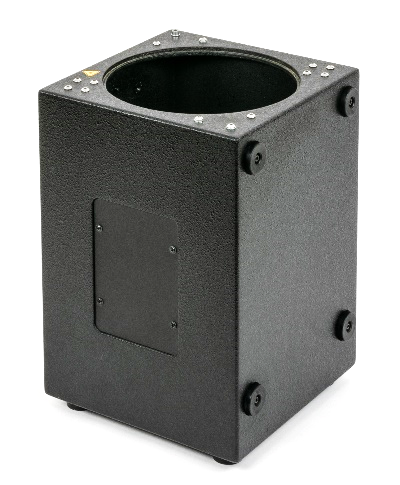
- B21 LST work bench
- Units: 1Dimensions: 297 mm ; 416 mm ; 297 mm (WHD)
speakON connector for internal driver, laser and mic terminals
- B32 Cable speakON female
- Units: 1Dimensions: 5 m
4 x 2,5 mm² or 2 x 2,5 mm² (for direct use with Amplifier Card)
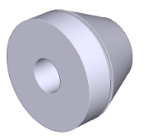
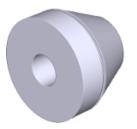
- B15 Rubber terminal
- Units: 2
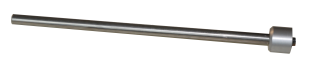
- B34 Laser rod
- Units: 1
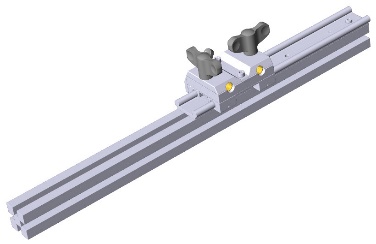
- B35 Sensor slide rail with carriage and two hand screws
- Units: 1
(incl. Allen screws and discs for mounting)
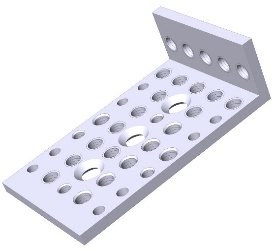
- B36 laser base plate
- Units: 1
MSPM Bench Extension#
- B40 MSPM Bench
- Units: 1
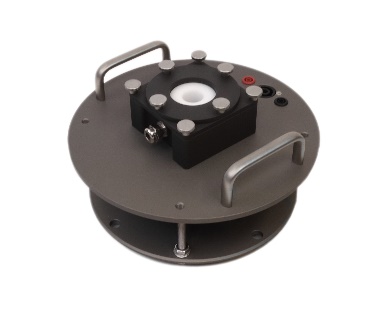
- B41 Extended clamping ring
- Units: 1Dimensions: 70 mm
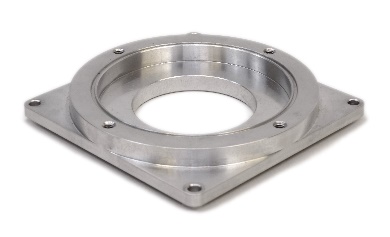
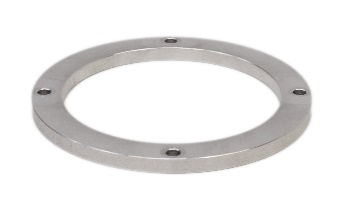
- B42 Extended clamping adapter
- Units: 1
SPM Pro Bench#
Item No. 2500-101
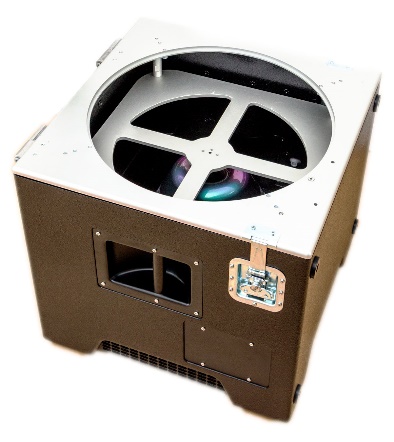
- 1 SPM Pro work bench (speakON connector for internal driver, laser and mic terminals)
- Units: 1Dimensions: 570 mm ; 480 mm ; 498 mm (WHD)
- 2 Supporting rod (leg)
- Units: 1

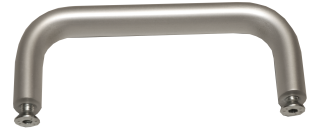
- 10 Handle for platform
- Units: 1
- 11 Countersunk screw for handle
- Units: 2Dimensions: M6x20
- B32 Cable speakON female 4 x 2,5 mm² or 2 x 2,5 mm² (for direct use with KA3 Amplifier Card)
- Units: 1Dimensions: 5 m
- B15 Rubber terminal
- Units: 2
- B34 Laser rod
- Units: 1
- 12 Laser rack
- Units: 1
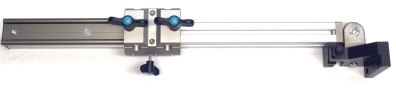
- 16 Laser clamping rest for holding rack horizontally
- Units: 1
- 17 Allen screws for laser rest
- Units: 2Dimensions: M6x25(30)
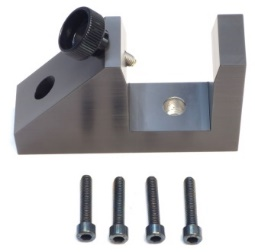
- B36 Laser base plate
- Units: 1
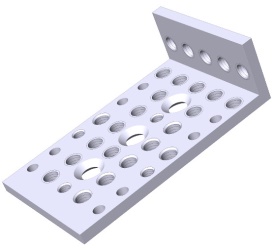
- 22 Threaded bolts
- Units: 4Dimensions: M8x90
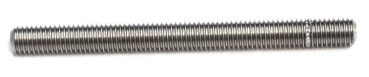
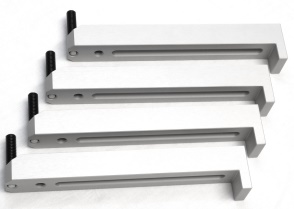
- 23 Clamping levers with thrust screw M8x20
- Units: 4
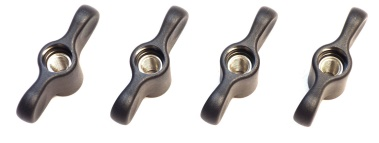
- 24 Turnbuckles
- Units: 4Dimensions: M8
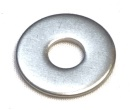
- 25 Discs
- Units: 4Dimensions: M8 large
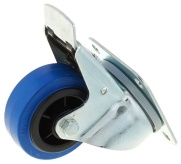
- B26 Wheels (braked) incl. assembly kit
- Units: 4
Setting Up the Test Bench#
For information on mounting the DUT to the LST Bench using the ring and cone set please refer to the LST – Tutorial in the following chapter.
LST Bench Set - For Internal Laser Mounting#
LST Bench Rev. 1.0 & 1.1#
The following steps illustrate the setup of the LST measurement bench revision 1.0 and 1.1.
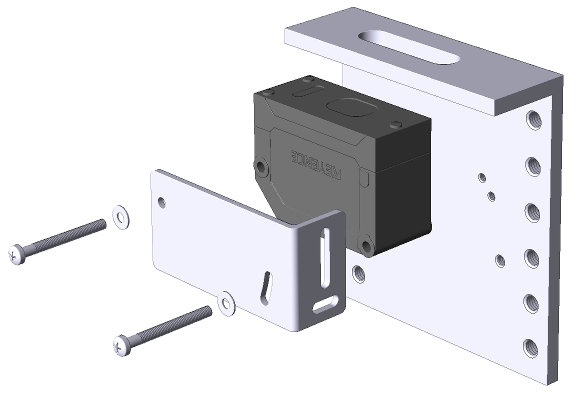
Attach the laser sensor head (L1) to the laser platform (B12) using the mounting screws (L7). Only one pair of holes on the plate corresponds to the mounting holes of the laser head.
Attach the laser platform (B12) to the mounting board inside of the LST Bench (B11) using the hand screws (B13). Various drill holes on the platform and the board allow adjusting the vertical laser position (measurement distance) by shifting the laser platform towards or away from the upper surface of the bench.
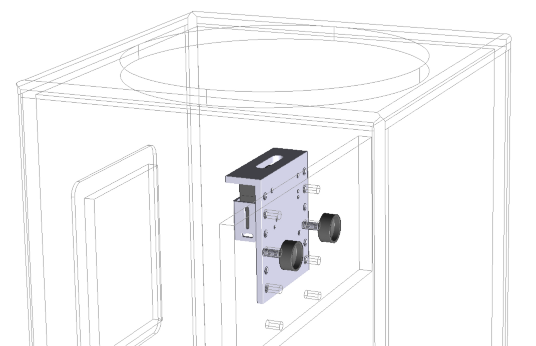
Cut a hole in the rubber piece for laser connection. Attach the rubber terminal (B15) to the corresponding hole at side panel of the LST Bench (B11) and put the connector of the laser head (L1) through it.
LST Bench Rev. 1.2#
The following setup instructions are dedicated to LST Bench revision 1.2 (and higher) with internal laser mounting.
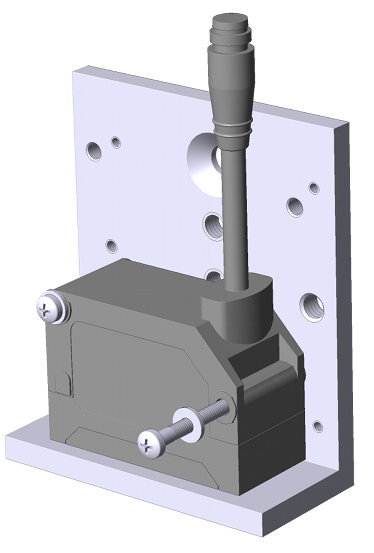
First, the internal laser mounting unit must be prepared before it can be attached to the LST bench. Attach the two mounting brackets (B25) to the laser mounting unit (B23) by using the prepared holes on the base plate. These brackets are used to attach the whole unit to the LST bench later.
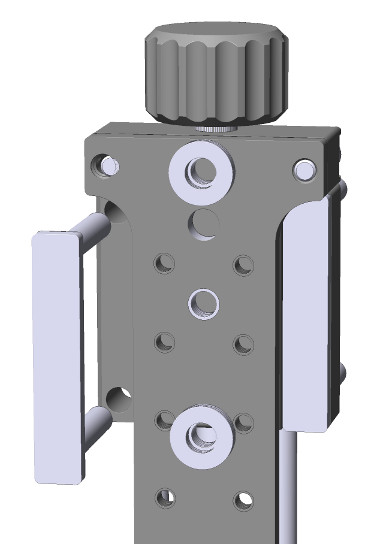
Now attach the laser plate (L8) using the two Note that the laser mounting unit is delivered Allen screws (B24). With additional spacer washers to adjust the distance to the laser plate ensuring correct center position for different laser heads in the test bench. Please place the recommended number of spacers between laser plate and laser mounting unit before applying the screws according to your laser head:
IL-65: 2 spacers (per screw)
IL-30: 3 spacers (per screw)
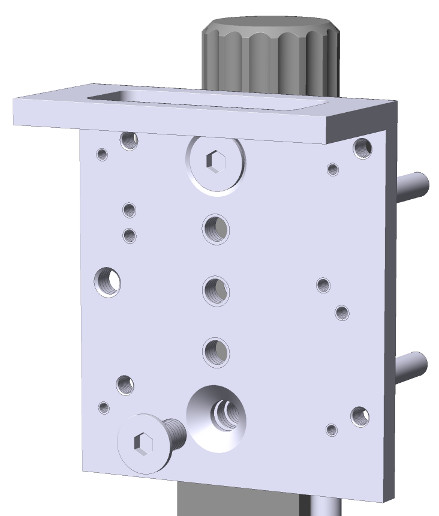
The laser head (L1) can now be attached to the laser plate using the mounting screws (L7). Only one combination of threaded holes will fit for the laser head. The washer should be placed between screw head and laser body. Optionally, the laser protection plate (L2) may be mounted as well. This is usually not necessary because the laser base plate provides sufficient protection.
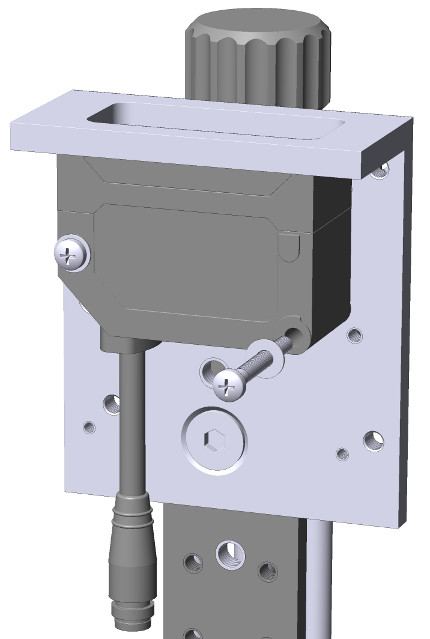
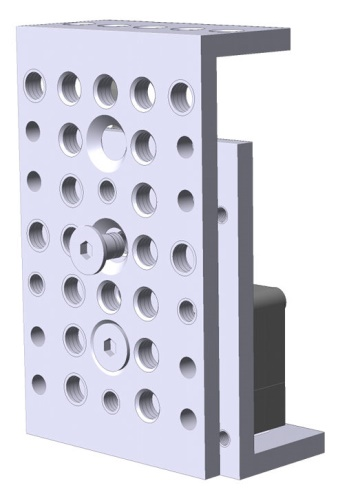
In the following step, the complete laser unit is attached to the internal mounting rail of the LST bench (B21). Stick the threaded ends of the mounting brackets through the slits of the mounting rail. For standard LST application the laser adjustment unit should be placed in the center of the rail. Tighten the hand screws (B26) to attach the laser unit. Put the washer between the rail and the screws to protect the wood.
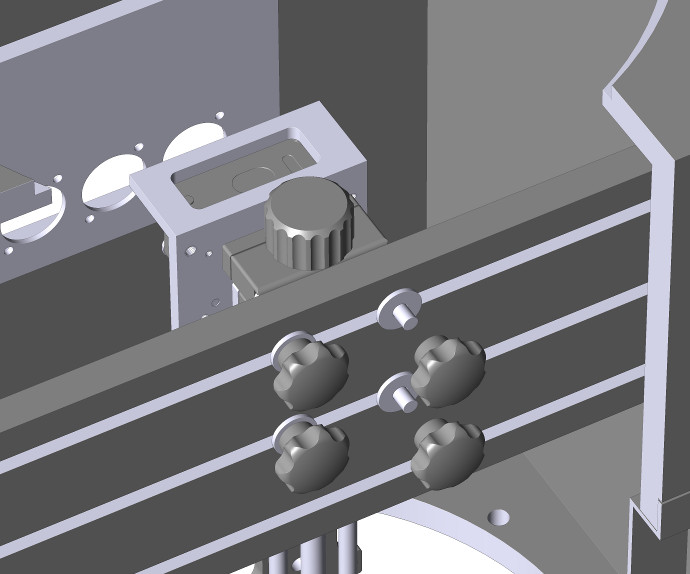
Having followed the previous steps, the setup should look like shown on the right.
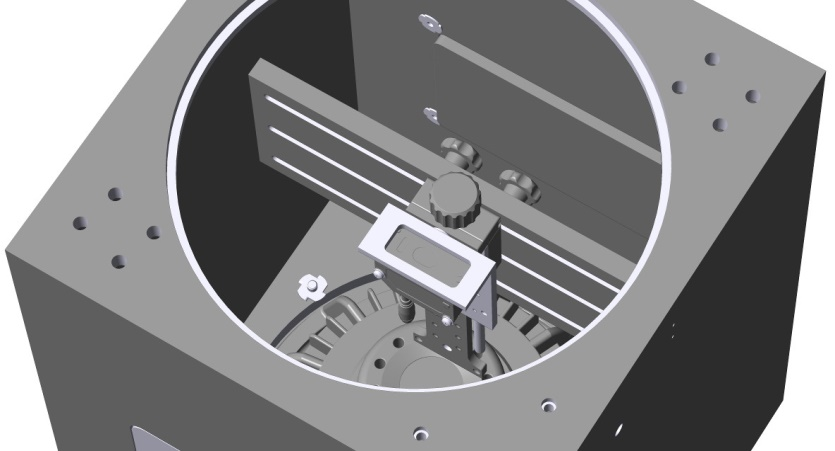
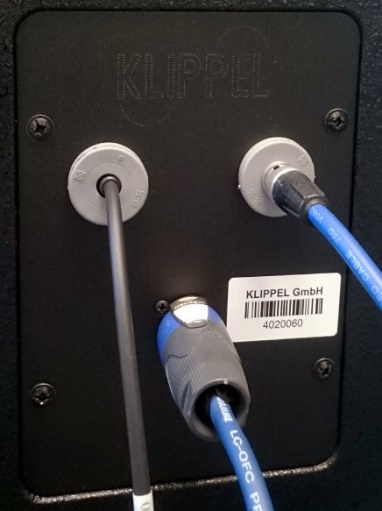
The laser head connection cable (L4) must be lead through one of the available rubber terminals (B15) located on the connection plate of the LST bench. Now attach the female 4 pin end of the laser cable to the laser head’s cable end and fix it using the provided screw ring. Also connect the speakON cable (B14) to the corresponding terminal on the connection plate. If the optional microphone (M1) shall be used, connect it to the BNC cable (M2) and put it in the remaining rubber terminal.
LST Bench Set - For External Laser Mounting#
The extended LST Bench provides an external boom for laser mounting. This allows more flexible adjustment of the laser and might be useful for sample-based testing in QC applications or for R&D test purposes.
The following steps illustrate the setup of the measurement bench.
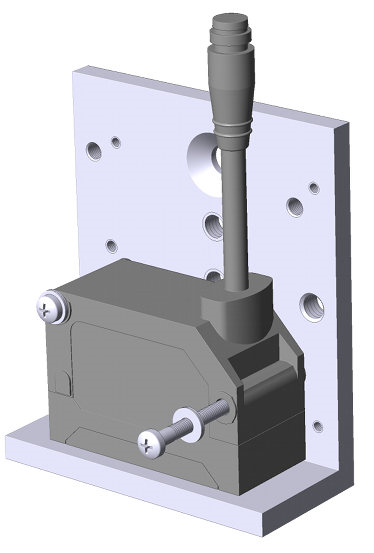
Mount the laser head (L1) on the laser mounting plate (L8) by using the screws and discs (L7) provided with the laser set. Optionally, the laser protection plate (L2) may be mounted as well. This is usually not necessary because the laser base plate provides sufficient protection.
Attach the laser mounting plate (L8) to the base plate (B36) using the Allen screws (L9)
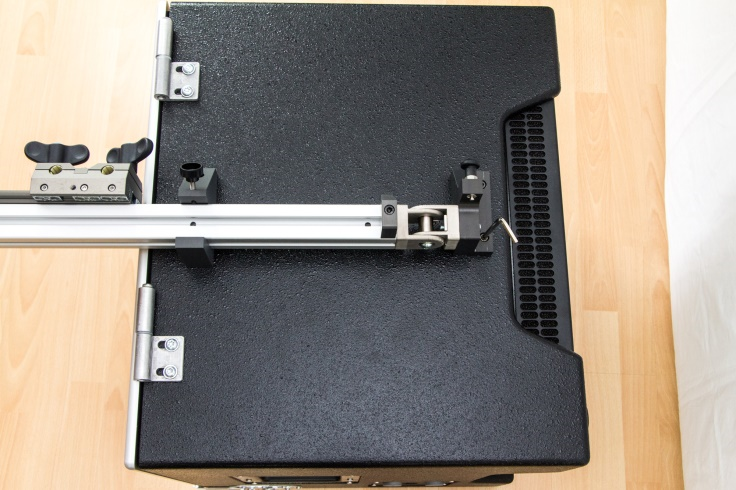
Mount the laser rack to the test bench using the provided Allen screws and discs.
Connect the speakON cable (B14) to the corresponding terminal on the connection plate of the LST Bench. If the optional microphone (M1) shall be used, connect it to the BNC cable (M2) and put it in the remaining rubber terminal.
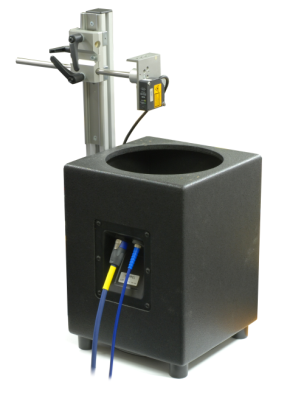
Attach the mounted laser platform to the laser rod (B34) and attach it to the laser rack. Connect the laser head connection cable (L4) with the laser head using the female end of the cable (4 pin socket). Fix the connection using the provided screw ring.
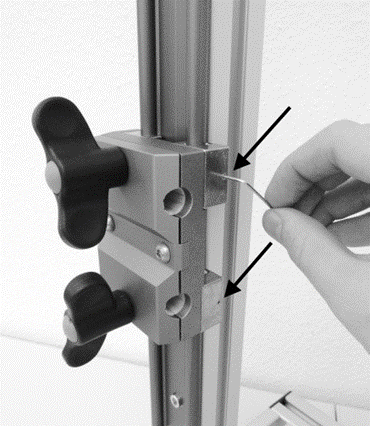
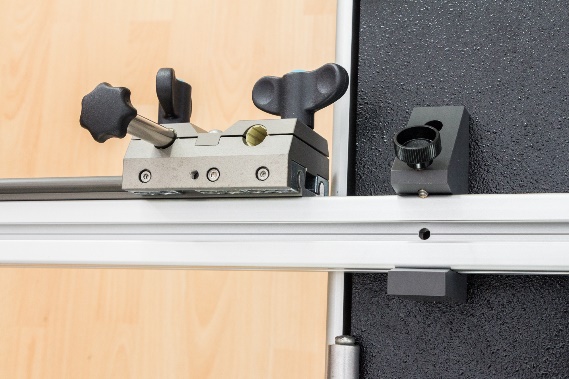
If the carriage is moving too easily or with too much force, you may adjust the friction of the carriage at the guide. Loosen or tighten the 1.5 mm hex socket screws using the 1.5 mm hex key according to your needs.
MSPM Extension for LST Bench#
The MSPM Bench is an extension for the LST Bench for testing small speaker diaphragms. Please follow the instructions in section LST Bench Set - For External Laser Mounting for preparing the LST Bench with external laser mounting.
Prepare the LST Bench according to LST Bench Set - For External Laser Mounting step 3.
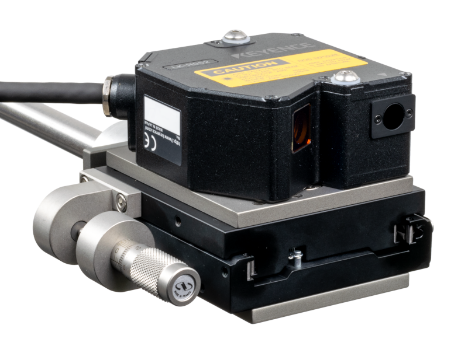
Mount the translation stage (L17) on the laser bracket (B36). Then mount the laser platform (B11) on the translation stage and attach the laser head (L10) to the platform using the screws (L13) and washers (L12). Screw the laser rod (B34) into the laser bracket (B36).
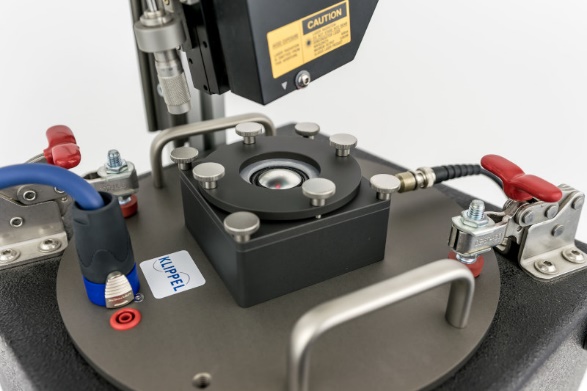
Place the MSPM Bench (B40) on the opening of the LST Bench (B21).
Insert and connect the microphone (M1, M2). Connect the speakON cable (B32) to the input connector of the MSPM Bench.
Mount the laser rod including the laser platform and sensor to the rack.
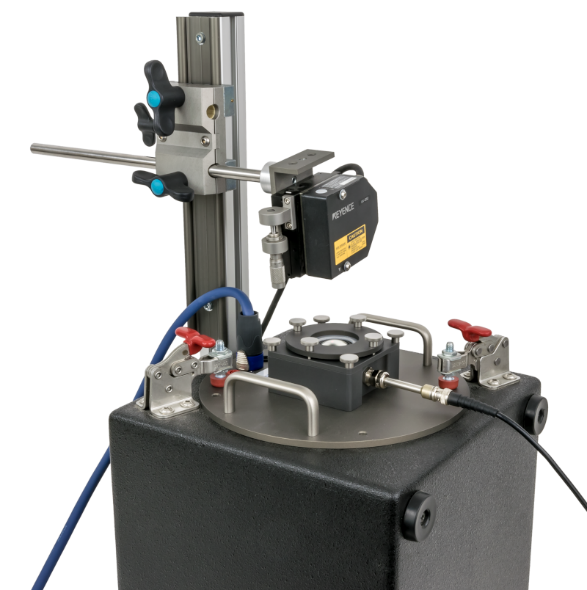
SPM Pro Bench#
The SPM Bench provides an external boom for laser mounting and a larger mounting platform which also fits test objects larger than maximal clamping ring diameter.
The following steps illustrate the setup of the measurement bench.
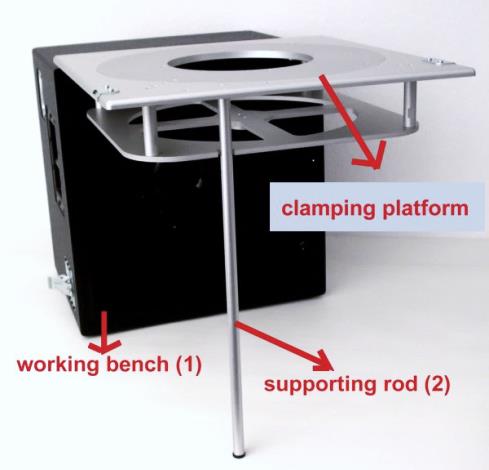
Bring clamping platform in horizontal position and rest it on the supporting rod (leg) (2).
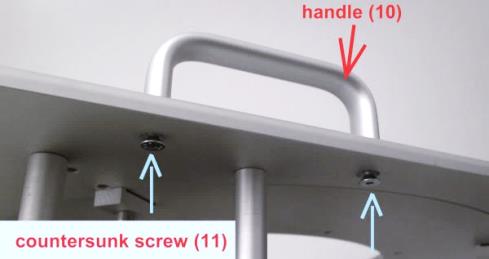
Fasten the handle for platform (10) by using the countersunk screws (11).
If you intend to measure test objects with a diameter of more than 250 mm, you may remove the reduction ring from the mounting platform. Otherwise skip this step. The platform is fixed by 4 metal blocks. They can be removed by loosening the corresponding Allen screws.
1.png)
1.png)
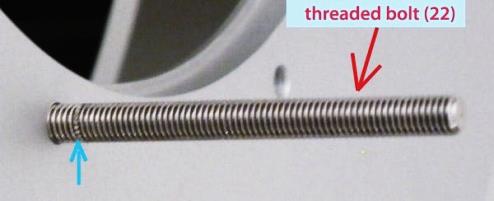
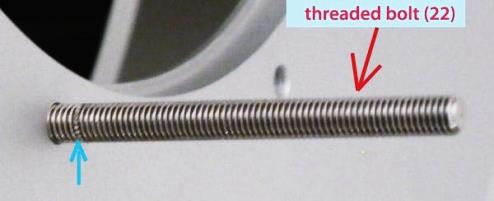
Insert threaded bolt (22) with 8 x 90 mm diameter into the clamping platform using the short side of the bolt (limited by ring). Screw all four threaded bolts into the platform.
Put on the four levers (23).
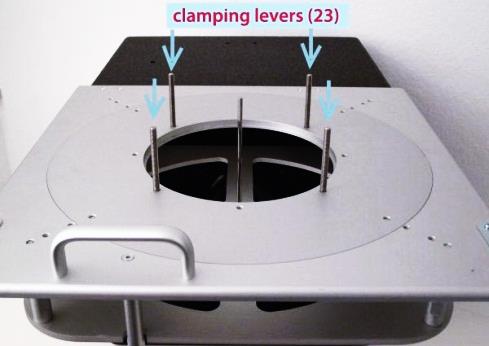
Fasten the levers (23) by using the M8 discs (25)…
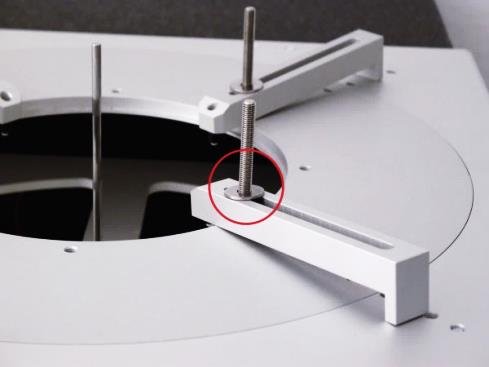
… and the turnbuckles (24)
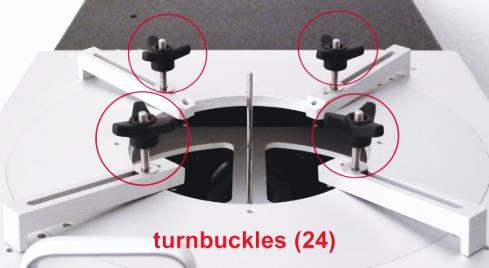
Bring the clamping platform back in vertical position (remove the supporting rod). Fasten the laser clamping rest (16) by using two M6x25 Allen screws (17).
Attach the laser rack (12) to the bench by using the remaining two Allen screws(17).
Insert the laser rod (B34) into the slider of the laser rack (12).
Optionally, attach the wheels (B26) to the bottom of the SPM Bench. Put the bench in horizontal position (mounting platform facing up). If the wheels are attached, make sure that the wheel brakes are fastened before tilting the bench.
Mount the laser head (L1) on the laser mounting plate (L8) by using the screws and discs (L7) provided with the laser set. Optionally, the laser protection plate (L2) may be mounted as well. This is usually not necessary because the laser base plate provides sufficient protection.
Attach the laser mounting plate (L8) to the base plate (B36) using the Allen screws (L9).
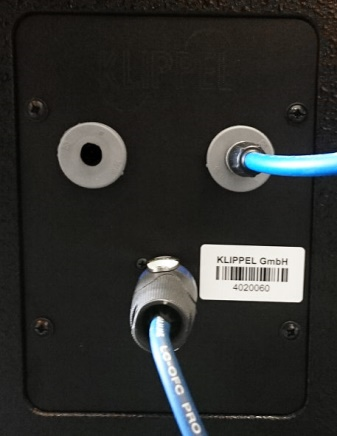
Connect the speakON cable (B14) to the corresponding terminal on the connection plate of the SPM Bench. If the optional microphone (M1) shall be used, connect it to the BNC cable (M2) and put it in the remaining rubber terminal.
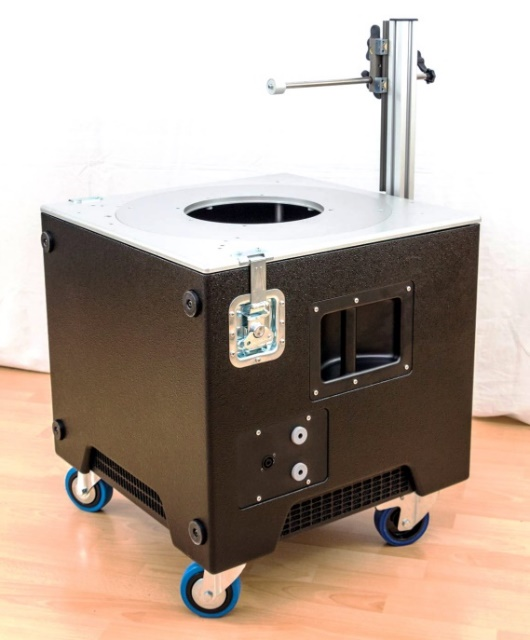
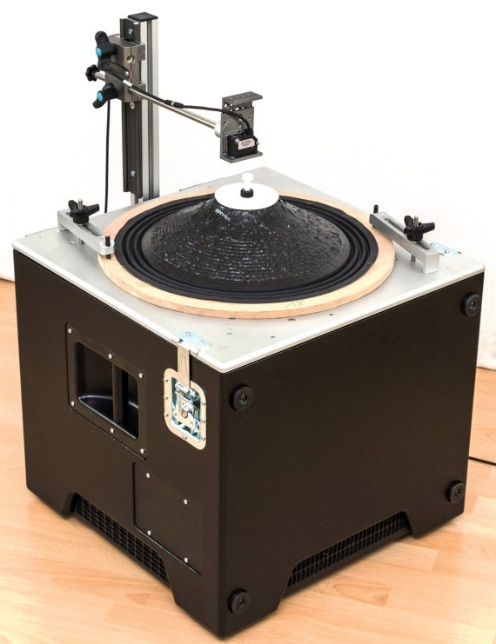
Attach the mounted laser platform to the laser rod (B34). Connect the laser head connection cable (L4) with the laser head using the female end of the cable (4 pin socket). Fix the connection using the provided screw ring. The picture shows the finalized bench. For instructions on how to connect the complete measurement system and following sections.
Connecting the Test Bench#
After the measurement bench has been set up it needs to be connected to the remaining hardware components like power supplies, analyzer, amplifier and PC.
Production Analyzer with External Amplifier#
This is example is based on the default setup for the QC System. Please also refer to the section Connecting the System of the QC User Manual for more general information about setting up the QC System.
The schematic below gives an overview of the complete test setup for LST Bench with internal laser mounting. Other test benches are not addressed here separately because the overall setup is identical.
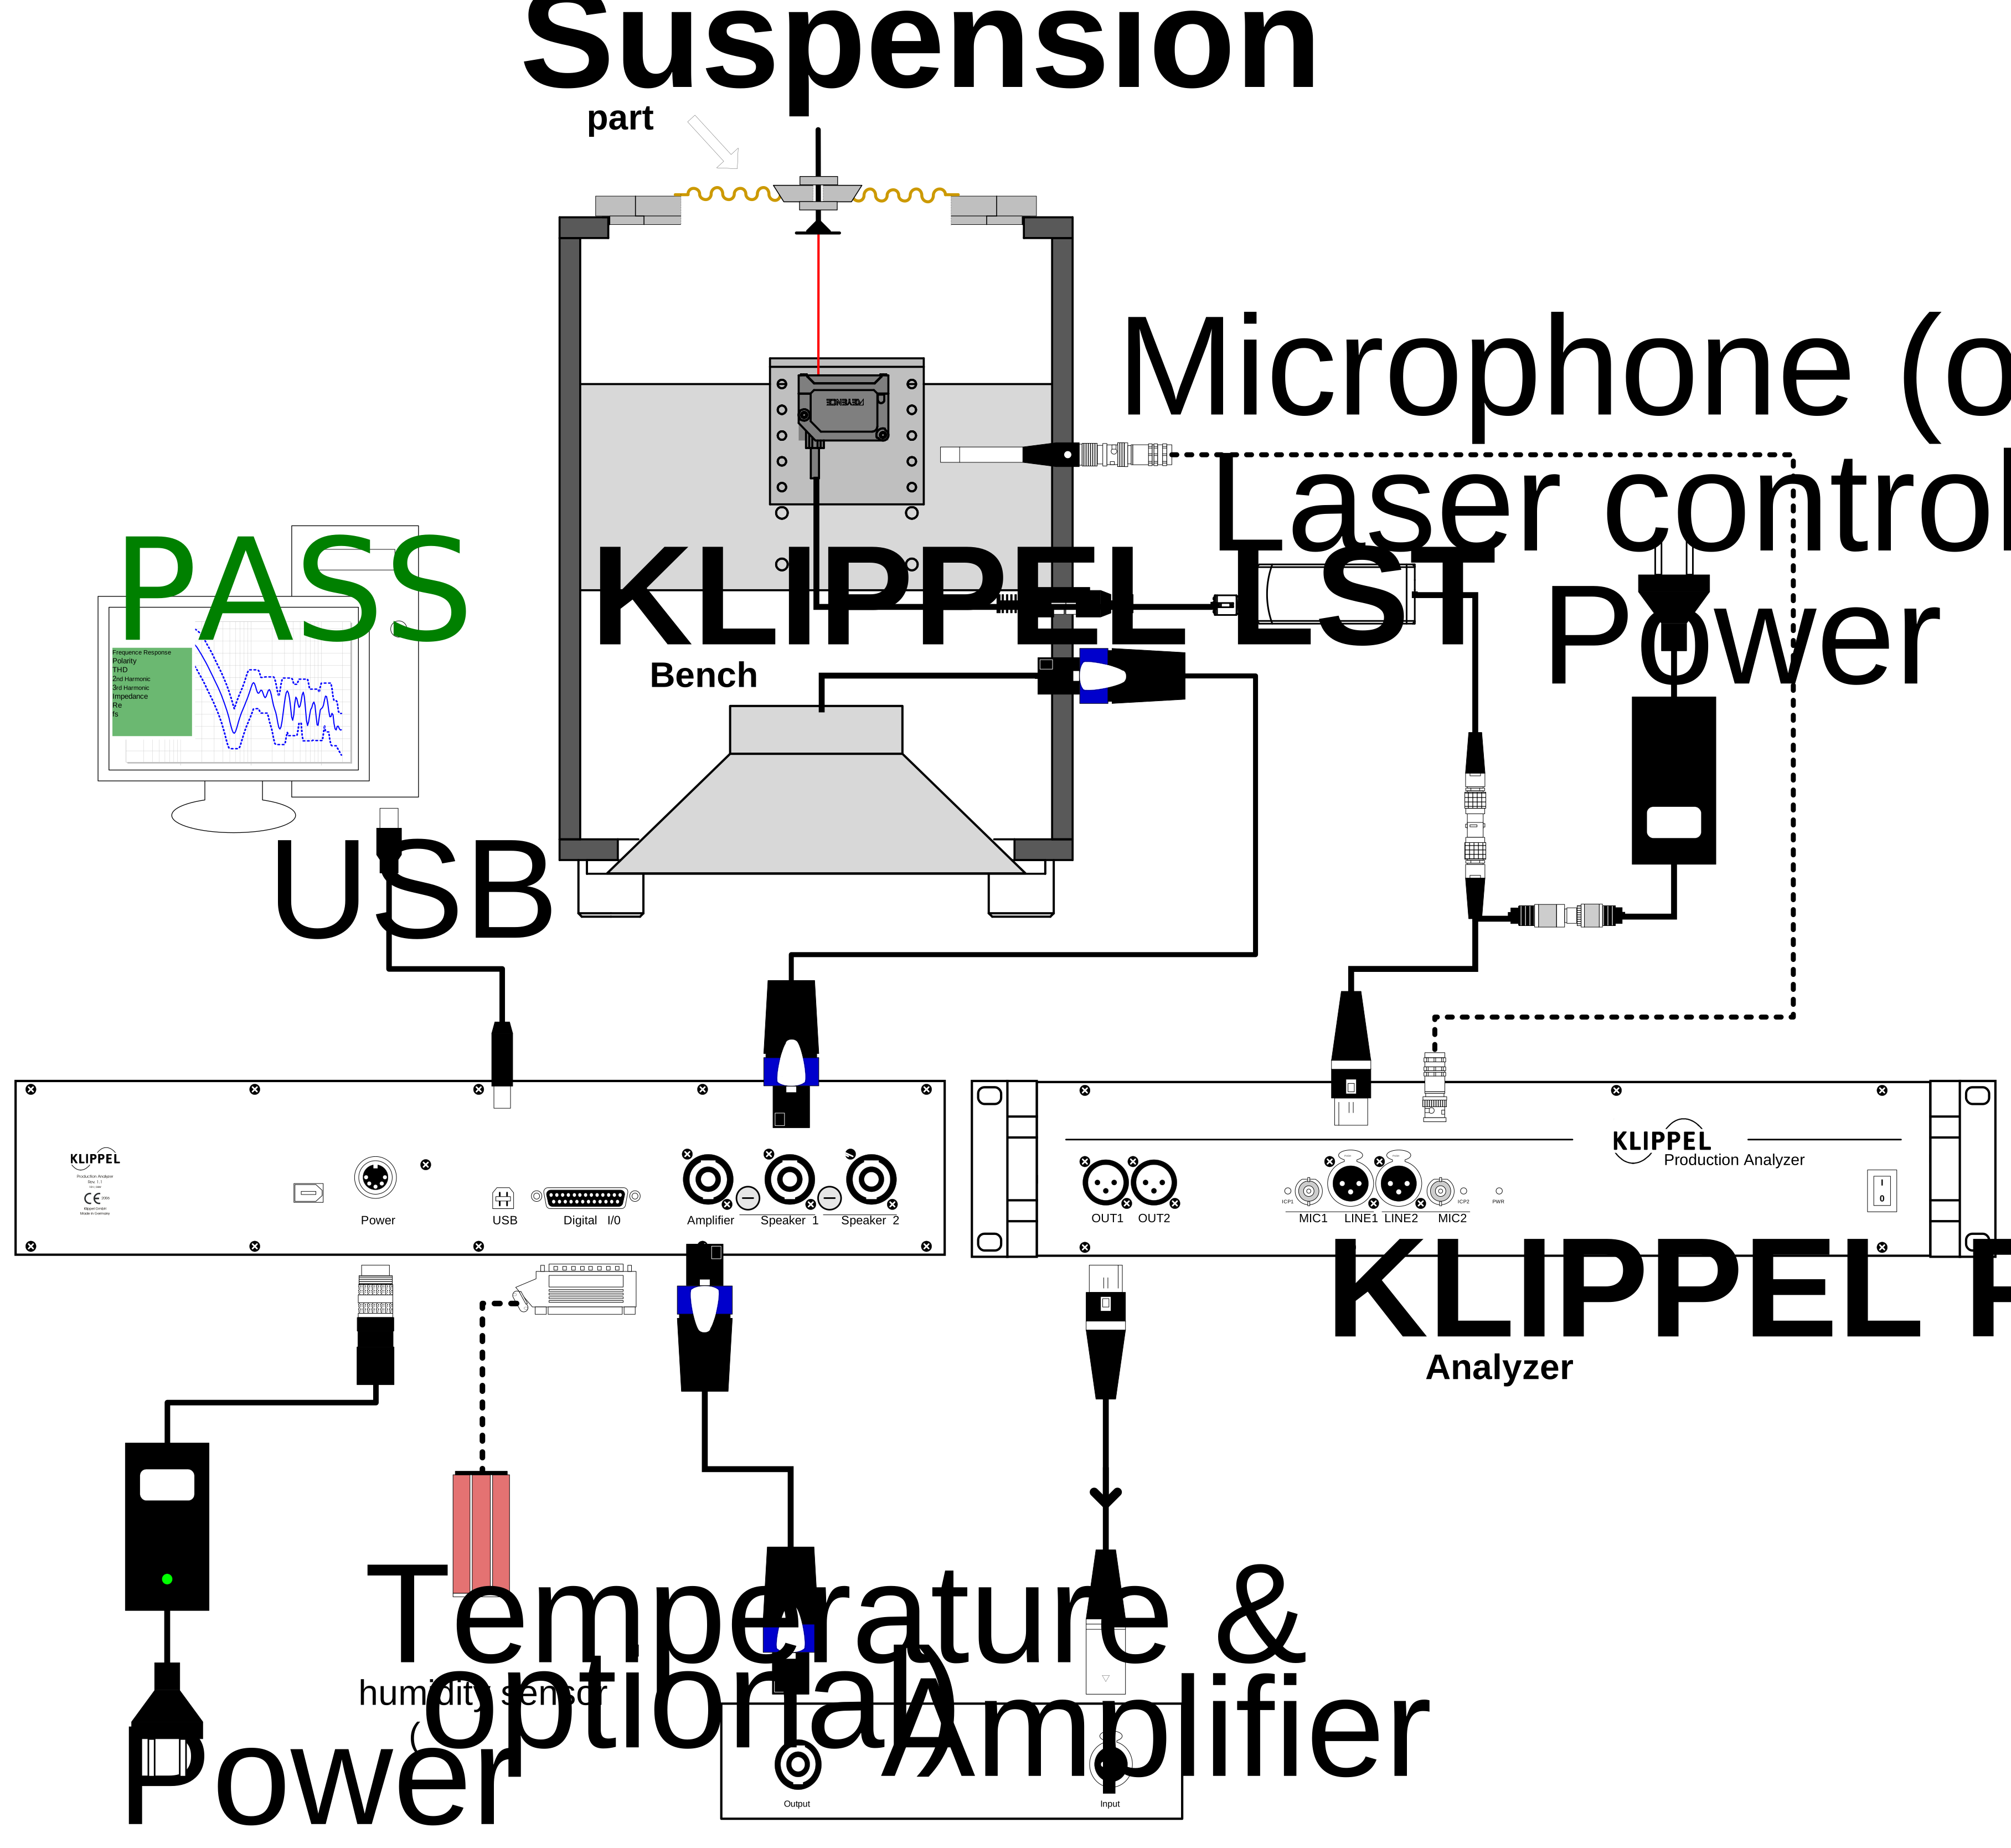
Connect the components in the following way:
The output OUT1 of the Production Analyzer hardware (PA) providing the stimulus signal is connected to the input of the power amplifier (XLR cable).
The output of the power amplifier is connected to the speakON connector (AMPLIFIER) at the rear side of the PA.
The output SPEAKER 1 of the PA is connected to the speakON terminal of the LST Bench (B11 or B21) or SPM Bench using the provided speaker cable (B14).
The laser sensor head (L1) is connected to the laser controller (L5) with the connection cable (L4) via the rubber terminal at the connection plate of the LST test bench (internal laser mounting). For external laser mounting, directly connect the cable to the laser head.
The adaptor cable (L3) is used to connect the laser controller to the power supply (L6) and the LINE 1 signal input of the Production Analyzer.
Klippel Analyzer 3 with Internal Amplifier#
The following hardware setup is an example for LST application with a fully equipped KLIPPEL Analyzer 3 in ALSX configuration (incl. Amplifier Card) and LST Bench with external laser mounting. This setup is applicable for both, QC and R&D application. The Speaker Card is optional, since the LST Bench may be operated directly with the Amplifier Card.
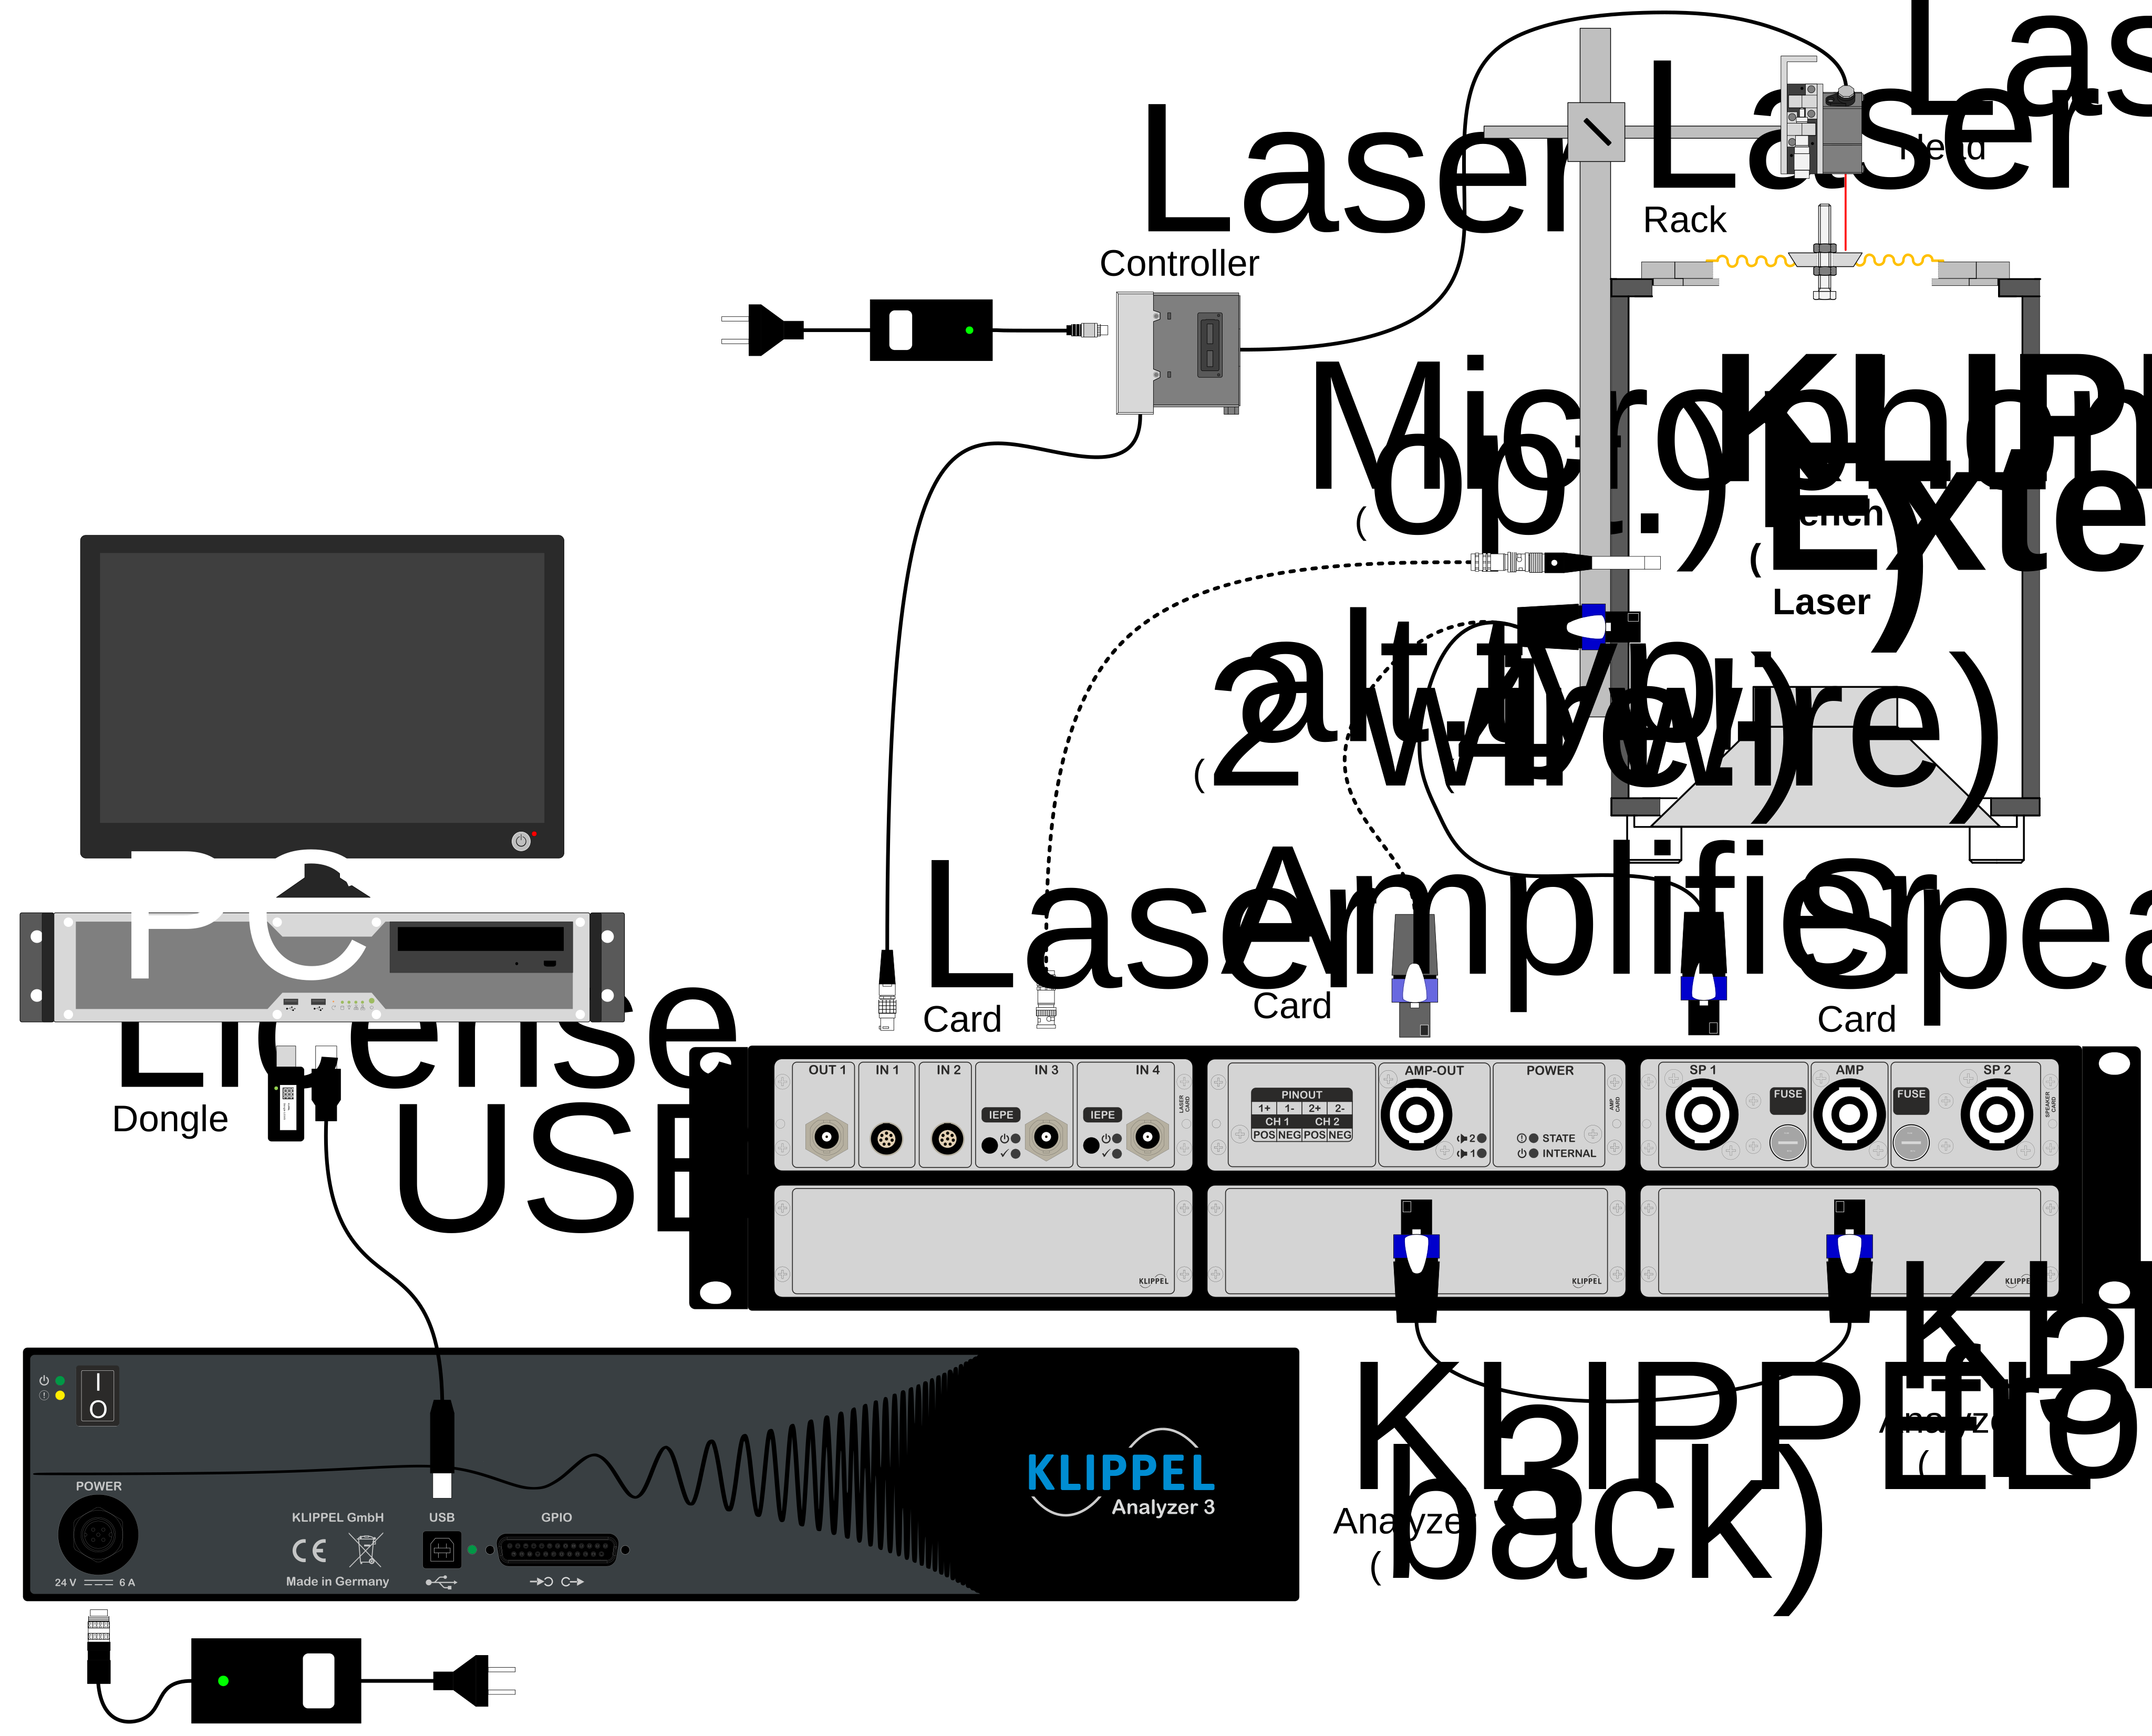
Connect the components in the following way:
Connect the Amplifier Card output of the KA3 to the AMP input of the Speaker Card or if not available, directly to the input terminal of the test bench
Connect the SP1 output of the Speaker Card to the speakON terminal of the LST Bench (B11 or B21), MSPM Bench (B32) or SPM Bench (1) using the speaker cable (B32).
The laser sensor head (L10) is connected to the laser controller (L15) with the connection cable (L14).
Connect the power supply (L16) to the laser controller
Connect the laser controller output to IN1 or IN2 of the Laser Card
Connect the microphone (M1) to IN3 or IN4 of the Laser Card
Note
An alternative, more cost-efficient analyzer configuration for QC applications is the KA3 QL that includes QC Card with integrated amplifier and microphone inputs as well as the Laser Card providing dedicated laser inputs.
Warning
In case the test bench is connected directly to the Amplifier Card output connector (4-pole stereo), make sure that the cable has only two wires (or at least only 1+ and 1- wires are connected). The default connection cable has four wires and is dedicated to be connected to the Speaker outputs of the analyzer. KLIPPEL provides the correct cable if the set is purchased at once.
Sensor Calibration#
Background#
The measurement principle of the LST does not require calibrated sound pressure and displacement input signals. All processing is based on relative amplitude or transfer functions only. However, in order to control and report peak displacement during measurement, the laser displacement signal should be calibrated correctly.
If a microphone is used for transfer function method, also the microphone calibration and max SPL data should be set correctly in order to identify and prevent microphone clipping.
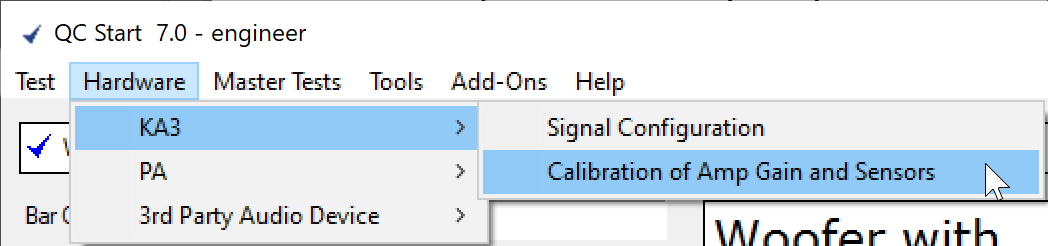
The QC sensor calibration can be accessed via QC Start or dB-Lab Hardware menu . Please find more information in QC User Manual section Calibration / Check of Accuracy.
Note
The default laser sensor files for all supported laser heads are provided by Klippel and can be applied without any calibration measurement. The accuracy is sufficient for LST application. However, manual laser calibration or accuracy check may be performed, optionally.
How to Perform Calibration#
The LST bench does not contain any specific mechanism to generate a known displacement of the laser sensor or laser target. Following principle is only applicable if the laser rack is used. Follow the instructions in the QC User Manual section Calibration / Check of Accuracy to determine the laser sensitivity.
In order to reduce the distance between laser sensor and target, as specified in the Hardware manual, use an object of known height. The used object has to have a bright surface to reflect enough laser light. Measure the object in advance using a vernier caliper or similar device and apply the object as shown by the figure in the hardware manual.
LST – Tutorial#
Overview#
What is the Goal of This Tutorial?
This tutorial makes you familiar with the LST operation. It guides you through the mounting procedure of the DUT and the first measurement with the LST task.
The tutorial is divided into the following steps:
attaching the DUT (spider) to the test bench using the ring and cone set
creating an LST test
performing a first measurement
viewing LST results
modifying the settings of the LST task and creating limits
Mounting the DUT on the Test Bench#
Before configuring the LST software it is necessary to mount your DUT properly on the test bench. The optional ring and cone set is recommended for measuring suspension parts with circular geometry offering various sizes for a wide range of DUTs. Mounting devices with special geometries and over size or passive radiators may require custom clamping.
This tutorial will describe the standard procedure for typical spider testing. In contrast to the SPM module for the KLIPPEL R&D System the LST only evaluates the linear performance of the suspension part, optimized for high-speed testing. The DUT is mounted gravity-held on top of the LST measurement bench and stimulated in the small signal domain. For this reason, the mounting effort is minimized.
Dimensions of the Suspension Part#
- Di
is the inner diameter at the neck of the suspension part (if available).
- Do
is the outer diameter of the suspension part without rim.
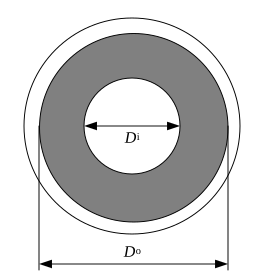
Inner Clamping#
The inner clamping refers to all mounting parts which are attached to the neck of the suspension part under test. These components provide a clamping weight and thus also defined moving mass as well as a reflecting surface for the laser sensor with adjustable height.
Please skip this section for parts without cutout (complete cones, domes or passive radiators).
Note
that very light parts (domes) still require an additional mass in order to provide a defined moving mass and to lower the natural resonance frequency to make sure it is within the usable bandwidth of the test bench.
Selecting the Cone#
Select the cone fitting best to the part to be measured. The inner diameter Di of the part has to be larger than the cone diameter Dc.
See the look up table for dimensions of cones and cups or slide the suspension on the cone stack to find the optimal cone part.
Cone number |
Cone diameter Dc in mm |
Cone weight in g |
|---|---|---|
1 |
11 |
2.1 |
2 |
18 |
5.2 |
3 |
25 |
9.5 |
4 |
32 |
14.9 |
5 |
39 |
21.3 |
6 |
46 |
28.9 |
7 |
53 |
37.6 |
8 |
60 |
47.3 |
9 |
67 |
58.3 |
10 |
74 |
70.1 |
11 |
81 |
83.1 |
12 |
88 |
97.3 |
13 |
95 |
112.4 |
14 |
102 |
128.6 |
Inner Clamping#
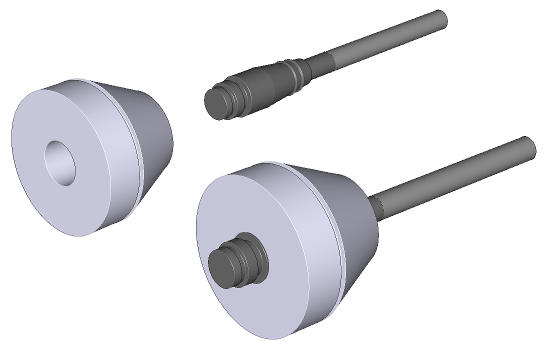
To complete the inner clamping, the hexagon bolt has to be attached to the selected cone using the knurled nuts as shown in the figure below. Depending on laser position (internal or external mounting), the bolt head should face downwards or upwards. Two different bolt lengths are provided. In some cases, the short bolt is the better choice to avoid tumbling, especially when the longer bolt would be mounted asymmetric.
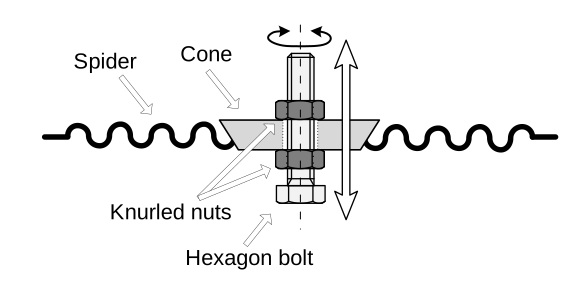
The head of the bolt acts as the reflecting surface for the laser displacement sensor. To (fine) adjust the measurement distance, you may shift the screw relative to the cone by turning it (only necessary for LST Bench Rev 1.0-1.1 without adjustable laser position).
Note
Please check that a reflecting surface (sticker) is attached to the head of the bolt (as delivered by Klippel). This is important to provide good reflective properties for the laser beam and thus a good SNR of the measured signal. If the sticker was removed accidentally any bright colored sticker or white correction fluid may be attached instead.
Measure the weight of the suspension with inner clamping parts (approx. moving mass); it will be needed for the LST software later (see Moving Mass).
In many cases the clamping parts dominate the total mass significantly and the moving mass of the DUT may be neglected (or a typical value/weight added). In this case use the mass values of the clamping parts stated in the look up tables to calculate the approximate moving mass.
Clamping part |
Mass in g |
|---|---|
Hexagon bolt M10x80 |
7 |
Hexagon bolt M10x40 |
4.5 |
Knurled nut M10 |
3.2 |
Outer Clamping#
Using Standard Ring Set#
Selecting the Clamping Ring#
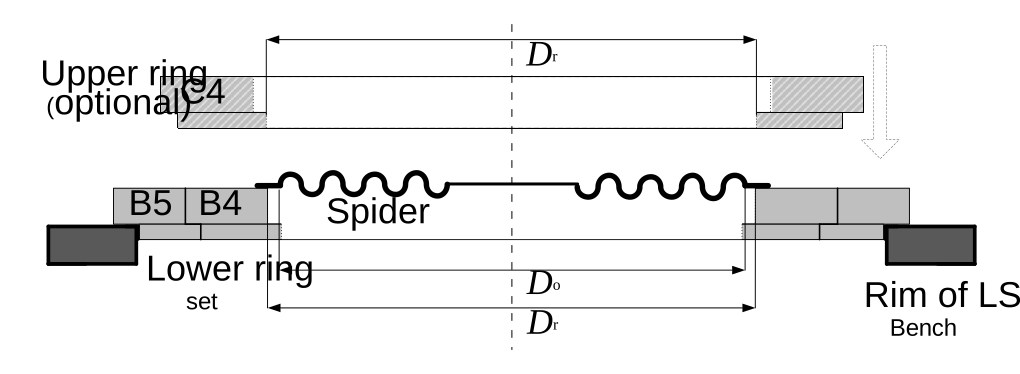
Select the outer rings. The outer diameter Do of the suspension part should be just smaller than the ring diameter Dr (see look up table below). Example: The spider has a Do of 87 mm. The look-up table below shows that B3 with a Dr of 89 mm is just greater than Do.
The lower ring set is completed by selecting all rings which have the same character in the nomenclature and are larger than the outer clamping ring. Example: Select B5-B4-B3.
Optional: The next larger ring can be used as the upper clamping ring because this ring has a rim on the opposite side with the same diameter Dr as the lower clamping ring. Usually, no upper ring is required. In some cases (e.g., cones) it might be necessary to fix the outer rim of the DUT to make sure that the rim does not bend. An upper ring can also help improving repeatability if the rim is not stiff enough. However, exchanging the device will take more time. Example: Select ring C3 which follows ring B3.
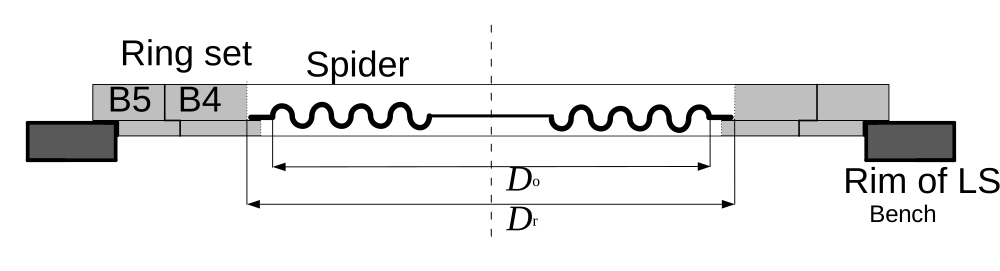
For easier centering you may also select a ring set where the inner diameter Di is slightly larger than the total diameter of the suspension. The DUT will rest on the inner edge of the ring in this case as shown above. This will prevent the device from shifting the horizontal position.
Name of the ring |
\(D_{\text{r}}\) in mm |
|---|---|
A1 |
30 |
B1 |
33 |
C1 |
36 |
D1 |
39 |
E1 |
42 |
F1 |
45 |
G1 |
48 |
H1 |
51 |
A2 |
54 |
B2 |
57 |
C2 |
61 |
D2 |
65 |
E2 |
69 |
F2 |
73 |
G2 |
77 |
H2 |
81 |
A3 |
85 |
B3 |
89 |
C3 |
93 |
D3 |
98 |
E3 |
103 |
F3 |
108 |
G3 |
113 |
H3 |
118 |
A4 |
124 |
B4 |
130 |
C4 |
136 |
D4 |
142 |
E4 |
148 |
F4 |
154 |
G4 |
160 |
H4 |
166 |
A5 |
173 |
B5 |
180 |
C5 |
187 |
D5 |
194 |
E5 |
201 |
F5 |
208 |
G5 |
215 |
H5 |
222 |
Loudspeaker Cones#
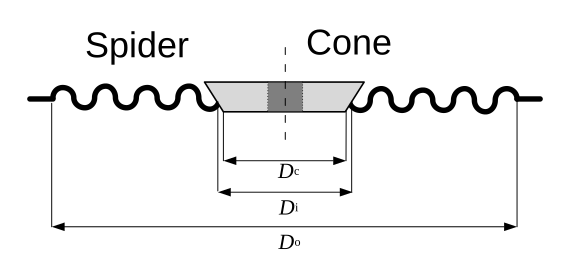
Loudspeaker cones can be mounted in the same way as described for spiders in the previous section. Please refer to the picture below for the relevant diameters.
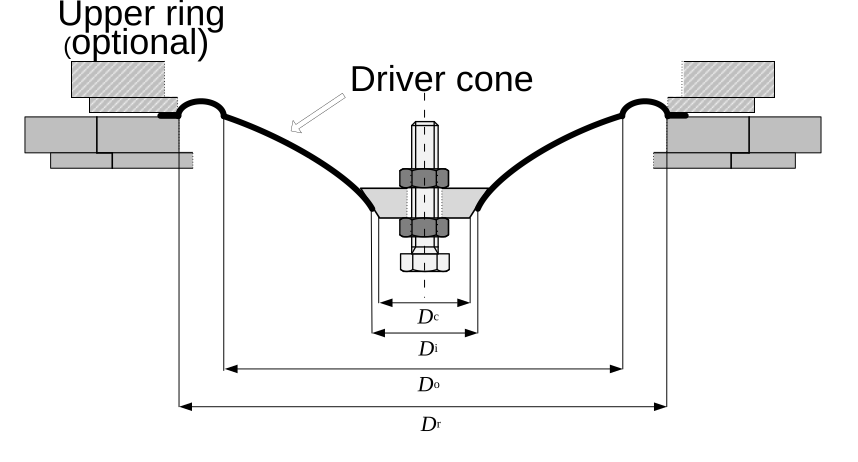
Depending on laser position (internal or external mounting), the cone should be mounted facing upwards (as shown in picture) or downwards.
Note
Using an upper ring is recommended as most surrounds are too soft to provide defined support.
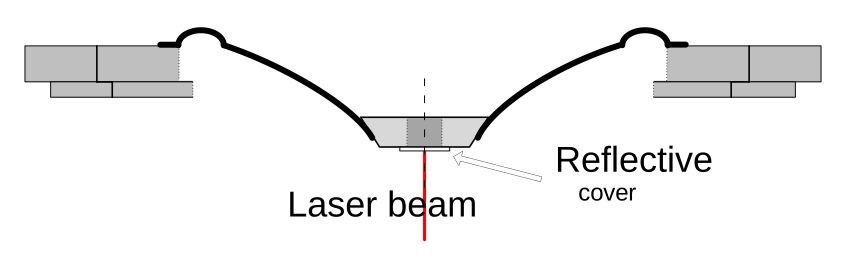
Some surrounds might be too soft to handle the additional mass due to the inner clamping parts. In this case only the clamping cone might be used leaving out the bolt and the nuts. To provide a reflective surface for the laser sensor, the inner hole of the clamping cone needs to be covered properly (e.g., a white strip) as shown above.
Passive Radiators#
For testing passive radiators no additional mass or inner clamping is required. In case of circular shape, the clamping ring set may be selected and used according to section Selecting the Clamping Ring.
In case the device does not provide a frame, using an upper ring may be required.
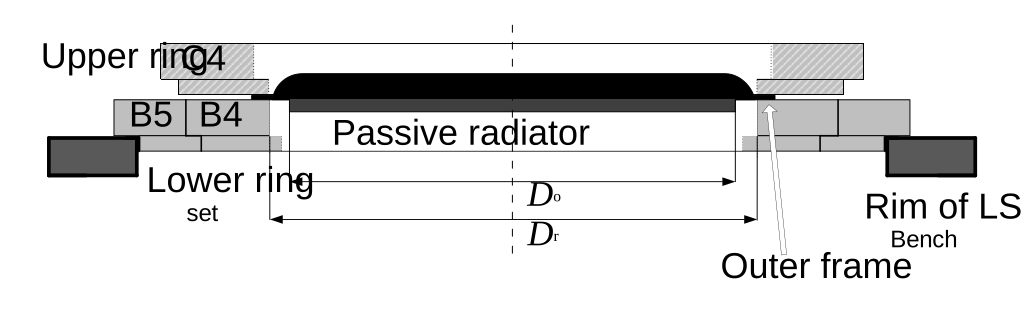
Note
In order to provide an optimal signal-to-noise-ratio of the laser displacement signal it is beneficial to attach a reflective material (e.g., white strip) to the center of the DUT. However, in most cases this is not necessary and should be considered only if the measurement suffers from poor signal quality.
Using Custom Clamping#
In case the optional clamping ring set cannot be used due to irregular shaped (e.g. oval) or oversized DUTs (d > 222 mm), custom clamping platform must be provided.
Any solution which fixes the device under test in a stable distance to the laser under reproducible clamping conditions may be used.
Note
There are no general restrictions employing custom clamping equipment. However, the DUT should be mounted in the exact geometric center of the LST Bench. Please contact support for construction recommendations and information on test bench dimensions.
Irregular DUT Shape#
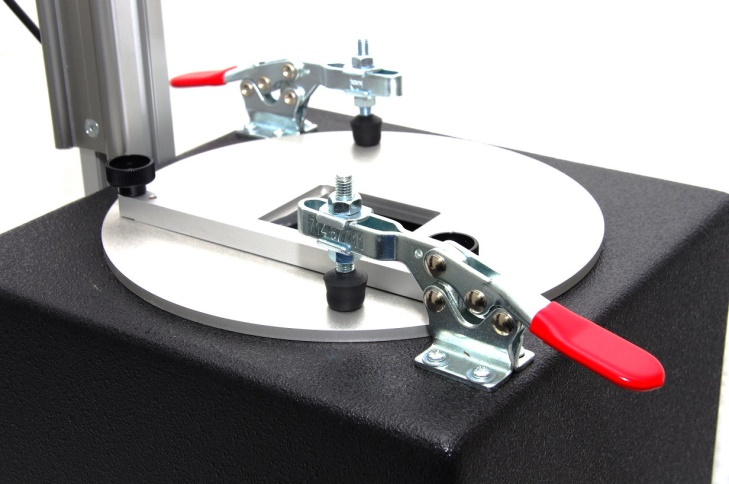
The example below shows a custom platform using fast clampers for fixing framed passive radiators.
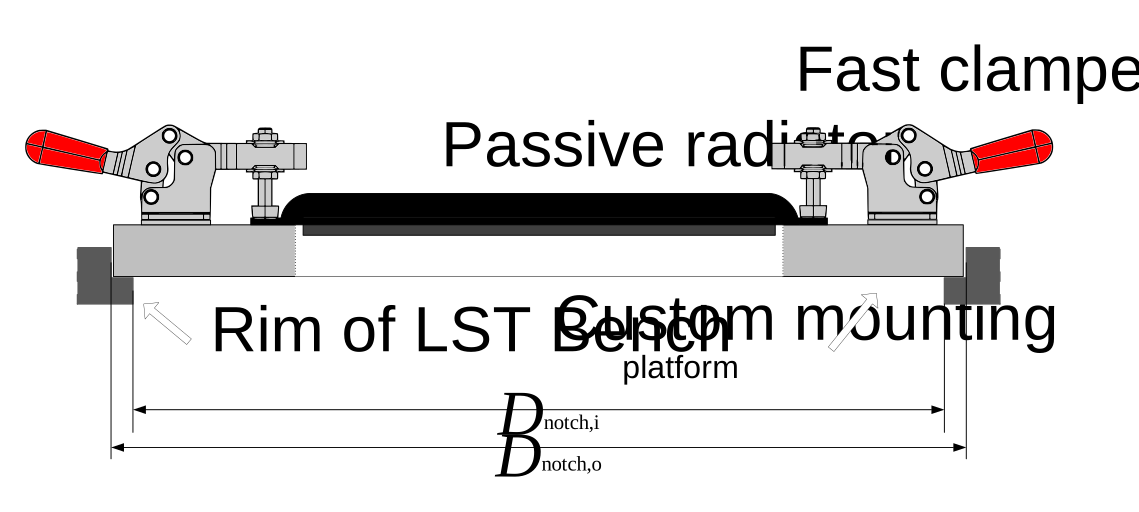
The platform may overlap the top opening of the LST Bench or it should fit the notch (\(D_{\text{notch,o} = 240 mm\) and \(D_{\text{notch,o} = 250 mm\)) so it can be attached as the standard ring set.
Note
Using the LST Pro mode for mass-stiffness-separation, the clamping should be very reproducible due to the relative measurement principle. The platform should be fixed properly on the LST Bench. Sealing gaskets may be used to provide proper sealing and stable conditions.
Custom Rings for Oversized DUTs#
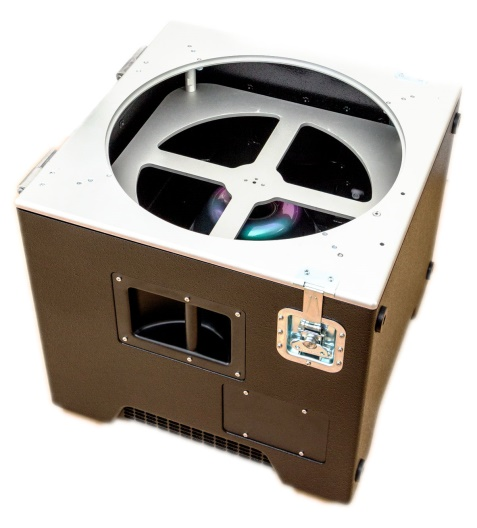
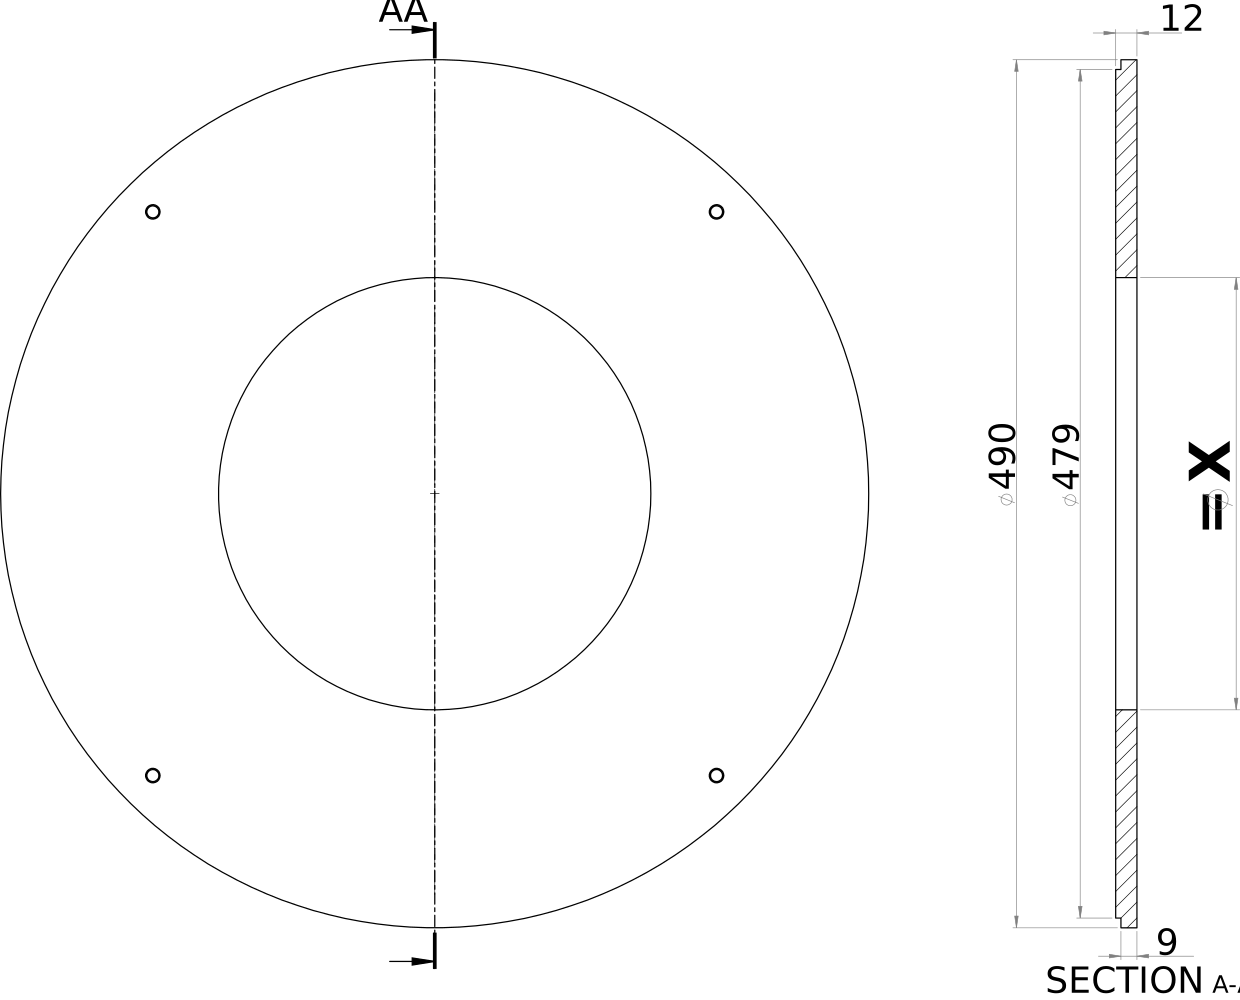
Custom clamping rings are required for DUTs exceeding the maximum diameter supported by the standard ring set (> 222 mm). The LST Bench is limited to the maximal size of the ring set due to its compact size. However, the SPM Bench can be modified to fit larger rings by removing the inner part of the clamping platform as described in section SPM Pro Bench step 3. Custom rings may be made of wood or any other stiff material. As shown in the picture below, the outer diameter Dring can be chosen to fit the nut of the SPM clamping platform. This eases correct centering on the test bench and may prevent using any additional fixture.
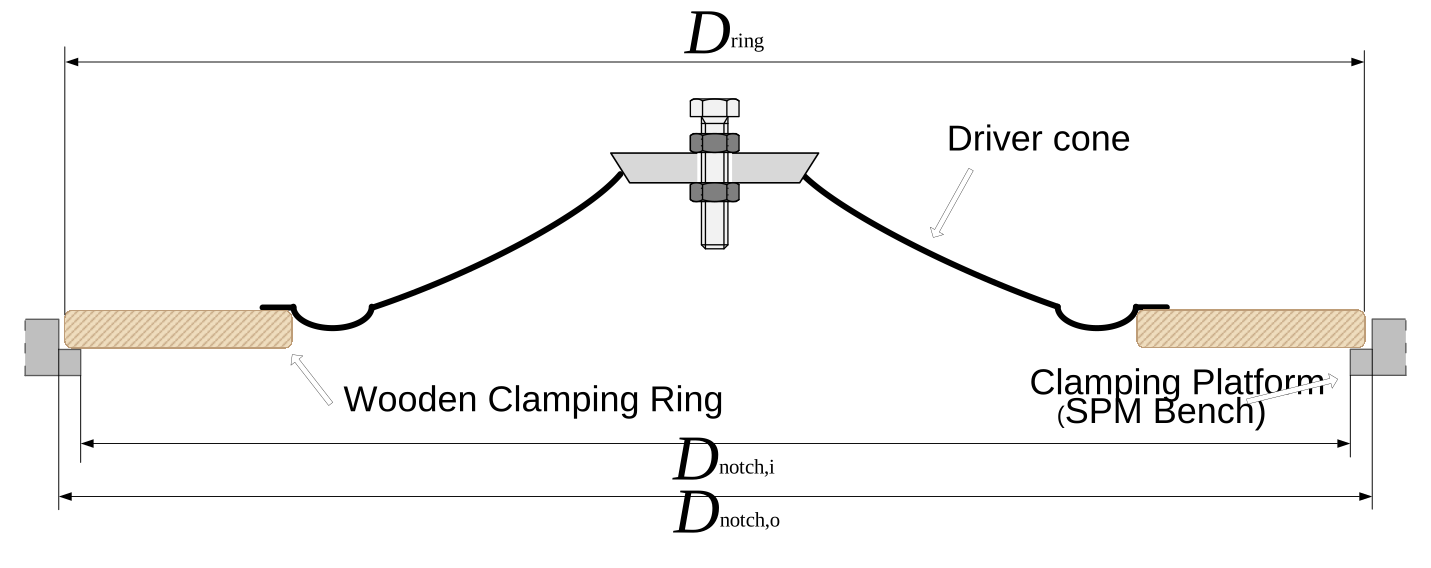
The following schematic provides the recommended dimensions of custom rings for the SPM Bench.
Alternatively, the ring may as well overlap with the clamping platform. In this case the SPM clamping levers should be used for fixation (see Custom Clamping on SPM Bench in the following section).
Attaching the Mounted DUT to the Test Bench#
Standard Ring Set#
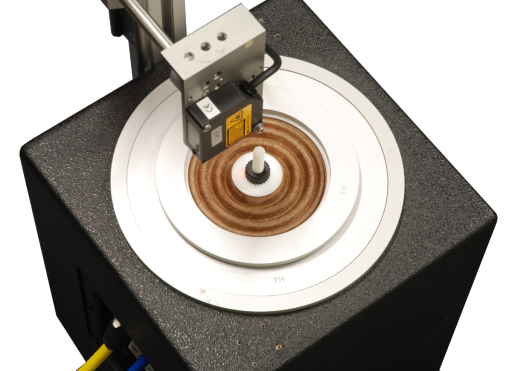
Once a suitable ring set has been selected, it can be attached to the LST or SPM Bench. The outer rim of the largest ring of each set (ring #5) fits the nut of LST Bench or the (inner) SPM clamping platform.
Custom Clamping on LST Bench#
Ideally, the diameter of the custom clamping platform should fit the notch of the LST Bench opening (similar to standard clamping ring set). In this case, additional fixation is usually not necessary.
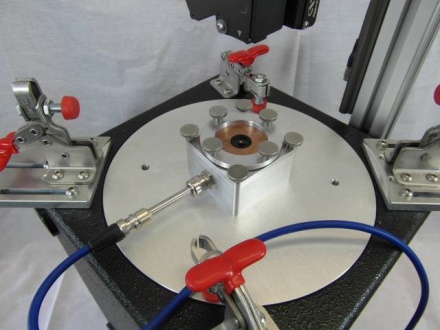
If the platform is larger, it should be clamped for reproducible conditions. The upper surface of the LST Bench provides threaded holes to attach additional clampers. The picture below shows an example setup (MPM application of KLIPPEL R&D System). Please contact support for more information.
Custom Clamping on SPM Bench#
Section Using Custom Clamping provides information about manufacturing custom clamping parts for mounting oversized or irregularly shaped DUTs.
As stated in Custom Rings for Oversized DUTs, a clamping ring can be designed to fit the notch of the outer rim of the clamping platform. In most cases, no further fixation is required.
For overlapping clamping parts, further fixation is required. The SPM clamping levers may be used for this purpose as shown below.
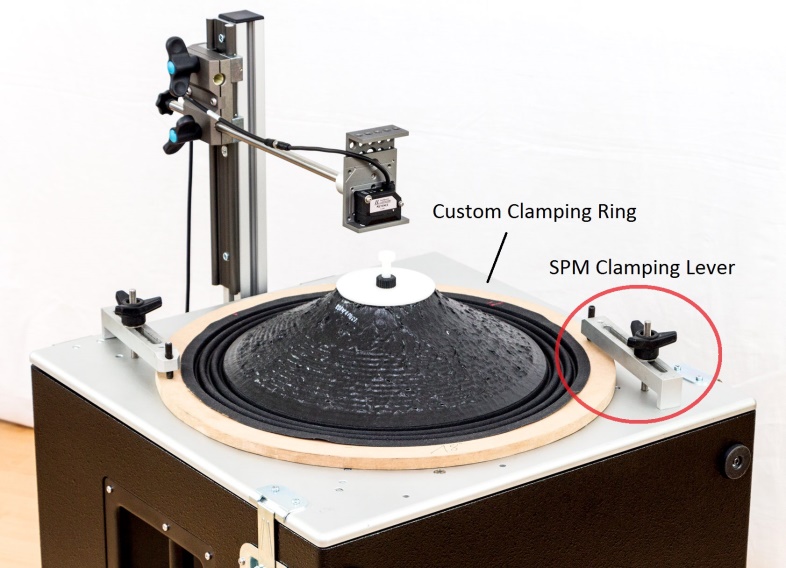
Find more information about installing the levers in section Setting Up the Test Bench.
Adjusting the Laser Position#
Warning
CAUTION LASER RADIATION! Avoid direct or indirect (e.g. reflection) exposure of human eyes to beam! The sensor used in the LST Bench uses a class 1 laser (IL-30). Exposure to the eye is not dangerous but should be prevented.
Preset Measurement Range#
After the first DUT is mounted to the LST Bench the proper measurement distance \(d_{\text{m}}\) to the laser displacement sensor needs to be adjusted. At rest position, the distance to the reflecting surface (e.g. hexagon screw head or DUT surface) should be centered in the working range of the laser sensor as shown below.
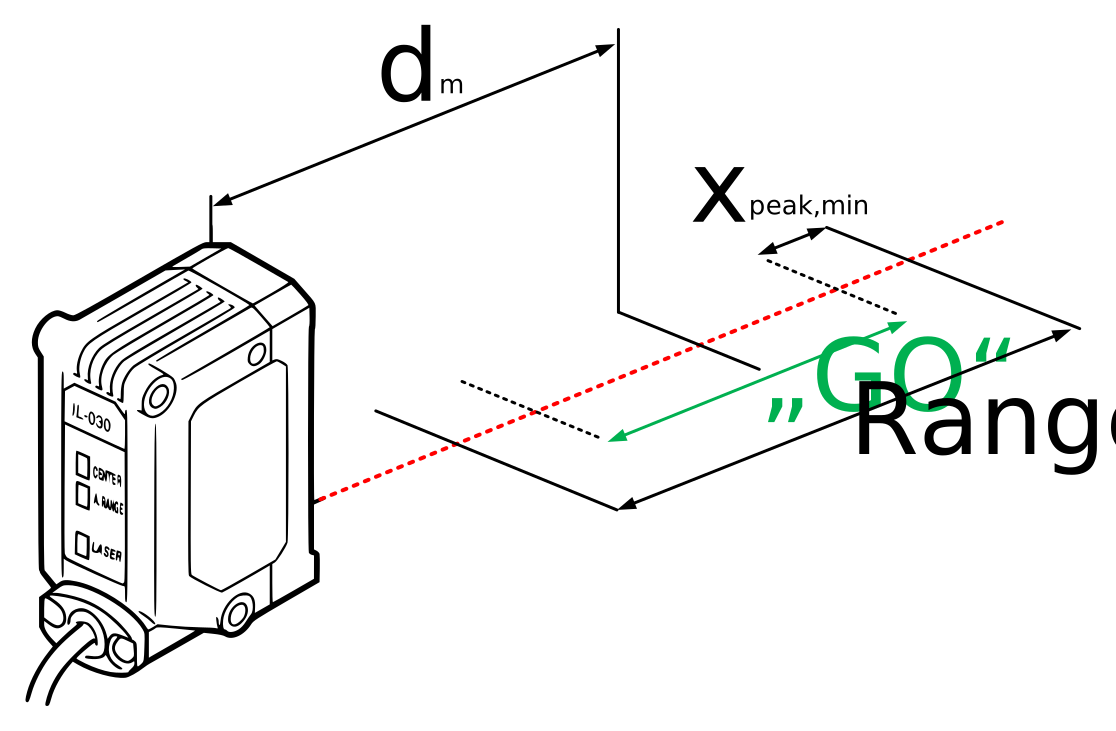
As long as the measurement distance is within the “GO” range the minimal dynamic peak excursion \(x_{\text{peak,min}}\) is guaranteed. The value can be found along with other information on measurement range of different laser heads in the table below.
IL-30 Sensor Head |
IL-65 Sensor Head |
LK-H52 |
LK-H82 |
|
|---|---|---|---|---|
Controller User Bank |
1 |
3 |
n/a |
n/a |
GO-Range in mm |
±8 |
±15 |
±0.5 |
±0.5 |
Full Range in mm |
±10 |
±20 |
±10 |
±18 |
\(d_{\text{m}} (x=0)\) in mm |
32.5 |
80 |
50 |
80 |
Resulting \(x_{\text{peak,min}}\) |
2 |
5 |
9.5 |
17.5 |
Note
To ensure a maximum AC signal range adjust the measurement distance close to the reference position (display value = 0) in the middle of the working range as shown in the schematic above.
How to Check the Laser Distance#
IL-Series#
The laser controller is provided preconfigured optimally for the LST (see Preset Measurement Range). The control LEDs (3) on the laser controller IL-1000 inform about the measurement distance. If the “GO” LED is lit green the current rest position is valid. The “HI” and “LO” LEDs indicate if the measurement distance is above or below the valid range. In this case the distance is out of the sensor range or the AC signal headroom is too small and clipping might occur.
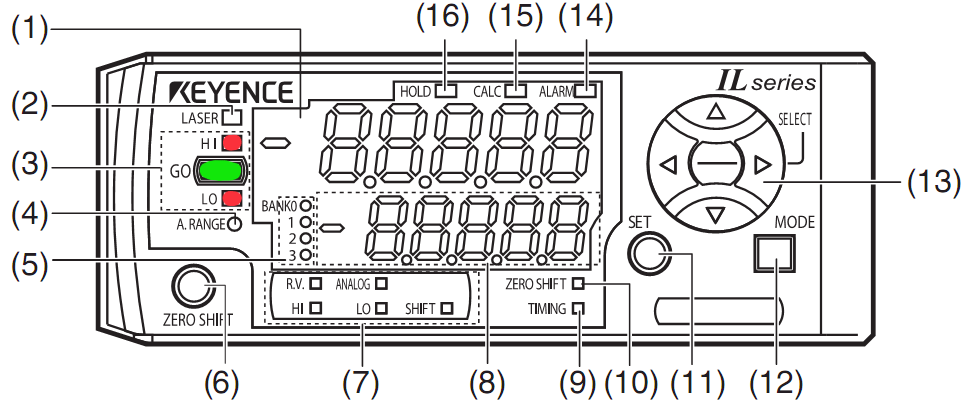
The number on the main display indicates the mismatch to the center of the sensor’s working range (reference position). Try to get this value close to zero for maximal headroom by adjusting the measurement distance.
Note
Do not change the preset laser controller settings. It is not necessary to edit any settings for operation.
LK-H Series#
For the LK-H laser heads, the laser range is directly indicated by an LED on the laser head. When the it is lit green, the laser is optimally centered, a flashing LED indicates that the distance is out of range. Find more information in KLIPPEL Analyzer Hardware manual section Settings and Status LEDs.
Adjusting the Distance#
Internal Laser Mounting#
LST Bench Rev. 1.0, 1.1#
There are two ways to vary the distance between the laser and the DUT, both are shown in the picture below.
For a rough variation the laser mounting plate can be shifted vertically on the fixture by removing the hand screws and remounting the plate using different holes.
For fine adjustment the hexagon screw of the inner clamping parts might be shifted relative to the cone by turning the screw. After adjusting the screw make sure that the nuts sit tight on the edges of the cone.
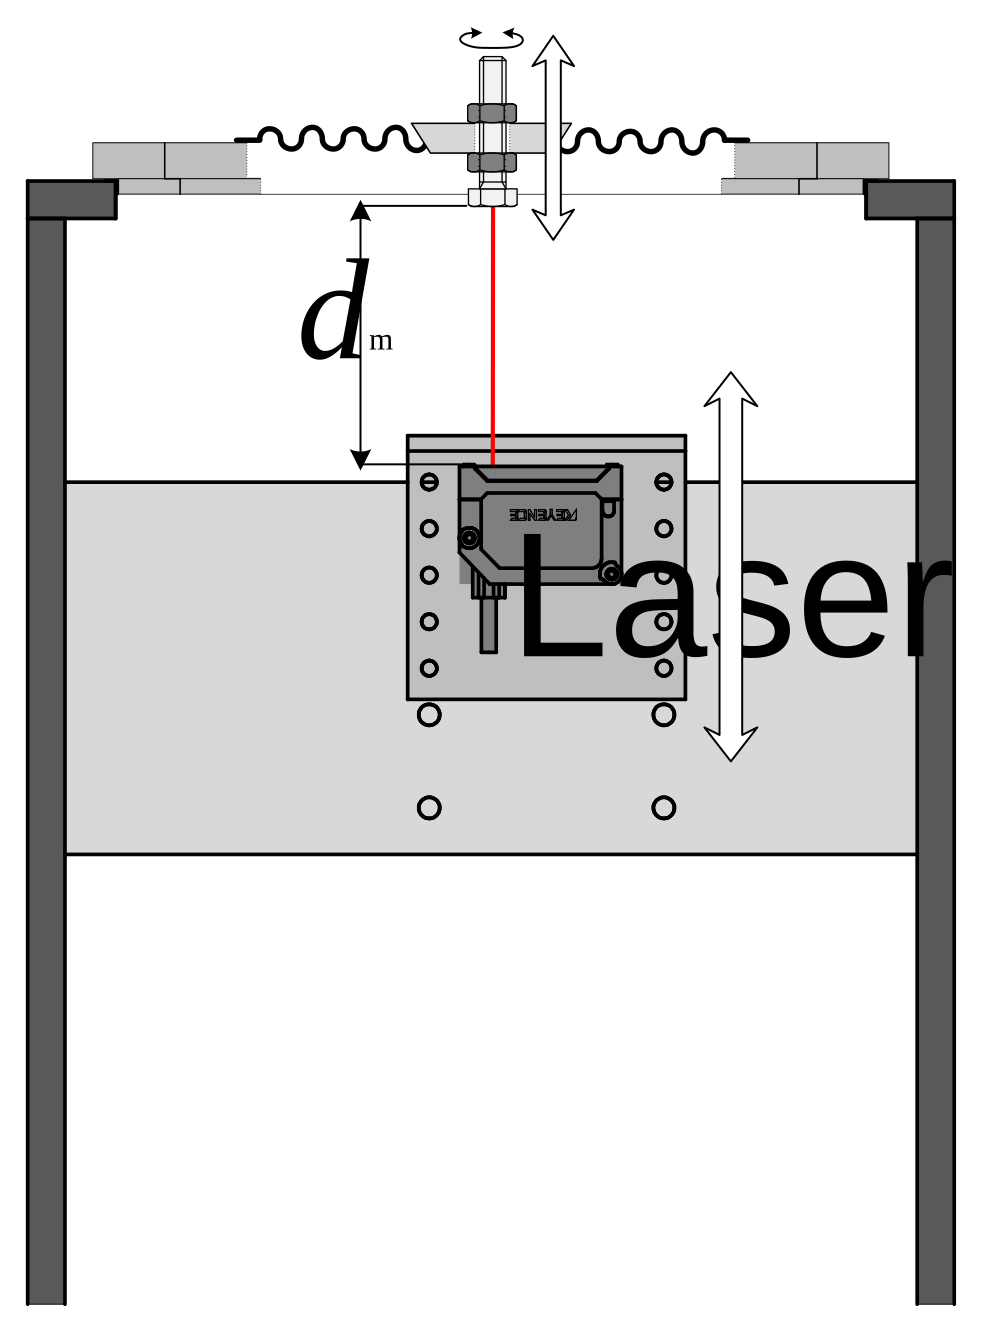
LST Bench Rev. 1.2#
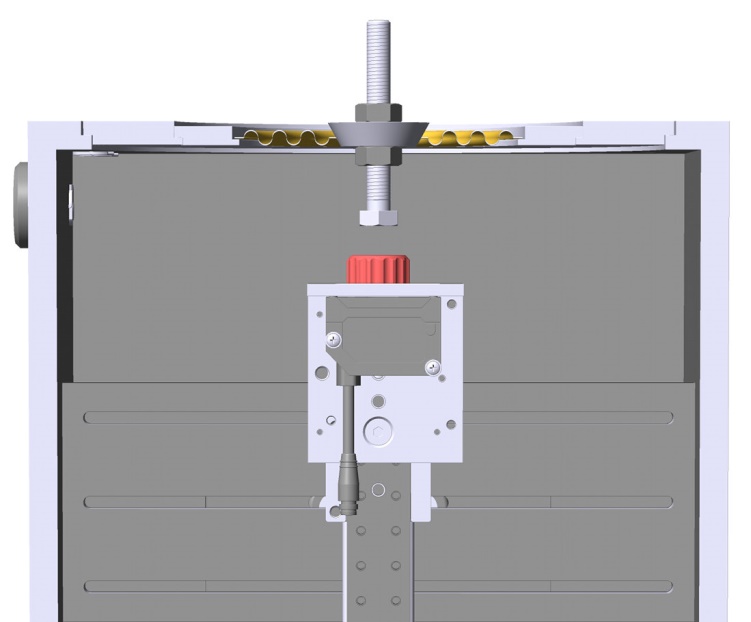
From LST Bench Revision 1.2, the internal laser mounting is more flexible. The laser distance can be adjusted continuously using hand wheel which is highlighted red in the picture below.
External Laser Mounting#
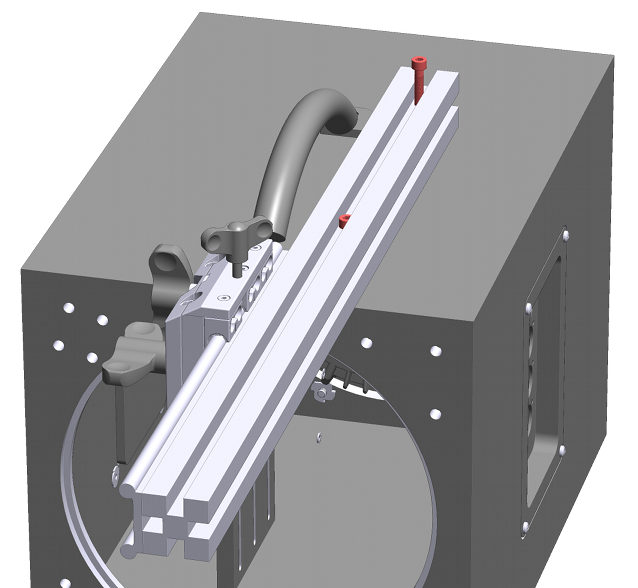
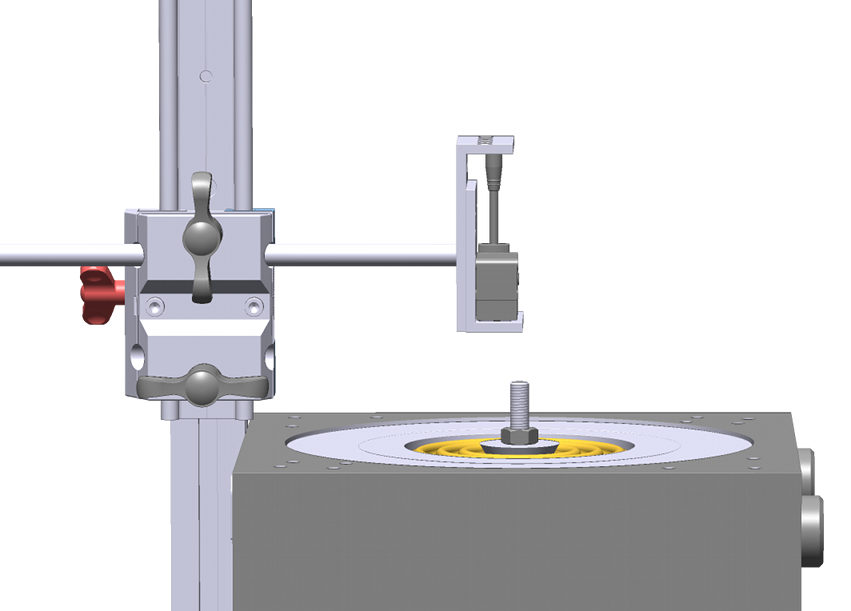
Adjusting the laser distance using external laser mounting is done by simply loosening the hand screw which is highlighted red in the picture below. The slider can now be shifted vertically until the desired laser position is achieved. Fasten the screw to fix the target position.
In case a LK-H series laser head is used and mounted on the translation stage, the distance may be fine adjusted by the millimeter screw of the translation stage.
Adjusting Horizontal Position#
Internal Mounting#
LST Bench Rev. 1.0, 1.1#
For older Versions of the LST Bench, there is no dedicated option for positioning the laser off-center. However, washers or tubes can be used as spacers to adjust the distance between the laser mounting plate of LST Bench and the laser platform.
LST Bench Rev. 1.2#
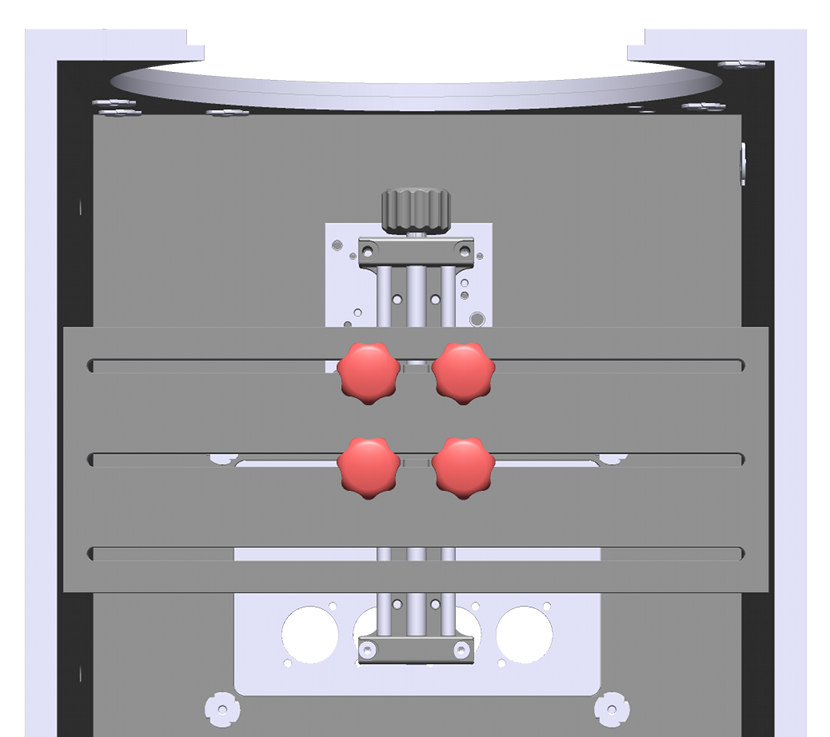
From LST Bench revision 1.2, the whole laser mounting unit may be positioned continuously on the horizontal axis. The four mounting screws can move freely in the mounting slits if unfastened as shown below.
External Mounting#
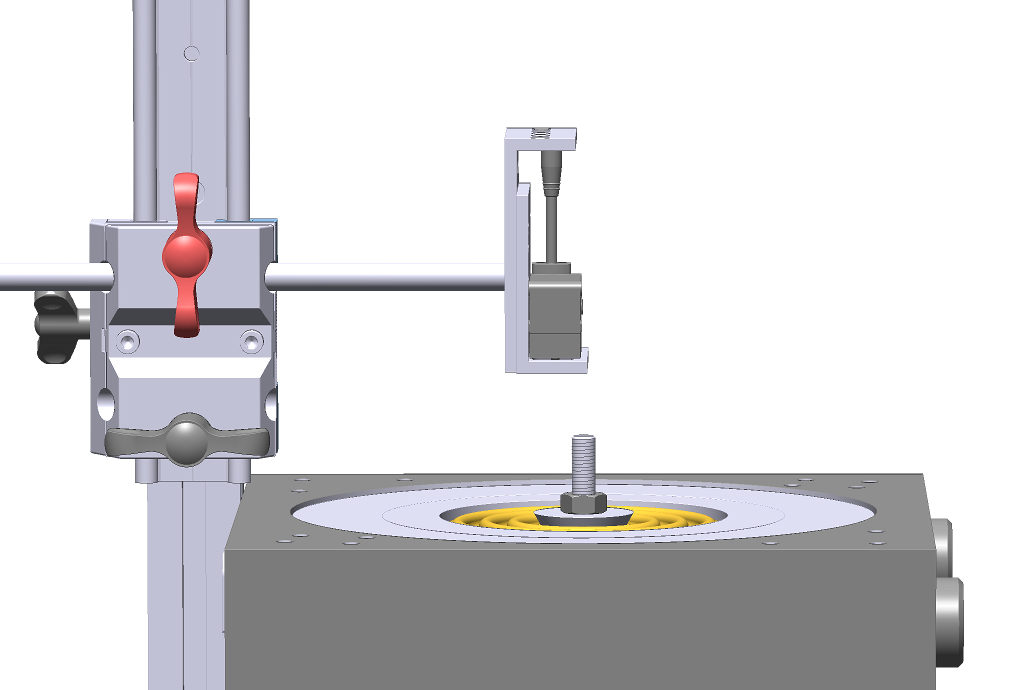
For adjusting laser center position using an external laser rack, just loosen the hand screw highlighted red in the picture below and slide the laser rod to the target position. Fasten the screw to fix position. Please make sure that the laser is not tilted, pointing directly at the DUT or inner clamping cone.
Note
In case the inner LST clamping cones are used, do not point the laser at the plastic bolt or nuts as they do not provide a homogeneous reflecting surface
Creating an LST Test#
As soon as the hardware is set up correctly and the DUT is attached to the LST Bench properly, a first LST measurement can be performed.
In the standard application the LST task is used stand-alone without other measurement tasks in the test sequence. Therefore, it is recommended to create a test based on an LST template.
Otherwise, you may add an LST task to your existing test sequence.
Using an LST Test Template (QC System Framework)#
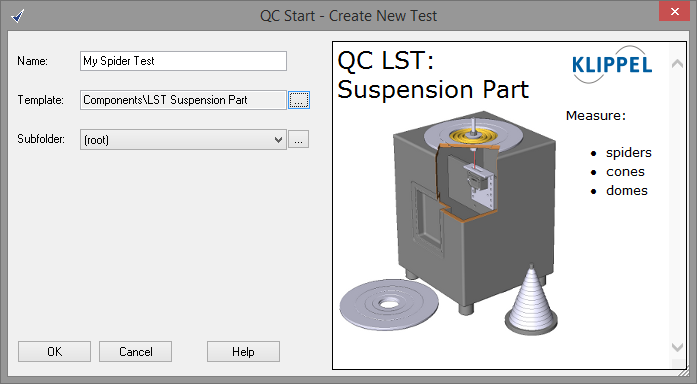
The easiest way to create a new LST test is using a dedicated LST test template provided by Klippel. Open QC Start Engineer and select New.. in Test menu to create a new test.
In the following dialog you may find LST templates for different applications in the template folder Components. Select a suitable template, define a name and click OK to confirm.
Note
Select the template based on your hardware setup. There are templates for both simple (laser only) and two-signal test method (laser + mic). Of course, the predefined template settings can be changed any time after login.
Using an Operation Template (R&D System Framework)#
If you are operating the LST within the KLIPPEL R&D System framework, you may add a test containing LST task by using the provided operation template
Create or open a KLIPPEL database
Add a new operation by using the operation icon or
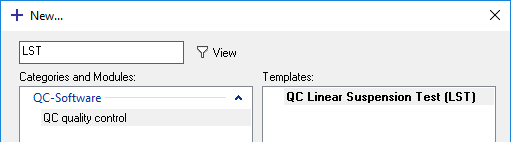
Select Categories and Modules: QC quality control and Template: QC Linear Suspension Test (LST) ); you may enter LST in the filter input field to quickly find the template
Choose a name and click OK to create a new QC operation
Click Run
 to log in
See dB-Lab Manual for more information.
Adding the LST Task#
When starting with an empty QC operation (e.g. Default test template), you may add the LST manually.
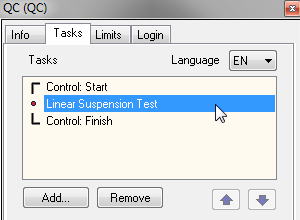
Start the QC Test, click the Add… button in the Task list to add a new task.
Choose the Klippel task script
lst.task.klb. The default location is:
%ProgramData%\Klippel\QC\Scripts\Klippel\QC\Modules
The LST will be added to the list of measurement tasks.
Note
Adding a new task always requires creating new reference units. You have to confirm that you want to delete all reference measurements, if limits exist in your test.
Performing a First Measurement#
This is a step-by-step guide about performing a first LST measurement using the standard setup for spider measurements.
After creating an LST test you can start with your first measurement. Select your new QC test in QC Start Engineer and click Start to open the test.
Your First LST Measurement#
For the first measurement the default stimulus settings should be working for a wide range of DUTs. The frequency range and voltage settings might be optimized in the next step.
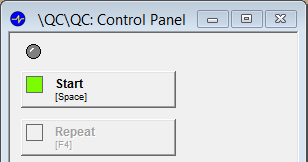
Click on the green Start button in the control panel to start your first measurement.
Basic Settings#
In QC Engineer mode select the LST Task on the property page Tasks and edit the test settings.
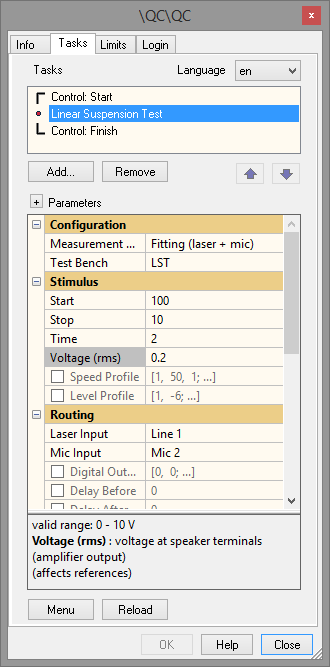
In the following paragraphs, the basics settings are explained which should be adjusted along with your first measurement.
Measurement Method#
The most important setting to be considered before starting your first measurement is the Measurement Method. This setting depends on your hardware setup and affects the internal signal processing and calculation methods. If your test is based on a test template, the correct setting should be set already.
Select Simple (see Simple (One Signal Method)) mode if only displacement shall be measured. In case you have attached an additional microphone to the test bench, select mode Fitting (laser + mic) (see Fitting (Two Signal Method)) for improved robustness and accuracy.
Time#
This parameter specifies the stimulus duration and thus measurement time. The optimal setting depends on the selected frequency range of the stimulus and the characteristics of the DUT. If the stimulus time is too short the resonance might not be excited properly or the displacement magnitude curve might be rippled.
The default value is a good starting point, for the first try you may increase test time for best accuracy. Later on, this value may be optimized for minimizing test time.
Frequency Range (Start, Stop)#
These parameters determine the frequency range of the logarithmic sine sweep stimulus. The excitation frequency range should be set around the resonance frequency of the clamped DUT. For LST Pro mode the upper frequency should be at least double the resonance frequency. See Finding the Optimal Stimulus Frequency Range for details. The preset value is a good starting point in order to find the DUT’s resonance frequency range.
Voltage#
Here the RMS voltage of the sine sweep signal is specified. The LST is designed for small signal testing focusing on linear parameters. Therefore, a low excitation level is desired to drive the DUT in the small signal domain while ensuring a sufficient signal-to-noise-ratio in the displacement (and microphone) signal. Warnings are generated if the SNR is critically low.
If the voltage is set too high the gravity-held clamping parts or the DUT might start to move in an irregular way (jumping) which falsifies measurement results. Warnings are generated in case of poor results.
Warning
A too high voltage may damage the built-in speaker of the test bench!
Moving Mass#
To obtain the stiffness/compliance from the resonance frequency of suspension parts, the total moving mass (DUT + inner clamping parts) needs to be specified. For suspension parts, it is assumed to be dominated by the inner clamping parts and therefore treated as a constant value for one DUT type.
Please refer to Definition of Input and Result Parameters for more information about the measurement principle.
Normally the mass is defined by the selected mounting cone due to geometrical restrictions. Follow the instructions in section Inner Clamping to estimate the moving mass using the look-up tables.
Note
The attached mass influences the resulting effective resonance frequency and Q factor of the complete resonator directly. Therefore, changing mass may be used to tune the resonance frequency in case it is too low or too high for successful measurement or excitation. Moving Mass parameter may be specified and changed even after measuring reference units. Only the limits have to be recalculated in this case (measurement is blocked until this is done).
Viewing LST Results#
Summary Window#
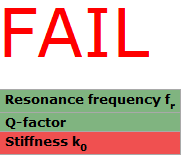
The Summary window shows the main results measured by the LST task. The screenshot below is taken from a measurement performed with limits. It directly shows whether the DUT passed or failed the tests. To pass the test means that the measured parameters are all within the defined limits. In case any of the above-mentioned measures failed the corresponding label will be highlighted red.
See Measurement with Limits for creating own limits.
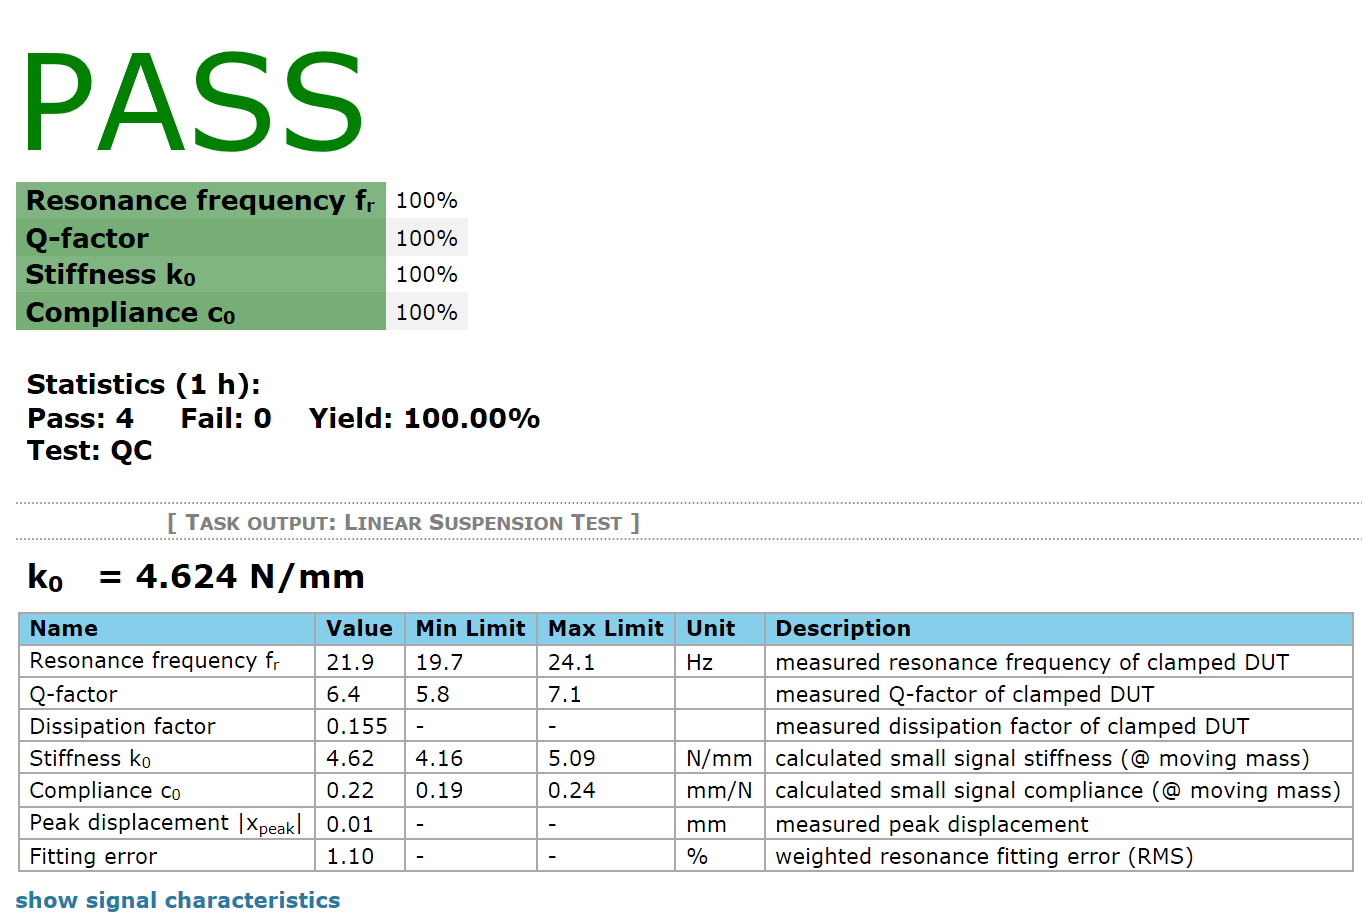
The most important results are (LST Lite):
- Resonance Frequency \(f_{\text{r}}\)
The resonance frequency is the eigenfrequency of the mass-spring-system which consists of the DUT and the inner clamping. The transfer function of excursion and sound pressure is maximal at this frequency. In case only displacement is measured, resonance frequency is determined at the frequency of max excursion. Res. Frequency is determined by the suspension stiffness and the total moving mass.
- Q-Factor
This quality factor represents the –3 dB decay of the resonance curve.
- Stiffness \(k_{0}\)
This measure represents the small signal stiffness of the suspension part. It is derived from the resonance frequency \(f_{\text{r}}\) and the moving mass \(m\).
- Compliance \(c_{0}\)
Compliance \(c_{0}\) is the inverse of the stiffness.
See the Definition of Input and Result Parameters for further details.
Warning
The estimated moving mass is an input parameter for the measurement. Therefore, it is assumed constant. The accuracy of the mass directly influences the stiffness value.
Displacement Transfer Function#
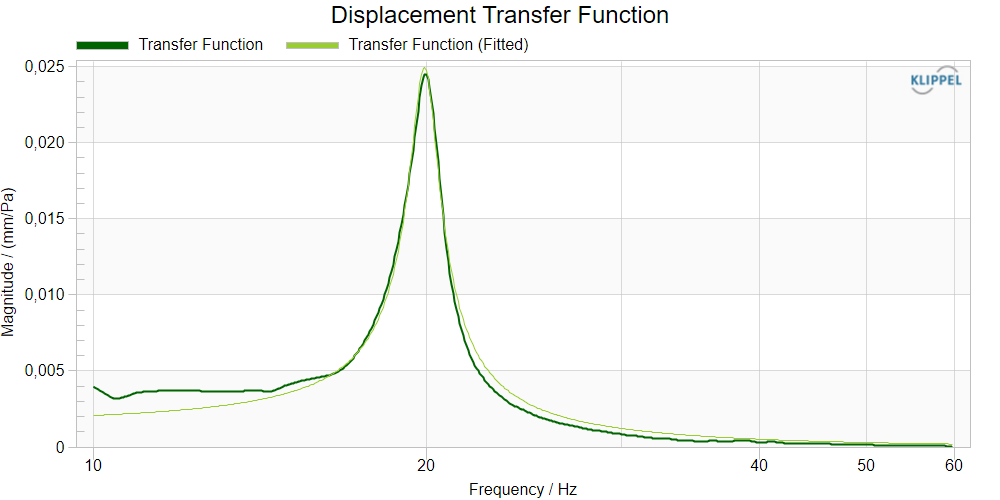
The primary measurement result is displayed in Displacement Transfer Function window. Depending on the selected Measurement Method (Simple or Fitting) the displayed curves are determined in a different way.
In case only displacement is measured (Simple mode) the measured curve represents the transfer function of displacement and excitation signal (incl. level profile). The curve itself is not a dedicated measure to apply limits to. However, the resonator parameters (resonance frequency, Q factor) are derived from this curve.
For Measurement Method - Fitting the Measured (dark green) curve represents the transfer function of measured displacement and sound pressure vs. frequency. A second curve (light green) is displayed which represents the modeled curve based on the fitted resonator parameters. In case of successful parameter fitting and reasonable signal quality, both curves should match well. The Fitting Error displayed in the result table also evaluates the fitting performance (deviation) as a single value error.
Note
The transfer function curve should be used to find the optimal frequency range for your test or to identify signal problems due to wrong excitation level. These issues will be discussed in the sections Finding the Optimal Stimulus Frequency Range and Setting the Stimulus Amplitude.
Testing with Limits#
In QC Engineer mode the user is enabled to set tolerance limits for the LST test using Limit Calculation Mode.
While this mode is enabled each measured and selected device will become a reference. Relative limits may be derived from these reference units. Alternatively, absolute limits are supported as well.
Note
If you use QC Basic version, only one reference unit can be measured.
After limit definition, the measurement results of each DUT are checked against these limits to generate a PASS / FAIL test verdict.
Measurement with Limits#
Open a test in Engineer mode and choose proper setup parameters.
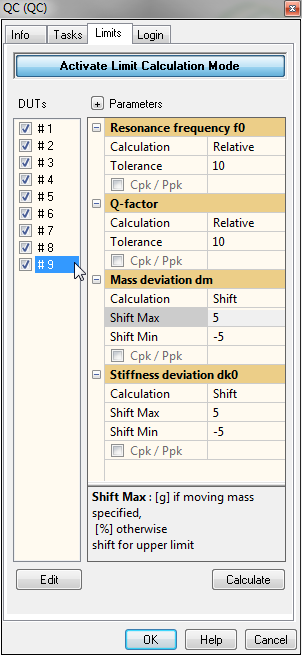
Select Limits tab in Properties window and click Activate Limit Calculation Mode.
Now start the measurement by clicking the Start button in the control window. An arbitrary number of reference units/measurements can be collected, as long as the Limit Calculation Mode is activated.
In this example three units are measured.
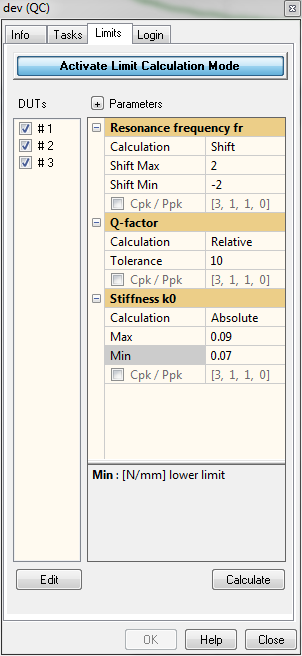
When the number of reference units is sufficient, deactivate the Limit Calculation Mode by clicking Activate Limit Calculation Mode again or press Calculate. The tolerance limits for valid DUTs are now calculated according to the Parameters and displayed in the Summary window as shown below.

All following measurements will be checked against these limits.
Reference DUT Check#
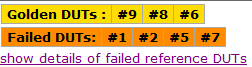
To ensure the validity of the calculated limits and to identify outlier units, all reference DUTs in the pool are checked against the calculated limits automatically after calculating limits. In case any reference DUT fails the check, the Summary window shows additional information as shown below.
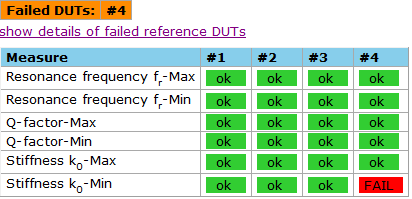
All failed reference DUTs are listed. To identify the failed measure a table (accessible via link) shows the single verdicts. To solve conflicts, go back to Limit Calculation Mode and either remove the concerning reference unit from the reference DUT list or readjust the limit calculation settings.
Testing Your First Device#
Once you have created limits, you may test DUTs against those.
If the results are within the tolerances, all tests will be passed and the Summary window will show a PASS overall verdict.
If the measurement result violates the tolerance range, the relevant measure will be highlighted red in the Summary window. This results in an overall FAIL decision.
Changing the Limits#
In the LST Lite limits for the following measures can be defined:
Measures and Limit Calculation Modes#
- Resonance Frequency
relative, shift, statistic, absolute
- Q-Factor
relative, shift, statistic, absolute
- Stiffness
relative, shift, statistic, absolute
- Compliance
relative, shift, statistic, absolute
- Nominal Resonance Frequency
relative, shift, statistic, absolute
- Federzahl
relative, shift, statistic, absolute
Types of Limits#
- Relative
Tolerance is the percentage the measured parameter may differ in positive or negative direction in relation to the average value of the reference units
- Absolute
Gives absolute values for the lower (=min) and upper (=max) limit. This value is independent from the average value of the reference units.
- Shift
The shift value is added to the average value of the reference units for the upper limit and subtracted to calculate the lower limit.
- Statistic
Sigma is the standard deviation factor for a uniform distribution of measurement values. Statistic limit calculation is only reasonable for more than one measured reference limit.
For additional information about limit calculation mode see Limit Calculation.
Working with LST Pro#
The functionality described so far complies with the basic version of the LST. It meets the requirements for testing loudspeaker suspension parts like spiders and cones. The dominant characteristic of these devices is the mechanical compliance/stiffness and the total (clamped) moving mass may be assumed constant.
For testing devices like passive radiators this assumption is not true because these devices are complete resonators with an inherent moving mass and stiffness which may both deviate from specification. Usually no additional mass is attached (no inner clamping). The stiffness \(k_{0}\) according to the LST Lite assumes a constant known moving mass. Therefore, the principle cannot be applied here.
For simple quality control and consistency check, monitoring only the resonance frequency and Q factor can be sufficient. However, the root cause of result deviation (mass and/or stiffness) cannot be identified. For this reason, the LST Pro version offers more sophisticated processing to monitor both mass and stiffness deviation relative to the “golden” reference unit (Golden Unit).
The following section focuses on working with the additional features offered by the LST Pro.
Note
Activating the LST Pro requires a separate license.
Measurement Principle#
In contrast to LST Lite the Pro mode is based on a relative measurement principle which requires a dedicated reference unit (usually Golden Unit). Mass and stiffness variation is determined relative to this reference unit instead of absolute values.
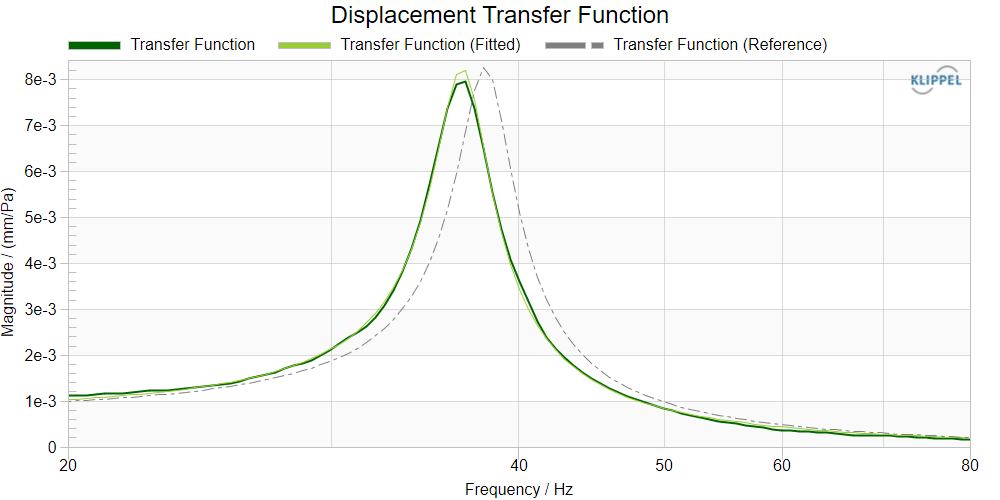
Depending on the selected Measurement Method , the parameter deviation is either calculated from the relative displacement frequency response (Simple mode, using laser only) or the relative transfer function as shown above (Fitting mode, using laser + mic signal).
Although both modes are supported using Fitting mode is highly recommended as it is much less susceptible to input signal quality (SNR) problems.
Note
The reproducibility of the measurement results for mass and stiffness deviation are determined by the reproducibility of the measurement conditions, such as clamping and climate. LST Pro is not recommended for measuring porous test objects with a low or varying flow resistance (varying sealing). This includes suspension parts like spiders without impregnation. For monitoring climate changes an additional temperature/humidity sensor is available.
LST Pro Features#
In case an LST Pro license is installed, two additional measures will be unlocked:
Stiffness Deviation
Mass Deviation.
The table below gives a short explanation of the additional parameters measured. See section Mass and Stiffness Deviation (LST Pro) for further details.
- Stiffness Deviation \(\Delta k_{0}\)
This relative measure represents the total stiffness deviation from the golden reference unit.
Note
If no moving mass (of Golden Unit) is specified the deviation will be given in % percent instead of N/mm. Mass Deviation \(\Delta m\)
This relative measure represents the total moving mass deviation from the golden reference unit.
Note
If no moving mass (of Golden Unit) is specified the deviation will be given in % percent instead of g.
Limits for these measures can be defined using the following calculation modes:
Shift
Statistic
Absolute
Please refer to Changing the Limits for details on limit calculation modes.
Performing an LST Pro Measurement#
Selecting a reference unit
A dedicated reference unit with a known moving mass is required for determining relative mass and stiffness deviation. The reference object may be:
an arbitrary unit (with known moving mass),
a device that best meets the R&D specifications or
a unit that is close to the ensemble average of a batch of units.
To become an LST reference unit, the selected device simply has to be measured as a reference DUT in the Limit Calculation Mode according to Measurement with Limits.
If multiple reference units are measured, the Golden Unit is automatically selected and displayed in the summary window after limit calculation as shown below:
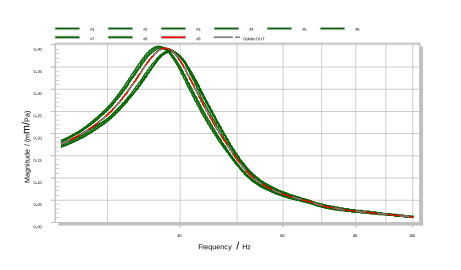
In this example unit #9 best represents the ensemble average with respect to the transfer function magnitude. This can be checked viewing the corresponding curves in Displacement Transfer Function window.
The automatically selected Golden Unit is used as the new reference. The values in the limit table are already related to this unit as shown in the screenshot below. Consequently, the deviation values for unit #9 equal 0 %.

Note
Measuring multiple reference DUTs and Golden Unit selection is a QC Standard feature and is not available if the LST is used with QC Basic license.
Measurement Results#
Once a reference unit is available the LST Pro measurement can be started. The screenshot below shows the Summary window of an LST Pro measurement.
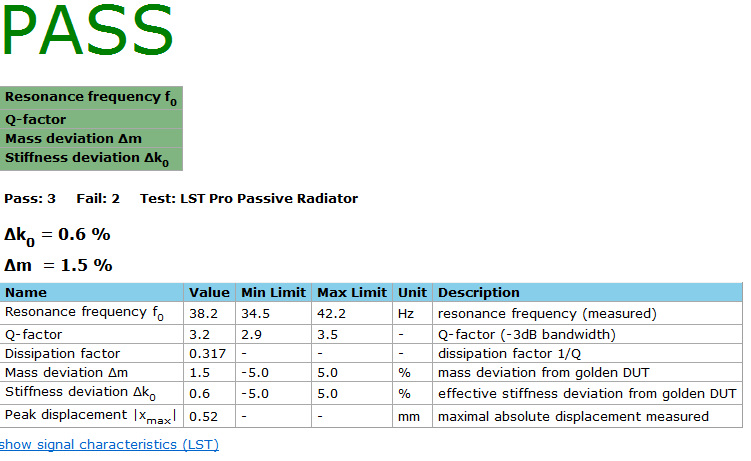
Measuring absolute quantities#
Entering the total moving mass (parameter Moving Mass) of the Golden Unit allows measuring mass and stiffness deviation in absolute quantities (g and N/mm) instead of percent.
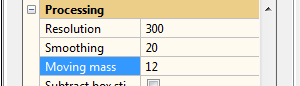
The moving mass can be entered any time without discarding the reference units and limits. Simply follow the instructions in the Summary Window and recalculate the limits, otherwise the measurement is blocked.

Note
Consider also changing the limit parameters for mass and stiffness deviation as the specified values now refer to the absolute quantity instead of the percentage.
As shown below the measurement results are now determined in absolute quantities. The result table contains two additional entries representing the estimated total moving mass and total stiffness of the measured unit.
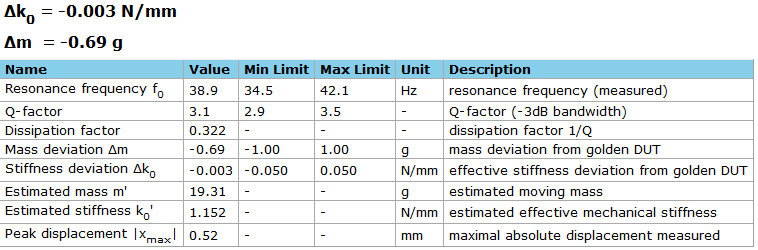
Note
Due to the relative measurement principle the absolute total values for moving mass and stiffness can only be estimated. They are derived from the entered Moving Mass and thus depend on the accuracy of this value.
How to Determine the Moving Mass of the Golden Unit#
A common method to determine the absolute moving mass \(m\) of a 2nd order mechanical oscillator is the added mass method. Attaching an additional mass \(\Delta m\) to the DUT leads to a resonance frequency shift from
to
Assuming constant stiffness the initial moving mass can be estimated from this shift using the derived equation
Note
The added mass method can be performed automatically using the SPM Lite module of the KLIPPEL R&D System. The total moving mass determined with the added mass method also contains the mass of air load of the DUT. For large test objects this value may be a significant addition to the structural mass.
Calibrating the LST Measurement and Limits#
Motivation#
Depending on the material and geometry of the test object the measured parameters may vary significantly with changing climate conditions like ambient temperature. The consequent parameter drifts (stiffness, resonance frequency) are systematical.
The influence of these effects should be minimized for reproducible QC testing. Especially the LST Pro requires reproducible measurement conditions due to the relative measurement principle. This includes climate influence and other aspects influencing the validity of the reference measurement (Golden Unit). For this reason, calibrating the measurement with the Golden Unit should be performed frequently (e.g., beginning of a test session), especially if drifts due to ambient conditions are visible.
The LST offers temperature monitoring using the temperature and humidity sensor which is available for QC System. Please refer to Monitoring Environmental Conditions for more details.
Activating Limit Calibration#
Limit Calibration is a general feature of QC Standard and has to be activated in the Control:Start task properties Configuration – Allow Limit Calibration.
A new button will now be available in the Control Panel.
Note
Limit calibration is not available with QC Basic license.
Performing Limit Calibration#
The calibration is performed by pressing the Calibrate Limits button in the Control Panel. A message box is displayed instructing the Operator to connect the Golden Unit. The measurement is started instantaneously after terminating the message box.
The limits are adjusted and the measured displacement magnitude works as the new reference for calculating mass and stiffness deviation in LST Pro mode.
Find more information about Limit Calibration in the QC User Manual.
Free Air Measurement#
In some cases (e.g. free air resonance testing) it may be required to perform a measurement bypassing the internal air volume of the LST Bench.
As stated in section Test Bench Impact on Results the measurement bench may influence the measurement results depending on the test object. To minimize these effects, the DUT may be mounted under free air conditions.
Note
It is necessary to increase the stimulus voltage as the driving force and thus the displacement amplitude is lower compared to direct box mounting.
LST Bench Rev. 1.0-1.1#
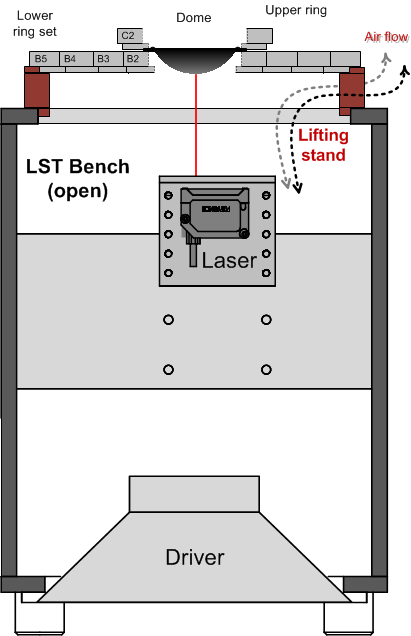
As shown in the schematic below, lifting stands can be used to raise the clamped DUT (incl. rings) above the opening of the LST Bench. Thus, the box volume is bypassed. However, the driving force for the test object will be decreased significantly.
LST Bench Rev. 1.2 and SPM Bench#
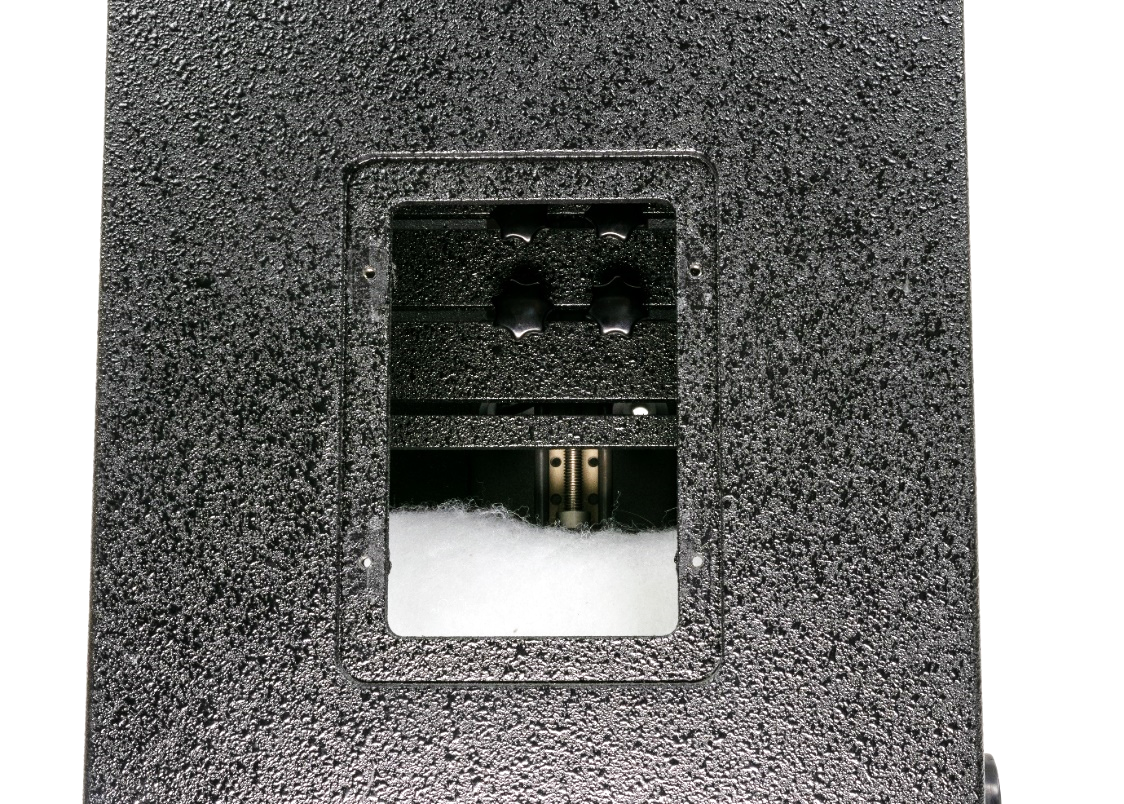
From LST Bench Revision 1.2 there is a dedicated removable plate at the side of the bench. Quasi free-air conditions can be achieved by removing the plate as shown below.
Testing Small Parts with MSPM Bench#
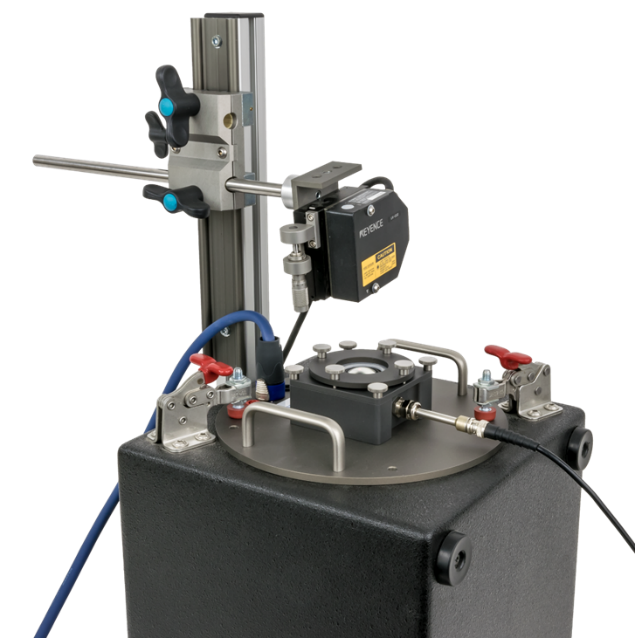
The MSPM Bench is dedicate to testing small speaker membranes (headphone, micro-speaker) before assembly. It can be used as an extension for the LST Bench with external laser mounting.
The main application of the MSPM Bench is related to lab tests in R&D using the MSPM Lite or Pro software of the KLIPPEL R&D System. However, the LST software does also support this test bench.
Note
DUT mounting is crucial for reproducible and meaningful results. In many cases, the DUT needs to be glued to the sample tray which is time consuming and may be non-reversible. Therefore, using MSPM Bench for EoL testing purposes is only possible in a limited way.
For settings up the MSPM Bench, please refer to section MSPM Extension for LST Bench.
Preparing the DUT#
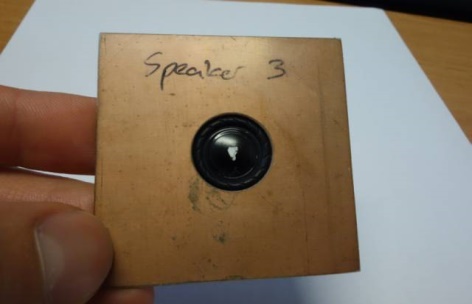
First, the DUT needs to be glued onto a stiff custom tray plate with dimensions of 55 mm by 55 mm (e.g. PCB material).
Although the used technique can cope with significant air porosity of the membrane the area between plate and membrane should be as sealed as possible due to the pneumatic excitation and the necessary high sound pressures.
The forming and gluing of the membranes influence the results significantly. It should be homogeneous and reproducible to get reliable and reproducible data.
Attaching the DUT Tray to the MSPM Bench#
Unscrew the clamping ring from the enclosure. Place the DUT tray on the platform. Fix the DUT between the two mounting parts using the four screws.
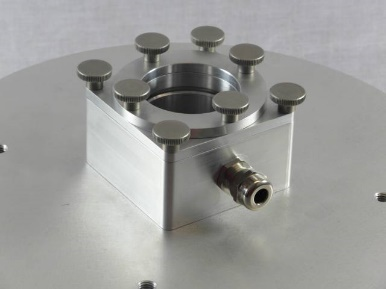
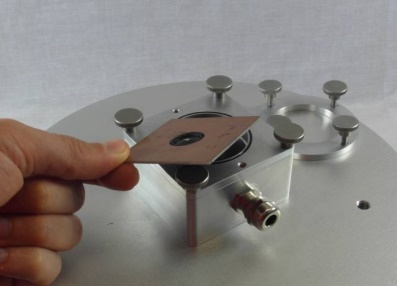
Direct the laser beam to the center of the membrane. Adjust the laser position so that the laser is in its center position.
Optimizing your LST Task#
Finding the Optimal Stimulus Frequency Range#
Background#
The LST Basic mainly focuses on the resonance frequency of the measurement object. Therefore, the selected stimulus frequency range has only minor impact on the measurement results, as long as the resonance peak (and main decay) lies completely within the excited frequency band.
For mass and stiffness separation, the LST Pro mode focuses on the decay of the resonance curve above resonance. For this reason, a wider frequency range is required.
In addition to the discussed issues, the frequency range has a significant influence on the required final measurement time (time-frequency-ratio). Please refer to Making the Measurement as Fast as Possible for more information on timing issues.
How to Set the Frequency Range#
Setting up a test for a new device the resonance frequency of the clamped DUT is usually unknown. In the first step a measurement with a wide frequency range should be performed to spot the frequency range where the resonance occurs.
Note
The Manual Sweep real time analysis can be used to find the resonance frequency as well. Please refer to QC User Manual for more information about using the manual sweep.
After the resonance frequency is tracked, the sine sweep should be band limited for an optimal frequency-time-resolution. A good recommendation is setting the start and stop roughly one fifth (2/3 \(f_{\text{r}}\) to 3/2 \(f_{\text{r}}\)) up to one octave (1/2 \(f_{\text{r}}\) to 2 \(f_{\text{r}}\)) relative to the average resonance frequency.
For the LST Pro the upper frequency should be at least 2.5 \(f_{\text{r}}\).
Note
Errors are generated if the frequency range is not sufficient for the analysis.
Sweeping Up or Down?#
At high levels nonlinear effects cause instabilities in the displacement response of the suspension part. The actual resonance frequency may be passed if the sine sweep is performed from high to low frequencies. This effect does not occur at low amplitudes so the sweep direction may be chosen freely for suspension parts.
However, the LST Pro focuses on the frequency range above the resonance frequency. As post-ringing may occur after the resonance is passed it is beneficial to sweep downwards measuring passive radiators.
Note
In case the resonance curve shows distortion, which cannot be solved by adjusting test time or level, try changing the sweep direction (swapping fmin and fmax).
Setting the Stimulus Amplitude#
General Comments#
There is no general recommendation for setting the stimulus amplitude as the characteristics of the test object have a major impact on this parameter and may differ significantly among different geometries, materials and mounting methods (closed box vs. free air). Highly porous spiders (low flow resistance) for instance usually require a higher stimulus level compared to impregnated ones or passive radiators to achieve the same displacement.
The main parameter to focus on is the peak displacement which is shown in in the results table in Summary Window.
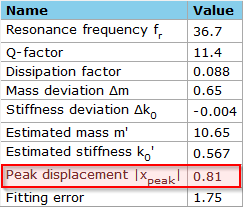
The peak displacement should normally not exceed 0.1 mm to stay in linear operation range. In case Measurement Method – Fitting is used, also the Fitting error (also displayed in the result table) is a good indicator for result quality. It should be low for good agreement of modeled and measured response (< 10 %).
Note
Peak displacement is only displayed if the lase Line input is calibrated as a laser input. Make sure that the correct laser head is selected in the calibration properties. Find more information in section Sensor Calibration.
Apart from the peak displacement also the result curves can be taken into account for judging signal quality. The picture below shows a Transfer Function response for optimal stimulus settings. It is smooth and shows good matching with the fitted curve.
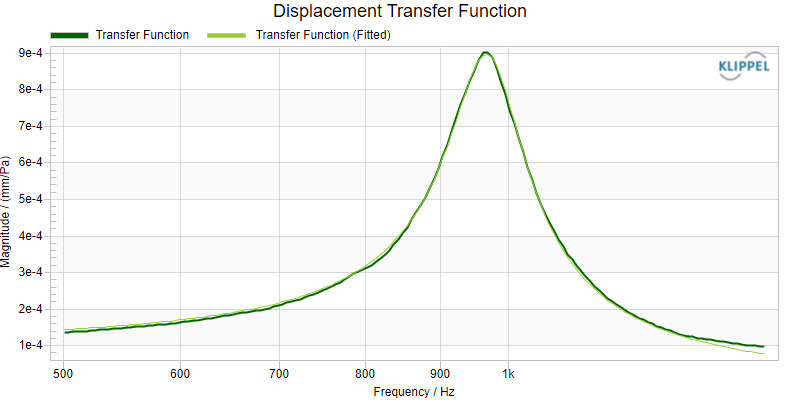
The lower limit for stimulus voltage is defined by the noise floor of the used sensors. If the displacement is too low, the measured signals will be noisy.
In this case you may also check result windows Displacement and Sound Pressure Frequency Response (if microphone is used). The magnitude should always be above the noise and distortion curve (THD+N) as shown below.
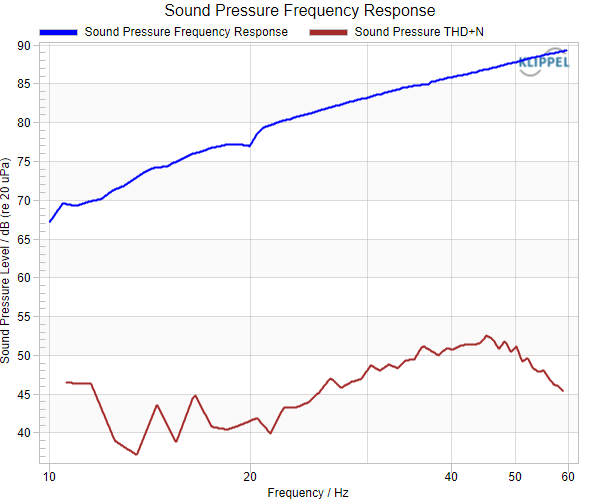
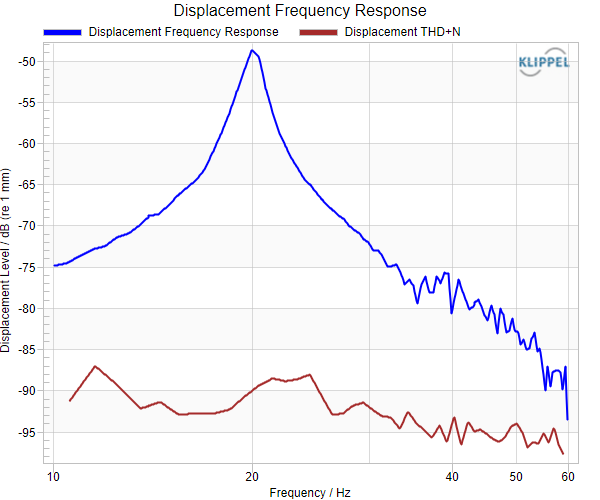
Note
Warnings are generated if the SNR of the input signal is too low.
Level Too Low#
Generally, the stimulus level should be as low as possible to drive the DUT in the linear range. At the same time sufficient SNR of the displacement (and microphone) signal must be achieved.
If the displacement is too low, the magnitude response will be dominated by noise as shown in the example below.
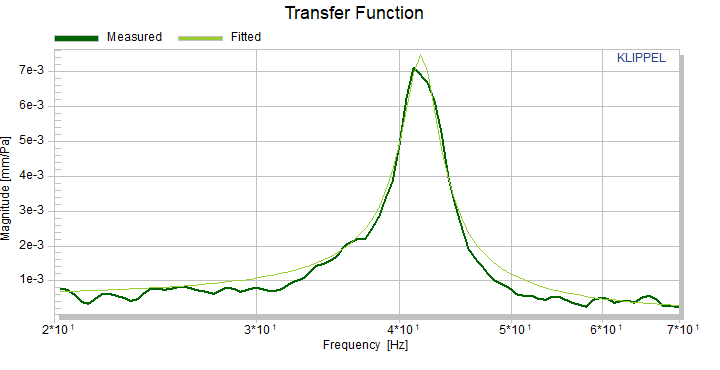
Warnings are generated, if SNR is too low to ensure reliable results

You may check Sound Pressure and Displacement windows to check whether the general signal to noise ratio is bad or if single frequencies are disturbed (e.g. due to ambient noise).
Level Too High#
There are various constraints limiting the maximal excitation voltage.
The linear parameters measured by the LST are defined in the small signal domain. Therefore, the peak displacement of the DUT may not exceed a critical value to guarantee linear conditions. This value depends on the DUT, but in general 1 mm is a good recommendation for max. peak displacement.
The picture below shows the nonlinear stiffness curve Kms(x) of a spider measured with the SPM Pro of the KLIPPEL R&D System. It clearly shows how stiffness increases at higher amplitudes.
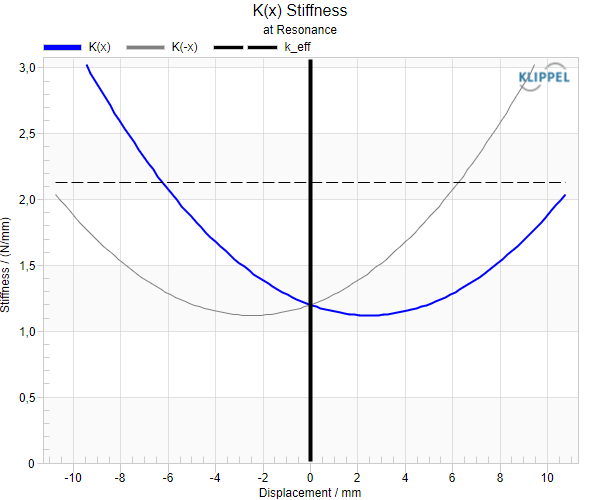
At too high amplitudes the displacement magnitude may show nonlinear distortion artifacts or distortion due to irregular movement.
Especially for suspension parts that are mounted with low additional weight, the amplitude is usually limited by gravity as the inner clamping parts (cone) may start jumping if the level is set too high.
The window below shows a distorted transfer function magnitude at high amplitudes. No clear resonance peak is detected in this case. The agreement with the fitted curve is poor.
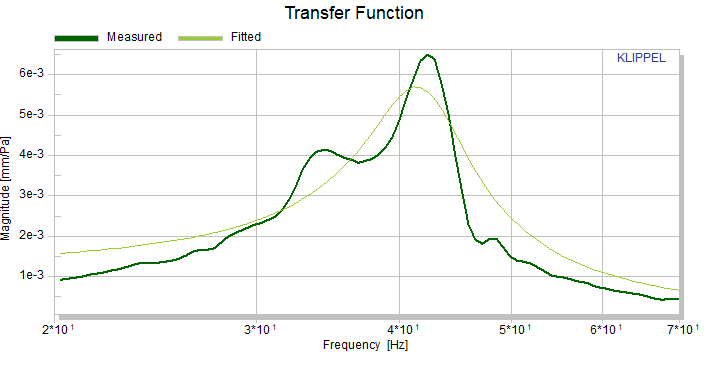
Another limiting factor is the maximal sound pressure within the LST Bench. This must be considered only if Measurement Method – Fitting (Two Signal Method) with additional microphone is used. In case the specified maximal sound pressure of the microphone is exceeded or the input is clipping, a warning is generated.
Note
Please make sure that the correct microphone sensitivity and max SPL has been entered in microphone calibration. See Sensor Calibration for more information.
Applying Level Profile#
The level profile is a QC Standard system feature that allows applying a frequency dependent stimulus level profile. It can be used to improve the SNR in frequency ranges far off the resonance frequency or to limit the displacement close to the resonance frequency.
In LST Pro mode it may be beneficial to boost the frequency range above the resonance where the excursion is low to avoid a decreasing SNR as shown in the example below.
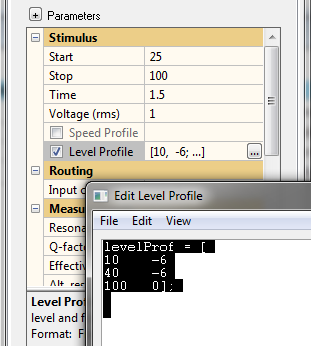
Note
The effect of the voltage profile is not visible in the displacement response as it represents the transfer function.
Making the Measurement as Fast as Possible#
The total test speed is mainly dominated by the stimulus duration (excitation time). For minimizing the stimulus time different parameters of the test setup and the test object have to be considered.
In the test bench the DUT is stimulated indirectly via sound pressure generated by built-in driver. Especially if the test object has a high Q factor a minimal frequency-time ratio is required to properly excite the resonance.
Passing the resonance too fast may result in a poor resonance peak curve which could falsify results.
For this reason, to optimize the test speed it is important to set the test bandwidth as narrow as possible to get an optimal time-frequency-resolution while keeping the stimulus duration low. Please refer to Finding the Optimal Stimulus Frequency Range for further information on the minimal required frequency range.
In general, start with a long measurement time to obtain a reference curve and decrease it until the response starts to deviate to find the optimal excitation time.
The example below shows the displacement transfer function of a spider for three different time settings.
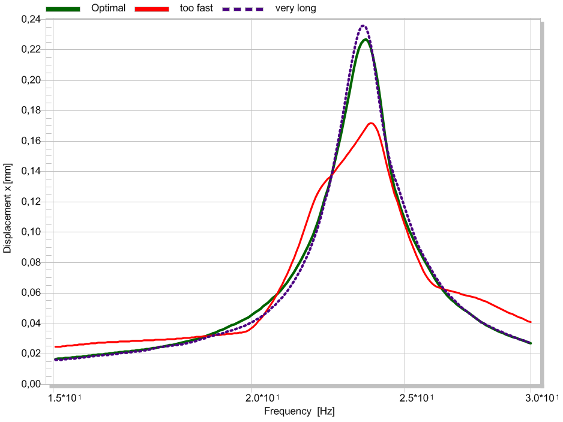
Monitoring Environmental Conditions#
Temperature and Humidity Sensor#
For tracking environmental conditions during testing, an external temperature and humidity sensor is optionally available. Please refer to QC User Manual section Temperature and Humidity Sensor for more information.
If the sensor is connected, the climate data is displayed automatically in the Summary window as shown below.
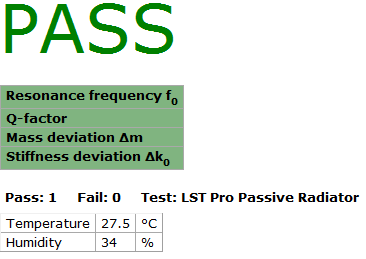
Note
In case the legacy sensor (connected to the Digital IO of the Production Analyzer) is used, it must be connected during power-up of the analyzer.
Temperature Monitoring#
The LST provides automatic temperature monitoring if a temperature and humidity sensor is available. You may activate this feature in the task properties as shown below.
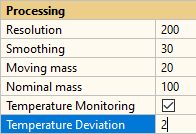
The parameter Temperature deviation defines the warning threshold for the temperature difference relative to the conditions during reference (Golden Unit) measurement or the last Limit Calibration, respectively.
If the temperature deviation exceeds this value a warning is displayed in the summary window.

In this case it is recommended to calibrate the limits and the reference (LST Pro). See Calibrating the LST Measurement and Limits for more information.
Note
To use this feature the temperature & humidity sensor has to be connected already during reference unit measurement in Limit Calculation Mode.
Test Bench Impact on Results#
Air Stiffness#
Influence of the Test Bench#
Generally, the enclosed air volume in the LST Bench acts as an additional mechanical spring to the actual stiffness of the measured object. This effect strongly depends on the mounting, surface area and the material characteristics of the test object and may be neglected in many cases, especially when only relative limits are applied.
Note
These considerations are only relevant for Simple Measurement Method using displacement only. The displacement & sound pressure transfer function based fitting mode is not affected by the box air stiffness.
If the flow resistance of the material is low (transparent) the air in the LST Bench is not compressed and the effect may be neglected. For impregnated spiders, cones or passive radiators the air stiffness may increase the measured stiffness \(k_{0}\) (not the stiffness deviation \(\Delta k_{0}\)).
The additional stiffness measured is a systematical offset and can be subtracted if the absolute stiffness value of the test object is required and falsified significantly. It does not cause significant variation among DUTs of the same type and thus relative limit testing is valid in any case. Consequently, quality control, typically based on relative limits, is not affected by the box stiffness.
In some cases (e.g. domes without additional mass) the total system tuning (LST Bench + DUT) may prevent measuring a clear resonance in the displacement signal. In this case an additional mass or a free air measurement is required (refer to Free Air Measurement).
Remedies#
Using Two Signal Method (Measurement Method: Fitting)#
By measuring the actual transfer function of sound pressure (excitation) and resulting displacement, the parameters of the mechanical resonator are identified directly without falsification related to the test bench. Select Measurement Method – Fitting in parameter category Configuration and make sure that a microphone is connected to the test bench.
Using Free Air Setup (Bypass)#
A simple way to bypass the air spring of the test bench is using a (quasi-) free air setup by either lifting the mounting platform or opening the ventilation hole of the LST Bench (min. revision 1.2). See section Free Air Measurement for more information.
Subtracting the Estimated Box Stiffness#
The box stiffness may be subtracted automatically by activating Subtract box stiffness in the task property page.
Note
This parameter is only available if Measurement Method – Simple is selected.
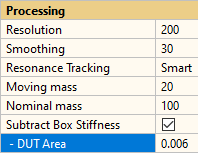
The estimated effective surface area needs to be specified for estimating the additional air stiffness.
Note
The effective DUT area Ss is comparable to the Sd of a full transducer (cone). It is the effective coupling factor between the acoustical and mechanical domain and is often not identical with the geometrical area Sgeom of the surface. This fact is especially valid for spiders which may be porous and do not move as a piston. Therefore, the effective area is hard to define and may cause a higher falsification than the influence of the box stiffness. For cones and passive radiators, the approximation Ss is ≈ Sgeom is roughly valid. By default, box stiffness subtraction is deactivated as it may deteriorate the results of \(k_{0}\) significantly if the DUT material is porous or Ss is is estimated incorrectly. Activating this feature is only recommended if the correct absolute value of \(k_{0}\) is required and the DUT has a big surface area of dense material (e.g. cones, passive radiators).
LST – Reference#
Physical Background#
Acoustical Model#
The measurement principle of the LST is based on a simplified physical model of the device under test mounted on the test bench as shown in the schematic cross section of the test setup and the corresponding lumped parameter model (equivalent circuit) for low frequencies below.
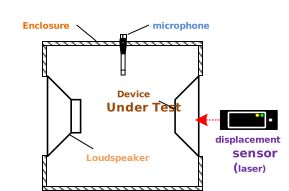
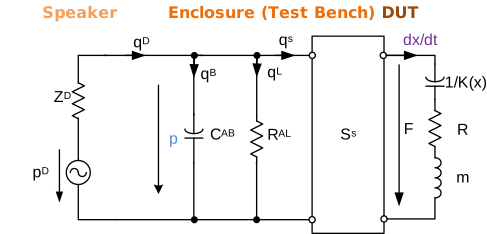
The loudspeaker generates a volume velocity \(\mathbf{q}_{\text{D}}\)
The volume velocity \(\mathbf{q}_{\text{B}}\) flows into the volume of the box, \(\mathbf{q}_{\text{L}}\) is leaving the box through leaks and the volume velocity \(\mathbf{q}_{\text{S}}\) produces the force \(F\) driving the suspension part under test.
The pressure \(p\) in the box generates a force \(F=S_{\text{S}} p\) on the suspension part using an effective area \(S_{\text{S}}\). In case of spiders the effective area \(S_{\text{S}}\) has to be considered as a coupling factor between the acoustical and mechanical domain but is (due to the porosity) not identical with the geometrical area \(S_{\text{geo}}\). For example, a spider may have a much smaller effective area (\(S_{\text{S}} < 0.5 S_{\text{geo}}\)).
The acoustical compliance \(C_{\text{AB}}\) depends on the volume \(V\) of the enclosed air and the static air pressure \(p_{0}\).
The loudspeaker used for pneumatic excitation is modeled by an acoustical impedance \(Z_{\text{D}}\) and a pressure source \(p_{\text{D}}\).
The clamped suspension is described by the displacement \(x\) of the inner clamping part and the driving force \(F=S_{\text{S}}p\) which is related to the sound pressure \(p\) in the test box. The driving force
is the sum of the restoring force \(K(x)x\) of the suspension, the force \(R\frac{\text{d}x}{\text{d}t}\) related to the losses in the suspension material and the inertia accelerating the mass \(m\).
The moving mass \(m\) can be approximated by the total mass of suspension and the inner clamping parts.
The identification of the parameters \(K(x)\) or respectively \(k_{0}\) requires the measurement of some state variables such as force, displacement or pressure in the system.
The main state variable measured by the LST is the displacement \(x\) of the DUT. The sound pressure inside the box can be measured optionally by using a normal microphone. However, the driving force \(F=S_{\text{S}}p\) cannot be calculated in absolute values from the measured sound pressure \(p\) because the effective area \(S_{\text{S}}\) of the suspension is usually not known.
Small Signal Behavior#
A sinusoidal sound pressure signal
stimulates a sinusoidal displacement of the DUT
as long as the amplitude of the displacement is sufficiently small \(X_{1}\approx 0\) to ensure that the stiffness \(K(x) = k_{0}\) and resistance \(R\) are constant and the system behaves linearly.
The transfer function between sound pressure and displacement
has a low-pass characteristic as shown as a thick line in the diagram below.
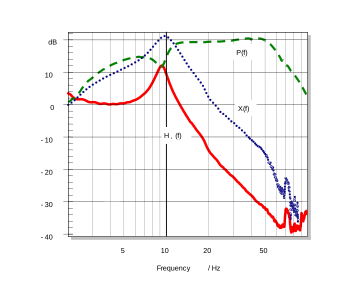
At the resonance frequency
the transfer function has a distinct maximum assuming that the losses in the suspension part are low.
The size of the peak corresponds to the loss factor
which is usually high (\(Q>2\)) and describes the ratio of the magnitude of \(H_{x}(\mathrm{j}\omega)\) at resonance and at very low frequencies.
For measuring spiders as well as small-sized cones and passive radiators the sound pressure response \(p(f)\) can be assumed constant. Therefore, sound pressure measurement may be omitted (one signal method).
If the mass, resonance frequency (and Q-factor) are known, the small signal parameters can be identified. Refer to the following sections Measurement Method and Definition of Input and Result Parameters for more information about how the result parameters are calculated based on the provided measurement methods.
Measurement Method#
The LST provides two measurement methods which can be selected using the parameter Measurement Method in parameter category Configuration:
Simple (laser only) – “one signal method”
Fitting (laser + mic) – “two signal method”
The method should be selected according to the available hardware setup and the test object characteristics. The physical background of the provided methods is explained in previous section Physical Background.
In general, Fitting mode is superior due to higher accuracy and flexibility compared to Simple mode, but an additional microphone for sound pressure measurement is required.
Fitting (Two Signal Method)#
The two-signal method complies with the general assumptions made in section Small Signal Behavior. Measuring both state variables - displacement and sound pressure - gives the transfer function \(H_{x}(f)\). The resonator parameters resonance frequency and Q-factor of DUT incl. inner clamping (if used) are derived from this curve.
An LMS fitting algorithm is used to fit the measured data to the resonator model output in order to provide linear result parameters.
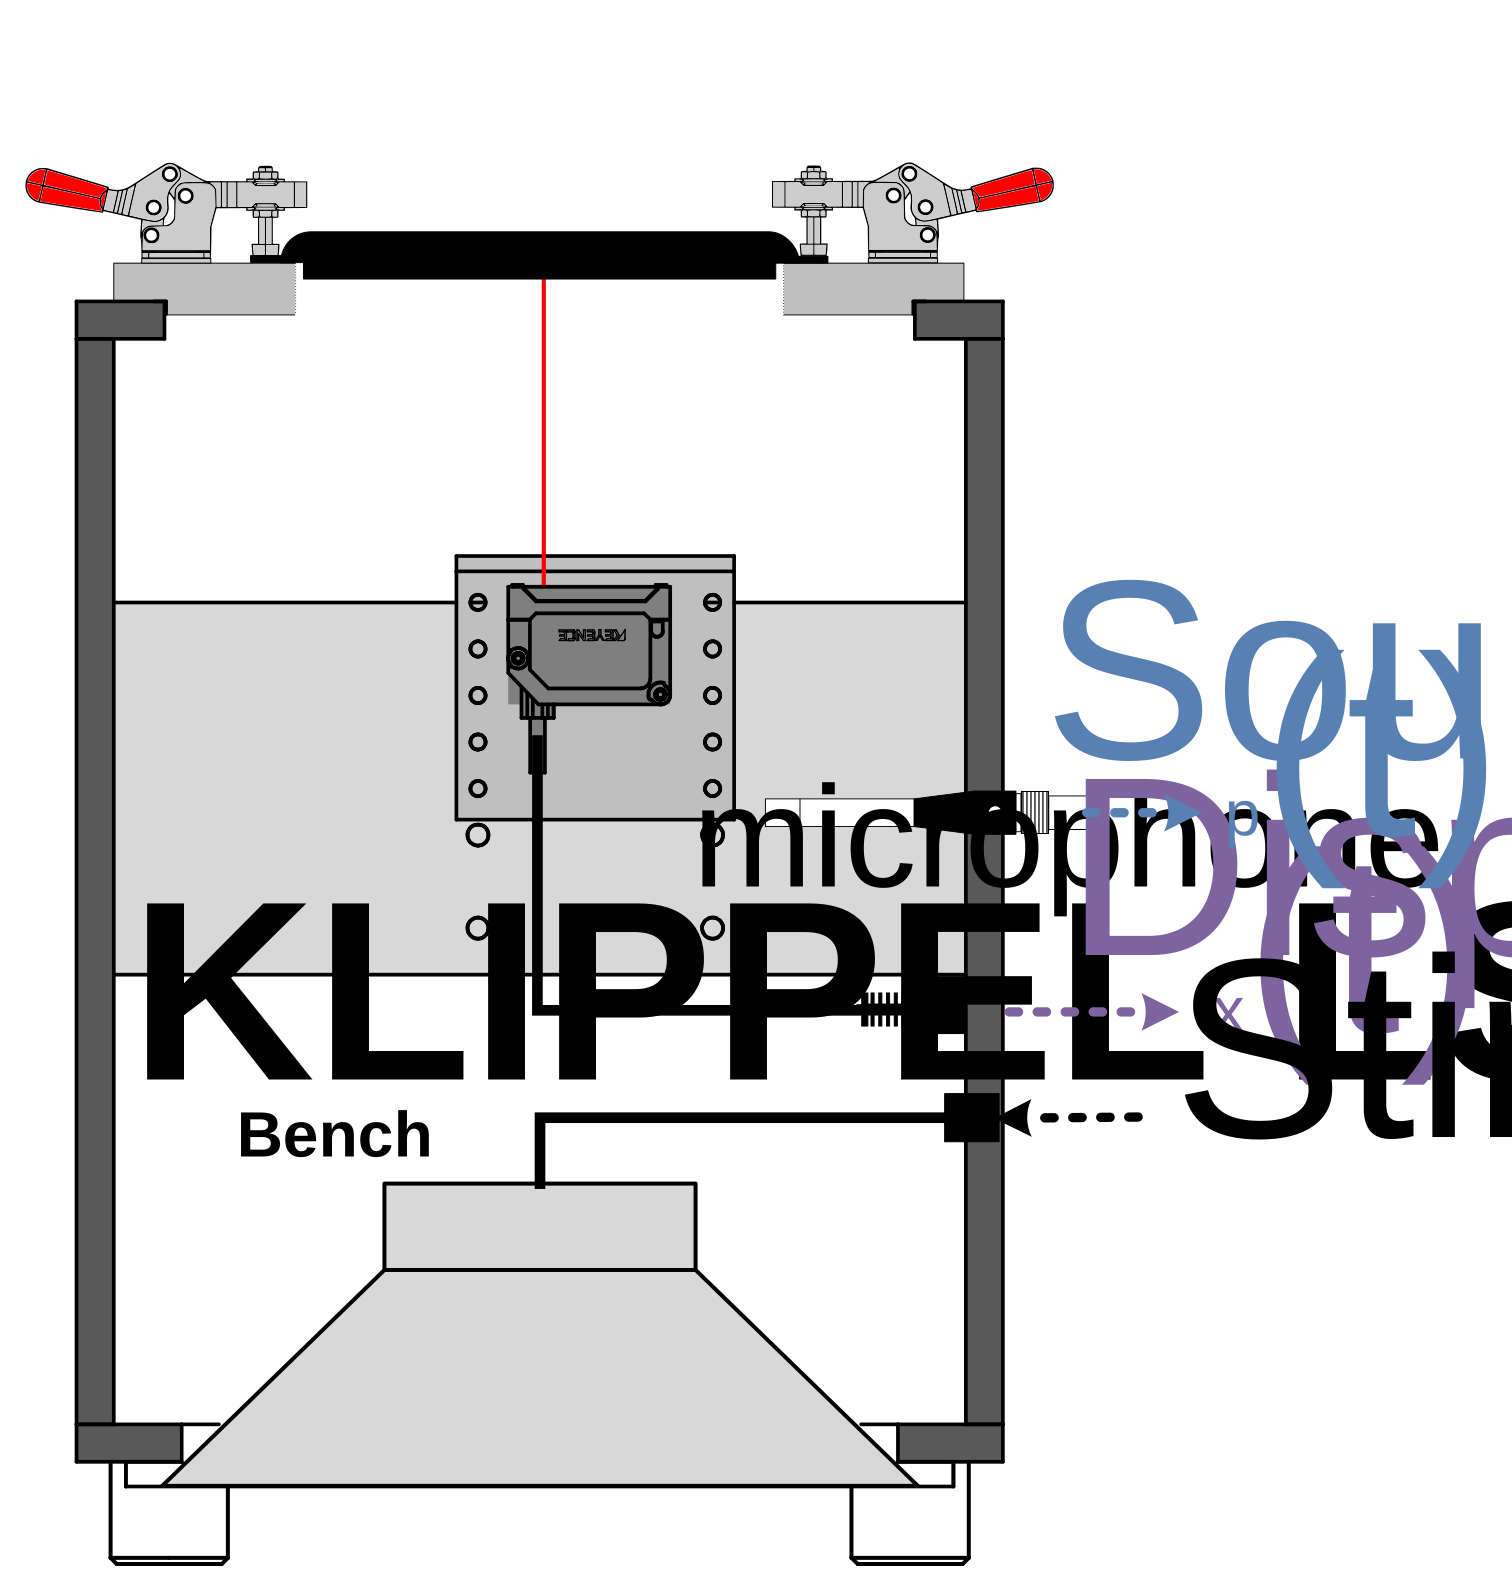
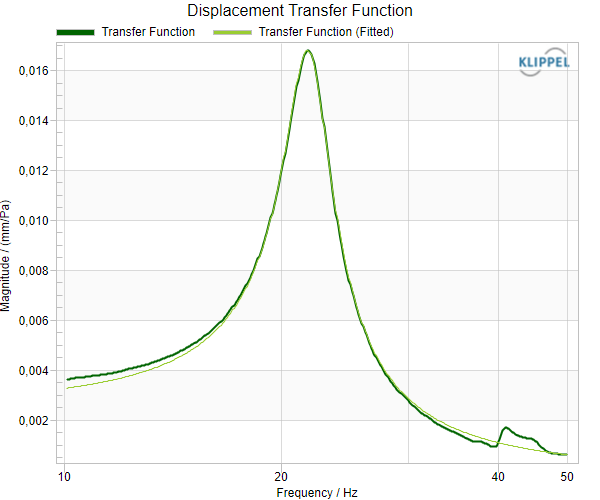
Especially for large size test objects, this method is mandatory because there is not necessarily a distinct maximum of the displacement at resonance frequency. Only the transfer function provides the actual resonance frequency. The plot shown above was measured with an 18’’ cone on the SPM Bench. The graphs below indicate that the main information is provided by the sound pressure.
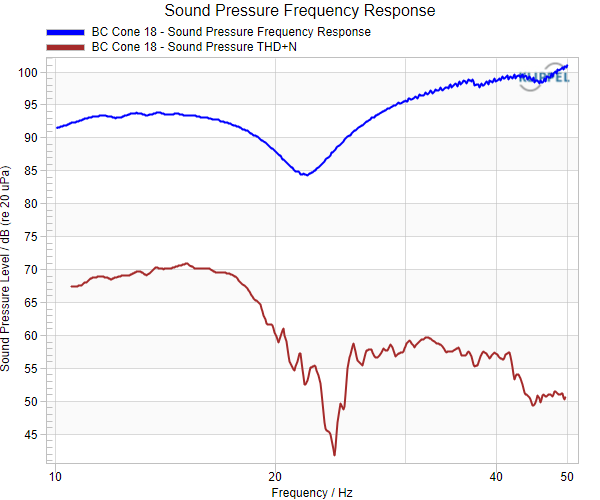
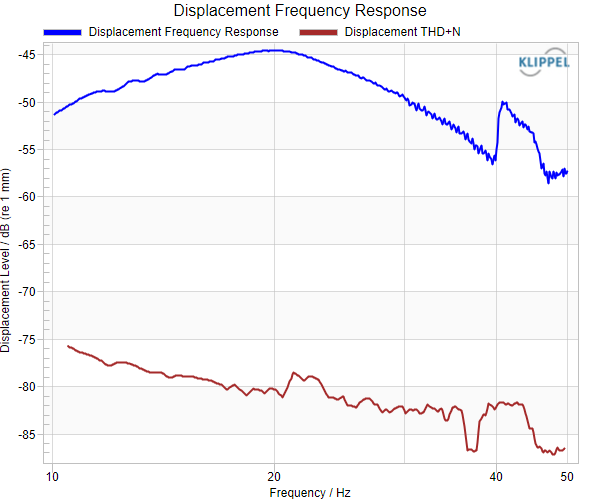
The advantages and disadvantages of the two-signal method are listed in the following paragraph.
Pro
No test bench influence
Model parameter fitting possible
Better accuracy, especially with poor signals
Con
More sensors required
Max SPL of microphone must be considered
Ambient noise may disturb measurement
Note
The two-signal method is recommended for all test applications (except free-air resonance test) due to its superior accuracy, especially for LST Pro mode. This method cannot be used with LST Bench Rev. 1.0 and 1.1 with internal laser mounting as there is no terminal provided to insert a microphone.
Simple (One Signal Method)#
In contrast to the two-signal method, this principle is based on the assumption that the feedback of the resonance on the sound pressure can be neglected (\(p(f)\) is constant or linear function). Therefore, the sound pressure measurement is omitted and only displacement is measured in order to determine resonance frequency and Q-factor of the DUT (incl. inner clamping).
This assumption is true for a majority of test objects, mainly for smaller test objects as well as materials with high porosity or dominant leakage in a free air test.
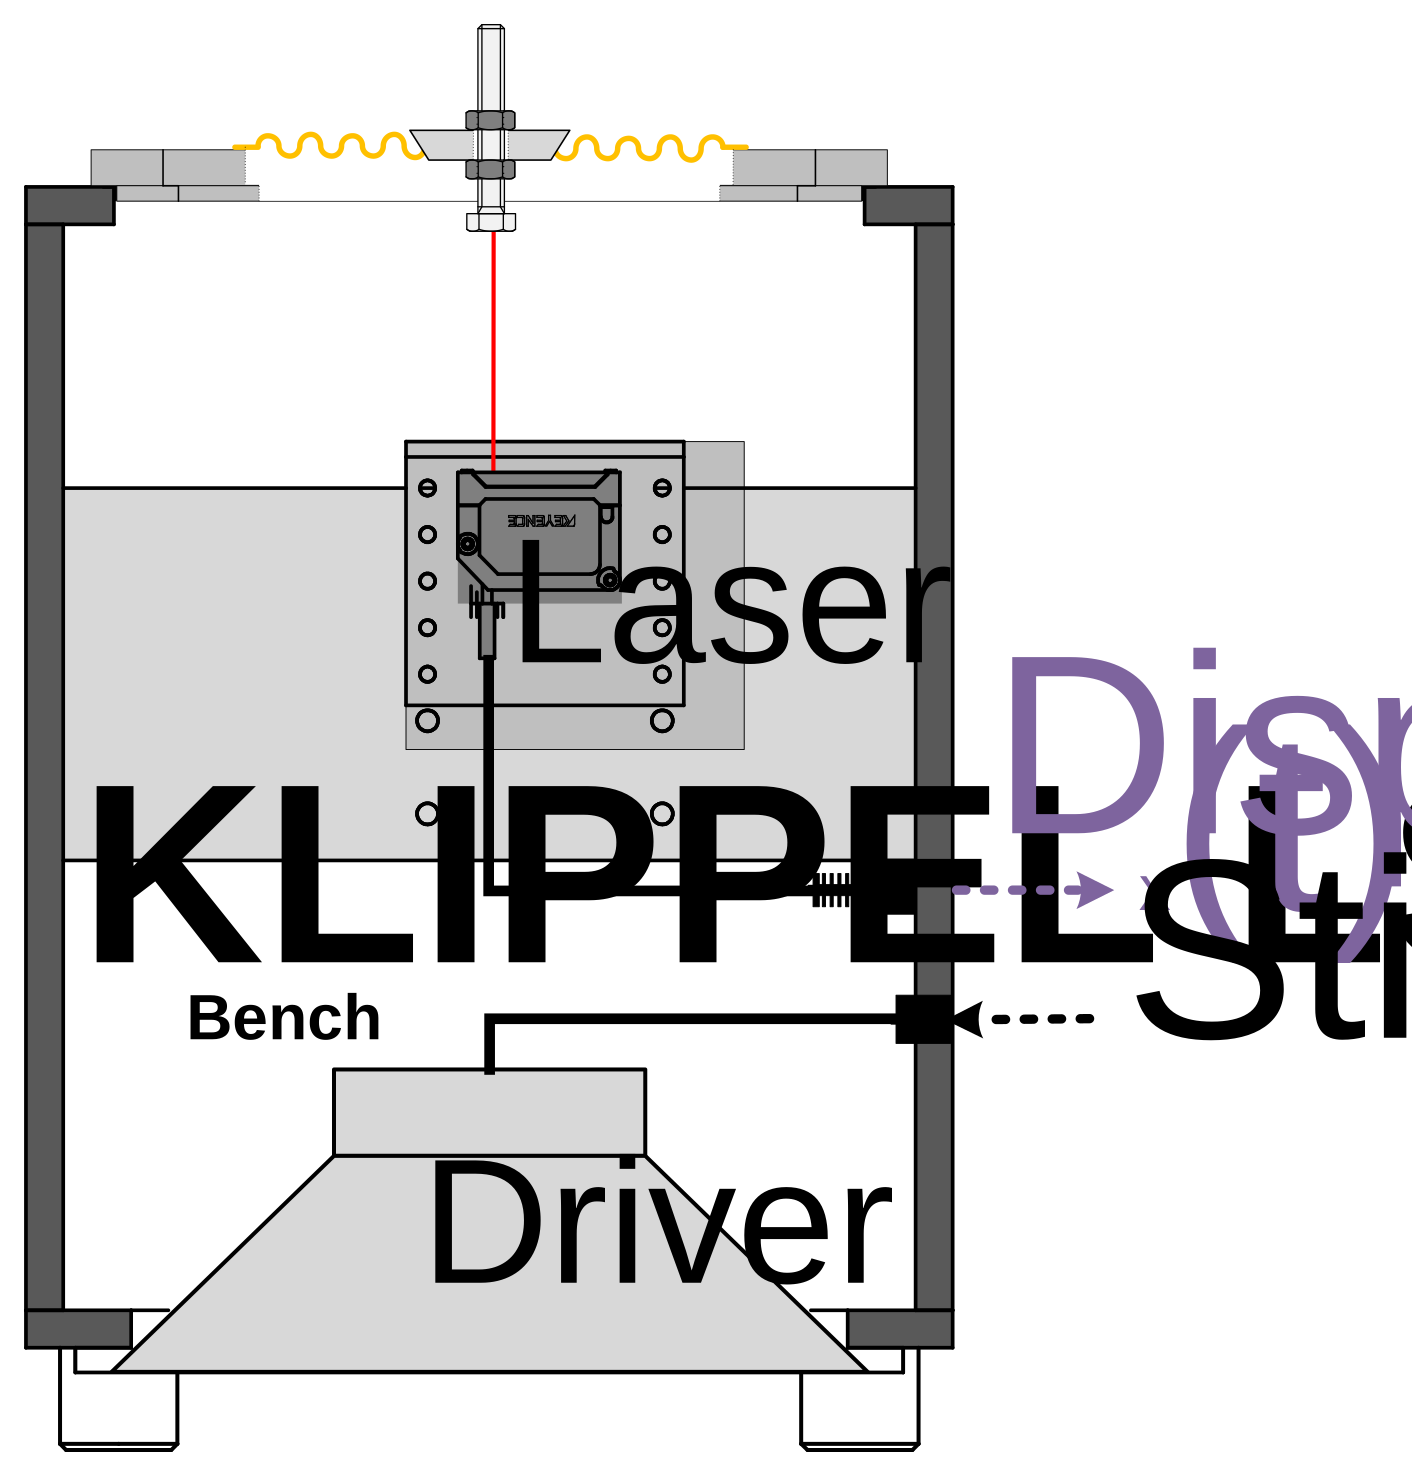
The two plots below compare both two (left) and one (right) signal method for a medium sized spider. It is clearly visible that the transfer function and displacement magnitude deliver the identical resonance frequency with a minor difference in the Q-factor (which is not required for stiffness calculation). The sound pressure signal (not shown) indicates no impact of the resonance.
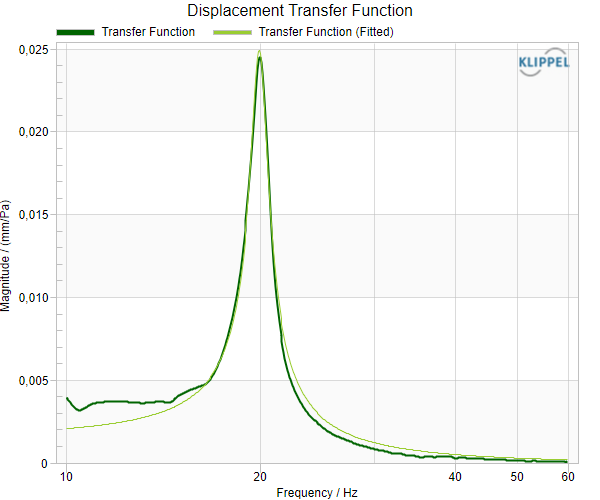
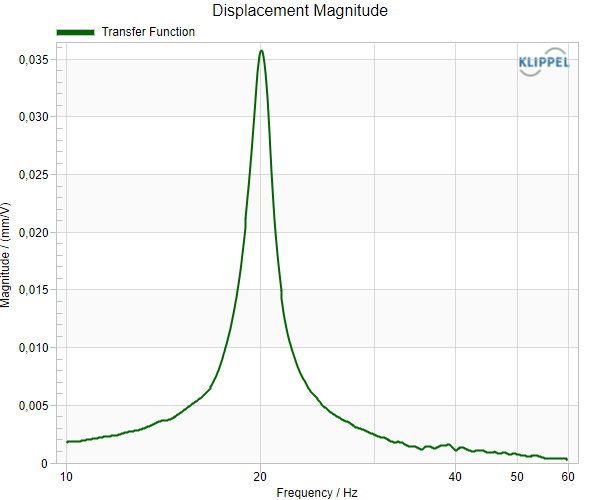
Using the one signal method, the resonance frequency and Q-factor are directly read from the measured curve. Find more information in the following section Definition of Input and Result Parameters.
The advantages and disadvantages of the one signal method are listed in the following paragraph.
Pro
Simple
Robust against ambient noise
Sufficient for relative QC testing
Con
Test box may influence results
Not applicable to large DUTs
Inaccurate for low SNR or distorted resonance peak
Q-factor (does not affect stiffness calculation)
Definition of Input and Result Parameters#
Moving Mass#
DEFINITION: The moving mass \(m\) represents the total, effective moving mass of a resonator. For suspension parts (spiders, cones etc.) the effective moving mass comprises the moving mass of the suspension part \(m_{\text{s}}\) and the additional mass of the inner clamping part \(m_{\text{c}}\):
\(m = m_{\text{s}} + m_{\text{c}}\)
For suspension parts \(m_{\text{c}}\) is dominant and therefore \(m_{\text{s}}\) (variation) may be neglected or approximated by the total weight of the suspension part.
For passive radiators the moving mass is purely inherent as usually no additional mass is attached to the DUT. Please refer to section How to Determine the Moving Mass of the Golden Unit for more information.
The moving mass is required to calculate stiffness \(k_{0}\) from resonance frequency \(f_{\text{r}}\).
Note
The total moving mass is a static input parameter. It is assumed constant for suspension parts of the same type to derive \(k_{0}\). For LST Pro mode, the specified \(m\) is the reference mass of the Golden Unit to determine the relative deviation of mass in absolute units.
Resonance Frequency#
DEFINITION: The resonance frequency \(f_{\text{r}}\) represents the frequency of an AC displacement at which the restoring force \(F_{k}\) of the suspension part equals the inertia of the moving mass \(m\), given by the following equation
The resonance frequency \(f_{\text{r}}\) characterizes the frequency of maximal amplitude of the transfer function \(H_{x}\) (or respectively the displacement magnitude) of a resonator. For a simple harmonic oscillator (2nd-order system) like a suspension with an inner clamping or a passive radiator, the resonance frequency
is determined by the effective stiffness \(k_{\text{eff}}\) and the moving mass \(m\).
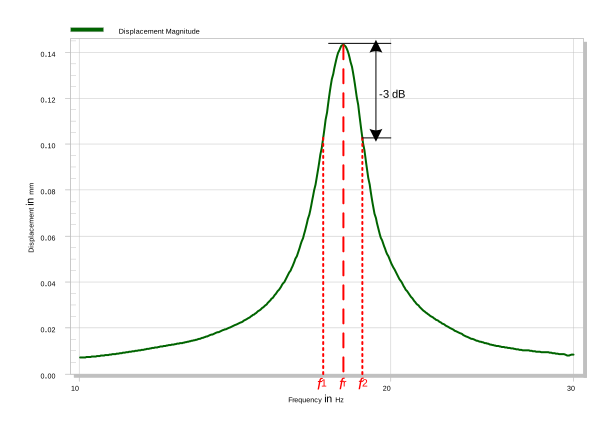
Determining the resonance frequency \(f_{\text{r}}\) from the displacement magnitude \(\left| \underline{X} (f) \right|\) for Measurement Method - Simple (One Signal Method)
Using Measurement Method - Fitting (Two Signal Method), \(f_{\text{r}}\) is direct result of the transfer function fitting as stated in section Small Signal Behavior.
Application to end-of-line-testing
The resonance frequency is a characteristic parameter for the small signal performance of a suspension part or passive radiator. As it is influenced by both mass and stiffness deviation, both parameters are monitored indirectly.
In LST Lite the mass is assumed constant (e.g. for suspension parts with inner clamping), the stiffness can be derived directly from the resonance frequency.
Minimal or maximal QC limits may be applied to check \(f_{\text{r}}\) in order to make a PASS / FAIL decision.
Q-factor#
DEFINITION: The Q-factor (or loss factor) is a dimensionless parameter describing the (inverse) damping and thus the mechanical losses of a resonator
Using Measurement Method - Simple (One Signal Method) Q is calculated from the -3 dB bandwidth B of the displacement magnitude response according to illustration in previous section Resonance Frequency.
\(Q = \frac{1}{\text{DF}} = \frac{f_{\text{r}}}{B} = \frac{f_{\text{r}}}{f_{2} - f_{1}}\)
Using Measurement Method - Fitting (Two Signal Method), \(Q\) is a direct result of the transfer function fitting as stated in section Small Signal Behavior.
Application to end-of-line-testing
The Q-factor gives information on the mechanical losses of the suspension. Minimal or maximal QC limits may be applied to derive PASS / FAIL verdicts.
Stiffness/Compliance#
DEFINITION: The small signal (or linear) stiffness \(k_{0}\) corresponds to the effective stiffness \(k_{\text{eff}}\)(\(x_{\text{peak}}\), \(x_{\text{dc}}\)) of a suspension part for small ac peak displacements \(x_{\text{peak}}\) and a small static displacement bias \(x_{\text{dc}}\) caused by the clamping. \(k_{0}\) can be derived from the resonance frequency \(f_{\text{r}}\) and the moving mass \(m\) by rearranging (2b):
\(k_{0} ≙ k_{\text{eff}}\left( x_{\text{peak}},x_{\text{dc}} \right) = m\left( 2\pi f_{\text{r}} \right)^{2}\) for \(x_{\text{peak}},x_{\text{dc}} \rightarrow 0\)
\(\left\lbrack k_{0} \right\rbrack = \frac{\text{N}}{\text{mm}}\)
For calculating \(k_{0}\), \(m\) is assumed constant among a series of units of the same type (see Moving Mass).
Note
If a mass variation is expected (e.g., for passive radiators), this assumption does not apply and measurement of absolute \(k_{0}\) should be deactivated. Measure Mass and Stiffness Deviation (LST Pro) (LST Pro) or plain resonance frequency instead.
Compliance \(c_{0}\) is the inverse of the stiffness.
\(c_{0} = \frac{1}{k_{0}}\)
\(\left\lbrack c_{0} \right\rbrack = \frac{\text{mm}}{\text{N}}\)
Generally, the stiffness \(K(x_{\text{ac}})\) of a suspension part is a nonlinear parameter which depends on the instantaneous displacement \(x_{\text{ac}}\) (force deflection rises nonlinearly with displacement). Additionally, visco-elastic effects influence the dynamic behavior of most materials at higher excursions. In general, \(k_{\text{eff}}\) is defined for any ac peak displacement \(x_{\text{peak}}\) Therefore the LST is operated at very low amplitudes to minimize these effects and to determine linear parameters.
Note
As the suspension part is mounted horizontally, the inner clamping parts cause a small static displacement \(x_{\text{dc}}\) which may result in higher values of \(k_{0}\) than at rest position.
Application to end-of-line-testing
The small signal stiffness is an important characteristic for suspension parts. It is a more universal parameter than the resonance frequency as it describes the main characteristic of a suspension part being independent of the moving mass attached to the DUT.
While the large signal performance of the DUT is mainly determined by the design (material, geometry), the linear parameter \(k_{0}\) is a very good single value criterion to judge the overall quality of the unit and the consistency of the production. Minimal or maximal QC limits may be applied to derive PASS / FAIL verdicts.
Nominal Resonance Frequency#
DEFINITION: The nominal resonance frequency \(f_{\text{r,nom}}\) is a derived parameter and represents the (virtual) resonance frequency for a nominal mass \(m_{\text{nom}}\) other than \(m\). Knowing the actual moving mass during the measurement \(m\), the nominal res. frequency may be calculated from \(f_{\text{r}}\) and the mass ratio
\(f_{\text{r,nom}} = f_{\text{r}}(m_{\text{nom}}) = \frac{1}{2\pi}\sqrt{\frac{k_{0}}{m_{\text{nom}}}} = f_{\text{r}}\ \sqrt{\frac{m}{m_{\text{nom}}}}\)
Application to end-of-line-testing
The resonance frequency is a function of both stiffness and moving mass. In some cases the resonance frequency for a standardized reference mass \(f_{\text{r,nom}}\) may be preferred over the mass independent value of \(k_{0}\). The nominal resonance frequency is a transformed result of \(f_{\text{r}}\) and thus does not contain additional information. However, minimal or maximal QC limits may be applied to derive PASS / FAIL verdicts.
Federzahl#
DEFINITION: The Federzahl \(Fdz\) is an alternative parameter for the (static) stiffness of a suspension. It represents the static deflection under Force for a defined nominal mass \(m_{\text{nom}}\).
It may be approximated from the dynamic small signal stiffness \(k_{0}\):
Note
Typical Federzahl measurement is a static method which suffers from suspension nonlinearity and visco-elastic settling effects. The method used in LST is based on the dynamic stiffness. Therefore, systematic differences are expected comparing both results of both methods.
Mass and Stiffness Deviation (LST Pro)#
DEFINITION: The mass and stiffness deviation describe the variation of \(m\) and \(k_{0}\) relative to a known reference unit
For passive radiators both parameters have to be monitored independently as the mass cannot be assumed constant. For this reason, a model-based processing algorithm is applied that uses the relative transfer functions (Fitting (Two Signal Method))
or displacement magnitudes (Simple (One Signal Method))
of DUT and reference unit (Golden Unit).
The moving mass \(m\) of the golden reference unit is required to calculate the parameters in absolute units, otherwise the deviation is stated in percent. Please refer to Working with LST Pro for more information on the application.
Note
Mass and stiffness deviation should be measured exclusively for test objects with significant inherent mass (passive radiators). It should not be applied to suspension parts.
Note
Reproducible clamping conditions are crucial for accurate results.
Application to end-of-line-testing
For passive radiators both (moving) mass and stiffness of the suspension may vary significantly in production. Therefore, mass and stiffness deviation give valuable information on production drifts and allow applying separate QC limits for both parameters.
Note
The mass-stiffness-separation is a unique LST Pro feature that requires a separate license.
Task Parameters#
The list below names and describes all available task parameters of the LST. These parameters are necessary to customize the measurement task.
Configuration#
- Measurement Method
select LST measurement and processing method
Simple (laser only): only use laser displacement signal
Fitting (laser + mic): resonator parameter fitting based on displacement/sound pressure transfer function measurement (better accuracy)
Also see Measurement Method.
- Test Bench
select connected test bench:
LST
SPM
MSPM
Other
frequency range limits will be set accordingly
Stimulus#
- Start
Start frequency of the logarithmic sine sweep
- Stop
Stop frequency of the logarithmic sine sweep
- Time
Measurement time - duration of sine sweep stimulus
- Voltage
RMS stimulus voltage at speaker terminals (amplifier output) or respectively at Line output (amplifier input) of the analyzer depends on output routing settings
- Speed Profile
Relative speed of log sweep vs. frequency This feature is not available in QC Basic
- Level Profile
Stimulus level shaping profile vs. frequency This feature is not available in QC Basic
Routing#
- Custom File for Import
path of task-specific custom WAVE file for processing (raw data import)
(only available in case of WAVE file processing)
- Output
Select port where the test voltage is specified. Choices are:
Speaker 1,2 (loudspeaker terminals)
Out 1,2
Out 1+2
(hidden if set by Control task)
- Output Channel
select output channel(s) of playback device
(only available for 3rd playback audio device output and if global Output is set to controlled by Task)
- Laser Input
Select analyzer input for laser displacement measurement
Line 1
Line 2
- Mic Input
Select analyzer input for microphone measurement
Mic 1
Mic 2
Line 1
Line 2
Only available for Measurement Mode - Fitting
- Laser Input Channel
select channel of capture device or WAVE file for laser sensor signal Only available with 3rd party capture device or Execution Mode: Load Input Signals
Note
For re-processing exported WAVE file data (see QC Manual section Save Input Signals) use channel #1
- Microphone Input Channel
select channel of capture device or WAVE file for microphone signal Only available with 3rd party capture device or Execution Mode: Load Input Signals and Measurement Mode: Fitting
Note
For re-processing exported WAVE file data (see QC Manual section Save Input Signals) use channel #2
- Digital Output
Bit mask for digital output GPIO (e.g. for multiplexer control), pins are set before test.
rows correspond to pins 24, (11), 5, 17, 4, 16, 3, 15, 2
Format 1: [Value1, Mask1; Value2, Mask2; …]
Format 2: [Value1; Value2; …]
- Delay Before
Set delay before measurement starts (after GPIO setting, if requested)
- Delay After
Set delay after measurement (before next task starts)
Results#
- Resonance frequency \(f_{\text{r}}\)
Measure resonance frequency
- Q-factor
Measure Q-factor
- Stiffness \(k_{0}\)
Calculate small signal stiffness (derived from measured Resonance frequency and parameter Reference mass)
- Compliance \(c_{0}\)
Calculate small signal compliance (inverse of stiffness \(k_{0}\))
- Federzahl
Calculate Federzahl – calculated deflection under force if Nominal mass is applied
- Mass deviation \(\Delta m\)
Calculate mass deviation relative to Golden Unit This feature is only available in LST Pro
- Stiffness deviation \(\Delta k_{0}\)
Calculate stiffness deviation relative to Golden Unit This feature is only available in LST Pro
Processing#
- Resolution
Relative resolution - result points per octave for displacement frequency response
Note
This setting defines effective resonance frequency accuracy (only for Measurement Method – Simple)
- Smoothing
Part of an octave for curve smoothing, no smoothing is applied if left empty
Note
Small values may decrease measured Q factor (only for Measurement Method – Simple)
- Resonance Tracking
Select mode for resonance frequency tracking
Smart: track and validate main peak in displacement response (recommended)
Max: use frequency of max displacement, without further validation (only recommended if default mode fails due to jitter)
This parameter is only available for Measurement Method - Simple
- Moving mass
Total moving mass in g:
suspension part: weight of inner clamping part (dominant), required for calculating stiffness
passive radiator: moving mass of Golden Unit, required to determine absolute mass/stiffness deviation
- Nominal mass
Virtual reference mass in g to calculate Federzahl and Nominal resonance frequency \(f_{\text{r,nom}}\)
Only available if Nominal resonance frequency or Federzahl are measured
- Subtract box stiffness
subtract air stiffness of KLIPPEL LST Bench for all stiffness measures (requires known moving area \(S_{\text{S}}\) of DUT) not recommended for DUTs made of porous materials (low flow resistance)
This parameter is only available for Measurement Method - Simple
- DUT Area
effective moving (radiating) area of DUT in m²– corresponding ideal piston surface This parameter is only available for Measurement Method - Simple
- Temperature monitoring
activate ambient temperature monitoring, a warning is generated if the current temperature changed relative to the reference measurement/last calibration by value “Temperature deviation”; requires temperature/humidity sensor
- Temperature deviation
warning threshold for absolute ambient temperature variation relative to reference measurement/last limit calibration in K
- Input Gain 1/2
input gain for corresponding hardware input channel
Note
The effective range and available gain steps depend on used analyzer/card, please refer to the corresponding hardware specification
Troubleshooting#
This section discusses probable errors and warnings that may occur using the LST Task.
Warning Messages#
No reference DUT available for calculating mass/stiffness deviation. Please measure reference with known “Moving mass” in Limit Calculation Mode.#
For calculating the mass and stiffness deviation in LST Pro mode, a dedicated “golden” reference unit with a known moving mass (parameter Moving mass) is required. This warning appears if this feature is active, but no reference DUT is available in. Refer to section Working with LST Pro for more information.
Remedy:
Measure at least one reference unit in Limit Calculation Mode
Deactivate measures Mass deviation and Stiffness deviation
Reference data for calculating mass/stiffness deviation is incompatible. Please update reference DUT(s).#
In LST Pro, this warning is displayed if the current test setup is incompatible with the stored reference data for mass/stiffness separation. This can be related to differing frequency range and duration of the stimulus or resolution settings.
Remedy:
Reset the stimulus settings to compatible values
Remove existing and measure new reference DUTs
Ambient temperature has changed (∆T= <value> K), please calibrate limits#
This warning only occurs if Temperature Monitoring is activated and the current ambient temperature deviates by the specified value from the ambient temperature during reference measurement or the last calibration respectively.
Measure only available if parameter “Moving mass” entered#
The selected measure can only be determined if a valid moving mass (Moving Mass) is specified.
No distinct resonance peak found#
This warning is generated if no significant resonance frequency could be detected or the displacement magnitude is too jittered to track a major peak.
If the displacement magnitude looks smooth but does not show a resonance peak the resonance frequency might be out of the measured frequency band. In this case check the stimulus start and stop frequency.
In case a clear resonance peak is visible, but the curve jitters, the measurement time might be too short or the stimulus voltage is too low (bad laser signal).
If the curve is flat and noisy occur, check the measurement distance of the laser head or the mounting of the test object. In this case usually also other warnings (poor SNR) may occur.
Analysis bandwidth critical, please increase upper frequency#
This warning message only applies for LST Pro mode when Mass and Stiffness deviation are measured. In this case the upper stimulus frequency is critically low for best performance. Increase the upper stimulus frequency at least to 2.5⋅ \(f_{\text{r}}\).
Note
This restriction is obsolete for two signal (laser + mic) measurement method.
High fitting error. Check Voltage and Time settings.#
This warning is displayed if the deviation between measured and fitted transfer function magnitude is too high.
Remedies:
Check signals and connection, if there are other warnings related to SNR)
Check that voltage is high enough to achieve sufficient displacement
Check that voltage is not too high causing irregular vibration of the DUT
Increase test time if the resonance curve looks distorted
Poor SNR of laser signal, stimulus voltage may be too low.#
If the SNR of the laser signal at resonance frequency is invalid (< 25 dB), this error is generated.
Remedy:
Check that voltage is high enough to achieve sufficient displacement
Check that voltage is not too high causing irregular vibration of the DUT
check that the laser beam reflects properly
Poor SNR of microphone signal. This may be caused by ambient noise or insufficient stimulus voltage.#
If the SNR of the microphone signal is critically low (< 20 dB at any frequency) this error is generated.
Remedies:
Check for ambient noise impact
Repeat the test and check if the warning is still displayed
see THD+N curve in Sound Pressure Frequency Response window and repeat the test to check for varying ambient noise impact
check that the stimulus voltage is sufficient
Error Messages#
Analysis bandwidth too small, please increase upper stimulus frequency#
This warning message only applies for LST Pro mode when Mass and Stiffness deviation are measured. In this case the upper stimulus frequency is too low to determine mass and stiffness deviation. Increase the upper stimulus frequency at least to 2.5 \(f_{\text{r}}\).
Note
This restriction is obsolete for two signal (laser + mic) measurement method.
Laser signal invalid (low SNR), please check measurement distance and hardware setup (connections) or increase voltage#
If the SNR of the laser signal at resonance frequency is invalid (< 10 dB), this error is generated.
Remedies
check the power and signal connection of laser controller and head as well as the input routing selected in the LST Task.
check if the measurement distance is within the measurement range of the sensor head. See Adjusting the Laser Position for more information.
check that the stimulus signal is present - the speakON input of the LST Bench should be connected to the selected speaker terminal of the amplifier or analyzer.
If the hardware is set up properly check the stimulus voltage setting. If the excitation voltage is too low, the test object may not be stimulated sufficiently resulting in AC displacement amplitude below or close to the minimal resolution of the laser sensor.
Microphone signal invalid (low SNR). This may be caused by strong ambient noise, insufficient stimulus voltage or errors in the hardware setup (check connections).#
If the SNR of the microphone signal is invalid (< 10 dB at any frequency) this error is generated.
Remedies
check that the microphone is connected according to the input routing selected in the LST Task
the microphone should be inserted in the LST Bench completely
make sure that there is no heavy ambient noise – check Sound Pressure Frequency Response window and repeat the test multiple times to see variation caused by ambient noise
check that the stimulus signal is present - the speakON input of the LST Bench should be connected to amplifier or the selected speaker terminal of the analyzer.
Check that the stimulus voltage is sufficient
This Setup cannot be used in QC-Basic Version! Do not use tests made by Standard Version.#
This error is generated when a test is opened with a QC Basic license but was created and configured with QC Standard features.
“This Setup cannot be used with LST Lite license! Do not use tests made with LST Pro license.”
This error is generated when a test is opened with an LST Lite license but was created and configured with LST Pro features.
No distinct resonance peak found#
In simple measurement mode (laser only) this indicates that no resonance clear resonance frequency could be identified.
Remedies:
Check voltage setting
Check test bandwidth (frequency range)
Check laser adjustment
If Q factor is very low or if there are several peaks in the resonance curve next to the main resonance, switch to Resonance Tracking mode Max
Use Measurement Method - Fitting (laser + mic) to improve performance with poor signals
Resonance fitting failed#
This error is displayed if the fitted result parameters fail the plausibility check (Q out of range or resonance frequency outside of measured bandwidth)
Remedies:
Check that signal is valid (e.g. laser focus, mounting…)
Adjust frequency range in case the resonance frequency is outside of analyzed band
Resonance fitting failed: Invalid signal or resonance outside of measured frequency range#
The parameter fitting failed in the initial phase because the transfer function peak was found close to the lower or upper measured frequency limit.
Remedies:
Check that signal is valid (e.g. laser focus, mounting…)
Adjust frequency range in case the resonance frequency is outside of analyzed band
Resonance fitting failed: Poor signal or frequency resolution too low#
This error is displayed in case the frequency resolution if the detected resonance peak is too low (low number of result points in the transfer function magnitude).
Remedies:
Increase Resolution, especially in case the Q factor is very high
Check that signal is valid (e.g. laser focus, mounting…)
