
MTD – Multi-Tone Distortion#
MTD - Tutorial#
Overview#
The Multi-Tone Distortion (MTD) is a measurement task for the QC software framework of the KLIPPEL Analyzer System. In order to operate the MTD task, a dedicated license is required that also works for users of the R&D software framework. However, for R&D related test and measurement there is a dedicated sister module (MTON – Multi-Tone Measurement) available that is closely related to the MTD task but provides more options such as voltage stepping.
The MTD task is based on multi-tone stimuli with a discrete excitation frequency spectrum. In addition to the fundamental spectrum response, the module is dedicated to measure multi-tone distortion that provides that includes both harmonic (HD) as well as intermodulation distortion (IMD). Since the stimulus energy is concentrated on particular frequencies, the spectral components of the stimulus response can be distinguished from distortion components and background noise in the measured signal very clearly. In contrast to a chirp excitation, a multi-tone stimulus represents the characteristics of typical music material much better.
The Multi-Tone Distortion task can be applied to any kind of transducer (loudspeaker, exciter, microphone) and especially loudspeaker systems providing a fingerprint of inherent nonlinear distortion. Also, audio electronics can be tested. Due to the limited diagnostic capabilities this task is meant to deliver a fast summary of a system’s large signal performance. For detailed diagnostics of harmonic distortion and for testing impulsive distortion (Rub&Buzz) the chirp-based Sound Pressure Level (SPL) task is recommended.
What is the Goal of This Tutorial?#
This part is an introduction to the MTD module. It is divided into the following steps:
Creating a MTD test or adding an MTD task to a Klippel QC test sequence
Performing a first MTD measurement
Viewing MTD results
Setting up the MTD task and creating limits
Customizing MTD task to improve the performance
Creating a MTD Test#
QC Software Framework#
Creating a New QC Test#
Open the QC Start - Engineer
Click
Give the test a clear name and choose a base template (e.g., Default), then click Ok.
You may log into the test now by clicking the Measure button.
The following test templates are based on or include MTD:
– general MTD test template for self-powered speakers or audio systems as well as electronics
– test template with SPL and MTD task for a comprehensive large signal test of self-powered speakers
– test template with IMP, SPL and MTD task for a comprehensive test of passive speakers
Adding the MTD Task#
Follow these steps to add a new MTD task to your existing test sequence. Skip this step if you have selected a test template that already includes MTD.
Select any existing test from QC-Start or create a new one and press the Measure button to log in. In case a non-Klippel hardware shall be used, use the View button and select the required audio device. More information is available in the QC-User Manual.
Start the QC Test
click the Add… button in the Tasks tab of the Property Page to add a new task.
Choose the task file
mtd.task.klb. The default location is%ProgramData%\Klippel\QC\Scripts\Klippel\QC\Modules
The MTD task will be added to the list of measurement tasks.
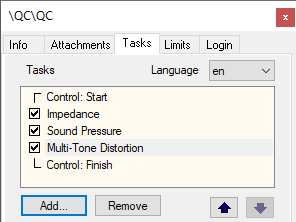
Use the arrow buttons to change task order. In a reflective environment, the MTD should not be placed right before the SPL Task to avoid negative impact of reverberant energy with the Rub&Buzz reading.
Note
Adding a new task always requires creating new reference units. You have to confirm that you want to delete all reference measurements, if limits exist in your test.
R&D Software Framework#
If you are operating the MTD within the KLIPPEL R&D Software framework, you may add a QC MTD operation by using the provided operation template.
Create or open a KLIPPEL database
Add a new operation by using the operation icon or Edit – New Operation…
Select Categories and Modules: QC-Software - QC quality control and Template: QC Multi-Tone Distortion (MTD). You may enter MTD in the filter input field instead to quickly find the template
Choose a name and click OK to create a new QC operation
Click Run
 to log in
See dB-Lab – Software for more information.
Performing a First MTD Measurement#
Running the MTD task requires a proper hardware setup according to QC User Manual / Getting started / Hardware Installation.
Basic Settings#
First, make sure that the global input and output routing in Control:Start - Routing properties are set according to your hardware setup and the configuration selected in the signal and sensor configuration dialogs for your capture/playback device. Refer to QC Manual sections Output Routing and Input Routing for more information.
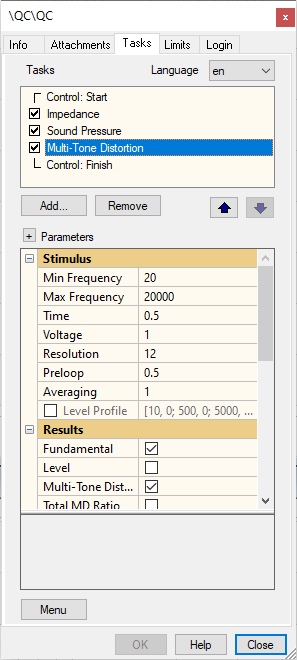
Select Multi-Tone Distortion task to edit the actual test settings. See Task Parameters in this manual for detailed information about setup parameters.
Stimulus#
Min./Max. Frequency#
In case the noise generator is selected, you need to define an upper and lower frequency limit for the excited bandwidth.
Time, Preloop, Averaging#
The parameter Time defines the duration of the main stimulus excluding preloop and averaging. Short test times limit the achievable frequency resolution at low frequencies (Resolution). Chose longer test times to include time-variant effects such as heating of the coil.
Use a Preloop factor > 0 to add a fade-in to the stimulus (before main test) in order to ensure steady-state conditions or account for break-in or DSP effects. You may use Averaging to improve signal-to-noise ratio, if required (check Noise Floor).
Voltage#
The Voltage setting defines the effective stimulus voltage RMS at the selected output terminal of your playback device or at the speaker terminals (amplifier output), depending on the output routing and hardware configuration.
Warning
The multi-tone signal’s crest factor is typically between 3 and 4 (12 dB), therefore the peak voltage value may be significantly higher than the RMS value. Consider this for avoiding overload damage and for output and amplifier headroom.
For digital output devices (e.g., Bluetooth device or sound card), the output level is specified in dB FS instead.
Results & Processing#
The most important results of the MTD are the Fundamental response as well as Multi-Tone Distortion (MD), both are activated by default in parameter category Results. For both result curves, different calculation modes are available in parameter category Processing.
Fundamental#
The Fundamental – Mode is typically set to Fundamental reflecting the absolute magnitude level of the measured response spectrum (excited frequencies only). Alternative modes such as Transfer Function or emulated Frequency Response are available as well to evaluate the transfer behavior (independent of Level Profile shaping). Fundamental - Smoothing (default: 1/3rd octave) is recommended for non-anechoic environments, such as test chambers.
In addition to the fundamental response, the overall response Level can be tested, e.g., to test overall sensitivity.
Multi-Tone Distortion#
The spectral Multi-Tone Distortion (MD) can be displayed both on an absolute scale (e.g., SPL) or relative to the fundamental, which is highly recommended to ease interpretation and limit setting in the non-ideal test environment. For this reason, MD - Relative is activated by default. MD – Unit allows to switch between result presentation in either percent or dB (relative level).
Closely related to the relative spectral MD, the Total MD Ratio reflects the overall distortion-to-signal level as a single value result.
Noise Floor#
Although it is not an actual test result of the DUT, it is highly recommended to measure Noise Floor during setup phase to check the signal-to-noise ratio of the other results. Most MD settings apply also for the Noise Floor since it is calculated in the same way as multi-tone distortion.
The Measurement#
After adjusting basic settings, you may start the test by clicking the Start button in the QC Control Panel. In acoustic tests, the noise or custom test signal should be audible and after the specified capture Time (+ Averaging + Preloop), the results are displayed.
Note
If activated, the Noise Floor is measured before the main measurement which doubles the total effective test time. Noise floor is only measured in QC Engineer mode.
Viewing Results#
Result Curves#
Depending on processing settings described in section Results & Processing, the frequency dependent MTD result curves are displayed in different results windows.
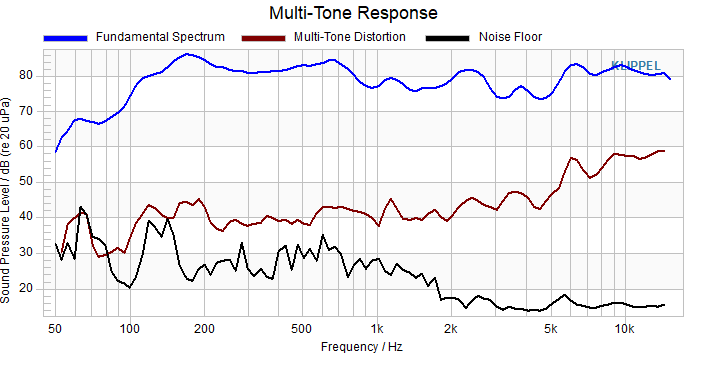
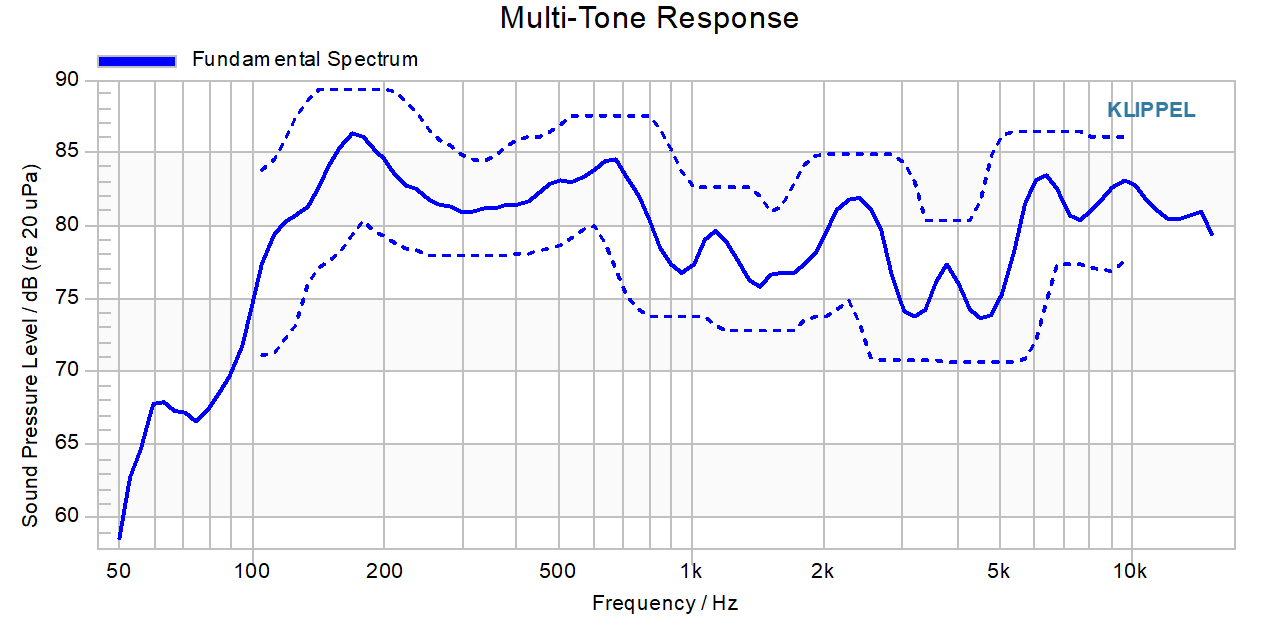
All absolute results such as Fundamental Spectrum or absolute MD are displayed Multi-tone Response window as a signal level (e.g., SPL). The following figure shows typical results for a vented broad-band speaker. In this example, the distortion is typically more than 30 dB below the fundamental components in low and mid frequency band. The noise floor is well below the multi-tone distortion showing that this test was done in the weak nonlinear domain for low and mid frequencies. At higher frequencies, the distortion level increases reducing its distance to the fundamental.
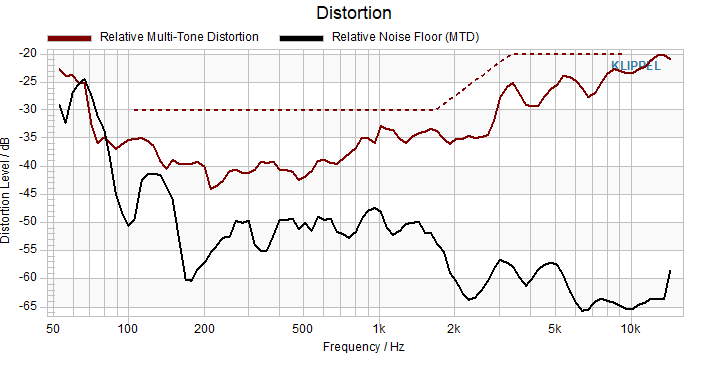
Switching to Relative MD, eases interpretation of both distortion and noise floor, significantly as shown in the chart below (Distortion window). Now the level difference to the neighboring fundamental component is instantly evident and absolute limits can be set more easily.
In order to obtain test limits relative to one or more “golden” reference units you may Activate Limit Calculation Mode to measure one or more reference units and calculate relative test limits (tolerance). Refer to section Defining Test Limits or QC User Manual / Test Configuration / Reference Units for more information.
Summary Window#
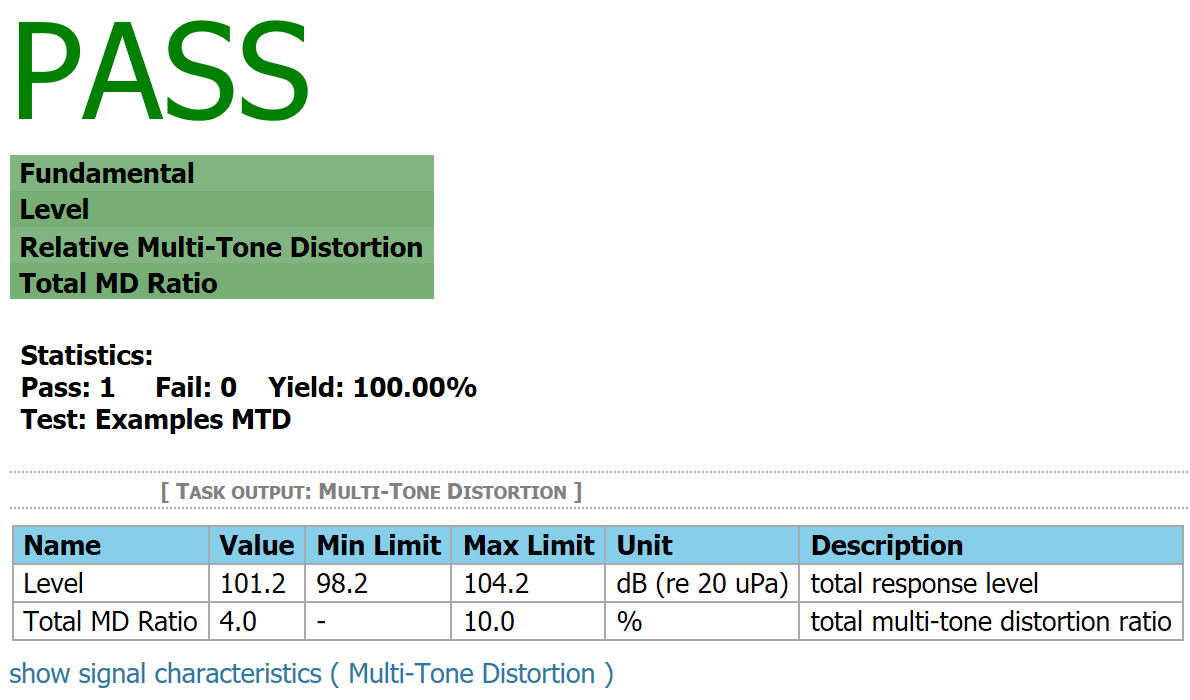
The Summary window shows both the result table for the single value parameters such as Level and Total MD Ratio as well as the limit check results for all MTD results. The example below shows the full output of a test sequence that only contains a single MTD task.
See the next chapter in this manual for defining and handling limits.
Working With the MTD Task#
This section offers a short overview about working with limits and saving tests as templates.
Defining Test Limits#
In the QC Engineer mode, the user can define tolerance limits for a series of DUTs using Limit Calculation Mode.
Select Limits tab on the Property page and click Activate Limit Calculation Mode.
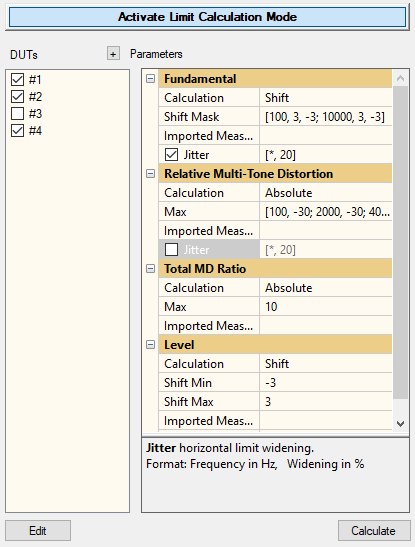
Measure one or more reference DUTs by clicking the Start button in the QC Control Panel. An arbitrary number of reference units/measurements can be collected, as long as the Limit Calculation Mode is activated. In this example, four reference measurements are collected.
Check result consistency in the result curve windows and select only valid reference measurements (in the example #3 was deactivated). Calculate limits by either pressing the Calculate button or by deactivating the Limit Calculation Mode.
The tolerance limits for valid DUTs are now calculated according to the Limit Parameters*. Different options to calculate limits are available. Find detailed information in QC User Manual / Test Configuration / Limit Calculation. There are no special limit modes available for multi-tone distortion task.
After limit calculation, the resulting limits are displayed in all curve result windows as well as the Summary window. Additionally, a reference DUT check is performed in order to check whether all active reference DUTs pass the limits as shown below.
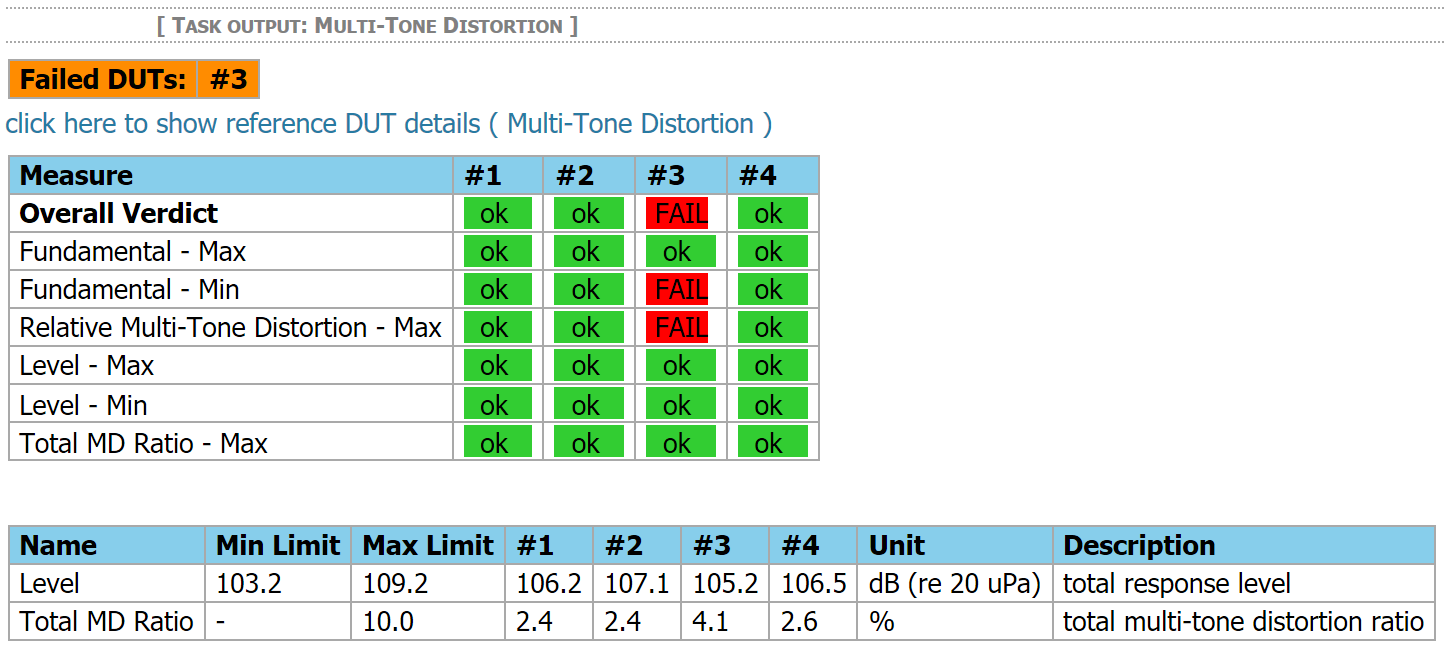
It is good practice to check limits against known bad units to ensure proper separation of good and bad units. All following measurements will be checked against limits.
Testing with Limits#
The measurement results of each regular test (not in Limit mode) are checked with respect to these limits to extract a Pass/Fail decision.
Saving Test Sequence as a Template#
After composing tasks sequences with tailored settings for measurement and limits, it is recommended to save it as a template as basis for creating quickly other similar test setups. All setup properties will be saved except actual measurement results, reference units and limits. Refer to QC User Manual / Test Configuration / Test Templates.
Customizing the MTD Task#
This section describes how to select an optimal setup parameters for the MTD task.
Stimulus Amplitude#
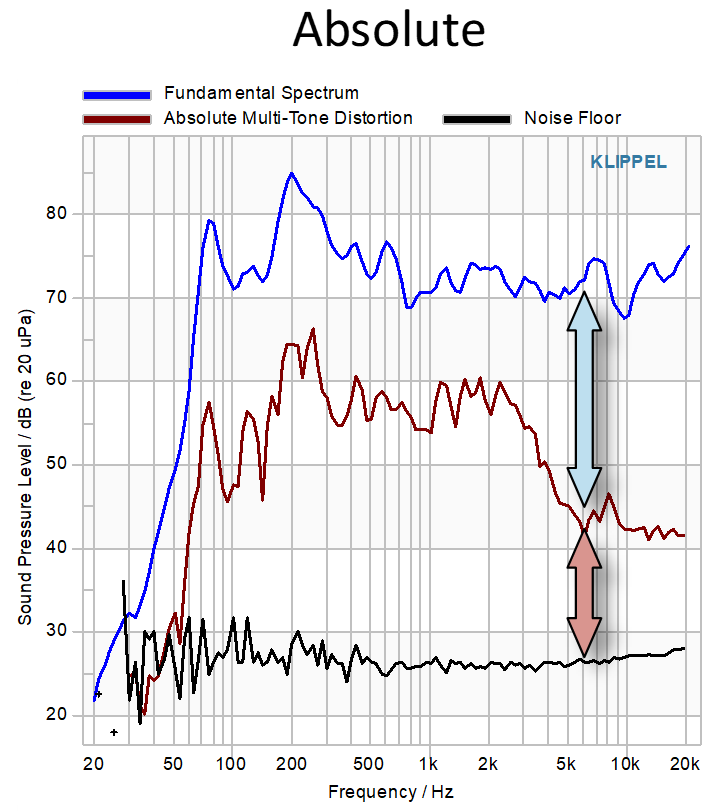
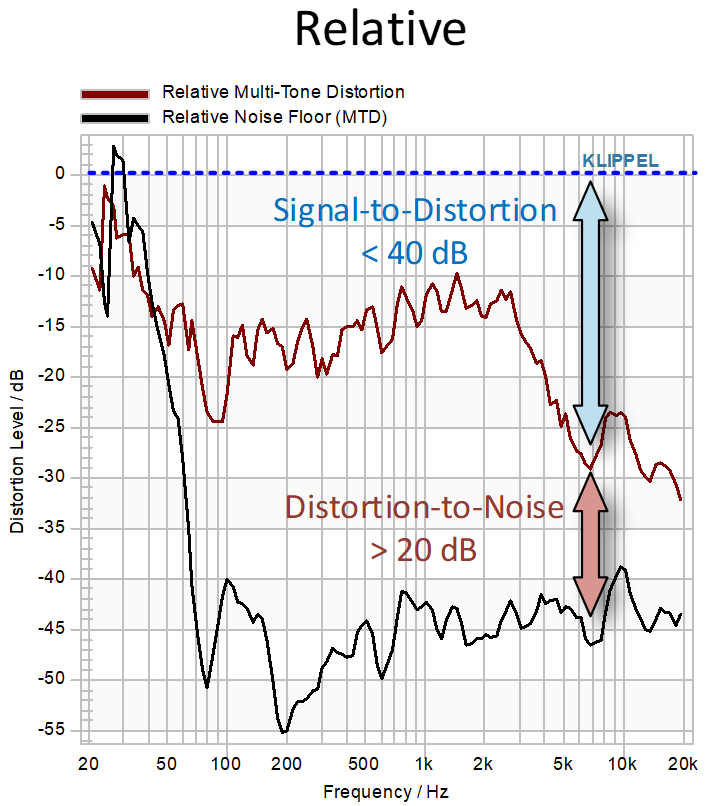
Any audio system produces frequency components (nonlinear distortion) that are not part of the stimulus. Driving the DUT at high output levels ensures critical test conditions by operating the DUT in the large signal range generating nonlinear distortion. The ratio (level difference) between fundamental spectrum and multi-tone distortion (signal-to-distortion ratio) should be less than 40 dB to ensure large signal operation. This corresponds to –40 dB (1 %) Relative MD or Total MD Ratio.
Further considerations should be done regarding the noise floor and its ratio to the measured parameters, especially the Multi-tone Distortion (distortion-to-noise ratio). It is recommended to achieve at least 20 dB here.
The following figures illustrate these ratios for a practical example on both absolute and relative scale:
Note
All suggested figures are rough guidelines and only apply in the pass band of the device under test. For devices with low SPL output, all conditions cannot always be fulfilled. In this case, carefully consider where to apply limits (only frequency ranges with sufficient noise ratio).
Resolution and Measurement Time#
Due to the principle of discrete spectral excitation to separate stimulus and distortion/noise, the resolution of the Multi-Tone Fundamental Spectrum interacts with the resolution of the Multi-Tone Distortion. Firstly, it defines the number result points. At least 3 points, better 12 per octave are recommended. A high resolution is closer to noise signals which have a dense spectrum whereas a lower fundamental resolution leaves more spectral components (more bandwidth) for each accumulated distortion result point.
Additionally, the measurement time t defines the spectral resolution of the base FFT spectrum (\(\triangle f = \frac{1}{t}\)).
Time and multi-tone resolution together define the number of spectral points between the excited frequencies which are available for the distortion analysis. Furthermore, especially at low frequency, where the number of spectral lines is small in one octave (log frequency axis applied to a linearly spaced spectrum), it limits the performance of the Multi-tone Distortion analysis.
A longer measurement time can adjust this by providing a higher overall frequency resolution of the FFT base spectrum.
Analyzing Different State Signals (Sound Pressure vs. Input Current)#
The input routing and the assigned sensor type implicitly determines the state to be measured by the MTD. Choosing a microphone input, the task results will be based on an acoustical measurement (sound pressure). Thus, the quality of the results will depend on the acoustical conditions and the environment of the measurement setup. A test enclosure or other means of acoustic shielding / isolation is recommended.
The MTD also allows analyzing the terminal voltage or input current of a passive speaker or transducer by selecting Input (Test Sensor) – Voltage linked to Speaker or Current linked to Speaker. Testing the input current allows analyzing distortion generated by the motor and suspension without acoustical disturbances. However, the performance of the distortion analysis is limited since some distortion mechanisms like Doppler distortion or modal vibration and radiation phenomena will not reflect in the current spectrum.
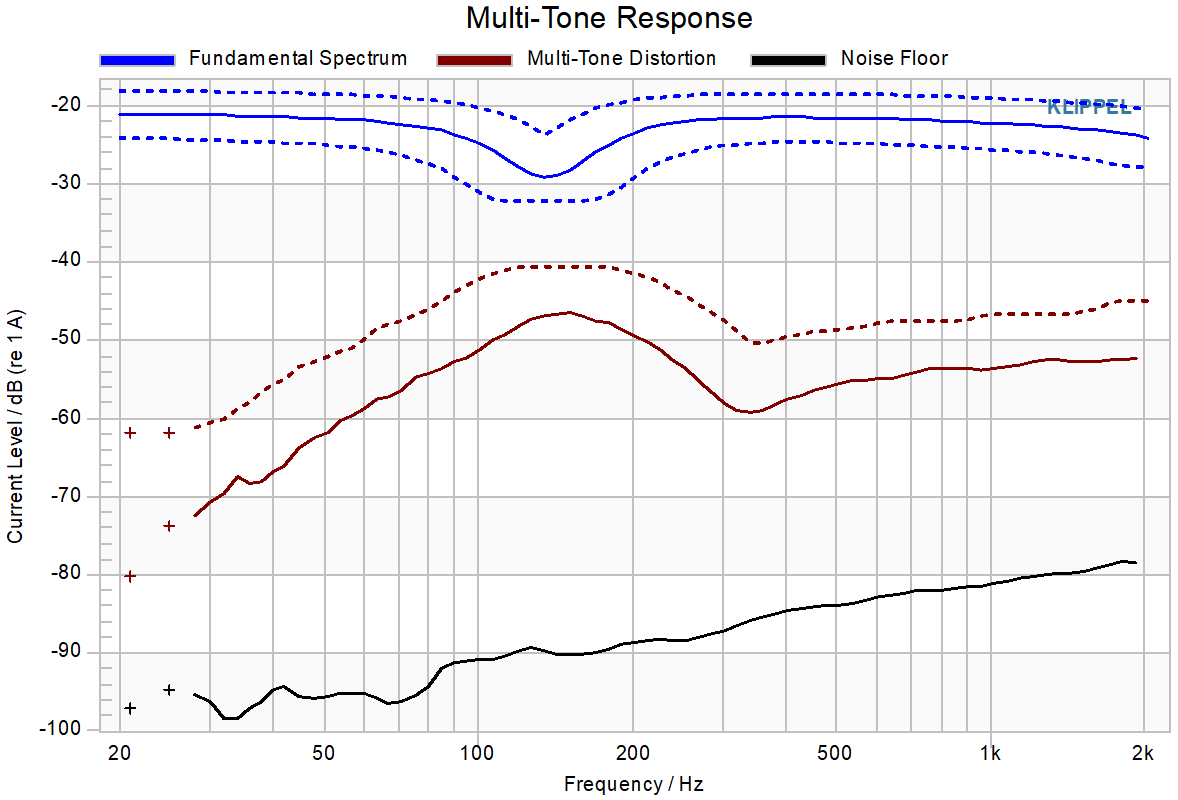
The relation between distortion in SPL and current are discussed in a paper available from Klippel website (W. Klippel: Loudspeaker Nonlinearities - Causes and Symptoms )
MTD Task in Wireless, Open-loop or Mixed Device Scenarios#
Multi-tone stimuli and the according analysis require accurately matched clocks in playback and capture channels. If this is not the case, the energy of excited frequencies in the spectral domain are not exactly mapped to the same frequencies in analysis but are smeared around those. Those artifacts will degrade the test result, especially in multi-tone distortion but also in multi-tone fundamental and derived results.
See also
Details about wireless testing using the R&D module MTON can be found in application note AN16 .
Currently, the MTD task cannot compensate sample clock mismatch or clock jitter. Thus, is not recommended to use MTD task in the following scenarios:
open loop testing: asynchronous playback or capture (WAVE-file export/import)
closed loop testing using wireless connection used for stimulus or sensor (e.g. Bluetooth wireless technology)
different audio devices for playback and capture channels (if not having synchronized clock)
MTD – Reference#
In this chapter any setup parameters, limit parameters and calculation methods are explained.
Task Parameters#
The table below lists and describes all available task parameters of the Multi-tone Distortion Task. These parameters provide flexible options to customize the measuring task.
Synchronization#
- External Synchronization
See SYN – External Synchronization for information about synchronizing mixed devices or open loop test scenarios. This setting is available only if a related execution mode is selected in the Control Task.
Stimulus#
- Min Frequency
- Min Frequency in HzRange: 0 \(< f_{\text{min}} < f_{\text{max}}\)
Lowest tone of multi-tone stimulus
- Max Frequency
- Max Frequency in HzRange: \(f_{\text{min}} < f_{\text{max}} < 0.418 \cdot f_{\text{sample}}\)
Highest tone of multi-tone stimulus.
- Time
- Time in sRange: 0.2 \(\leq t \leq\) 20
Duration of the main stimulus in seconds. This value is multiplied by the number of requested averages (Averaging) and a Preloop is added once as well, if requested.
Note
Note that the stimulus duration directly influences the analysis frequency resolution and thus the lowest possible analysis frequency. This interacts with the parameter Resolution (see Resolution and Measurement Time).
- Voltage / Stimulus Level
- Voltage in V
Specifies the RMS stimulus voltage for analog playback devices either at loudspeaker terminals (Speaker routing) or at line output in V.
Note
Note that the realized voltage may be less than the specified voltage due to finite output impedance of the power amplifier. See section Hardware / Calibration / Amplifier Gain Calibration in the QC Manual for details. For digital playback devices the level is specified as a digital level in dBFS (related to 0 dB full-scale signal).
Note
the peak value can be 3 to 4 times higher than the RMS value for multi-tone signals (high crest factor).
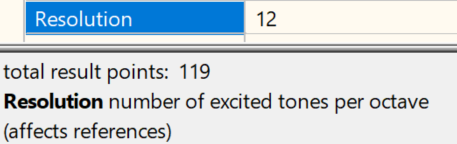
- Resolution
This parameter specified density of excited frequencies per octave. In the comment of this parameter, the total number of excited tones for the specified bandwidth is given.
Note
Note that the frequency resolution directly determines the spectrum resolution. See section Resolution and Measurement Time.
- Preloop
- Range: ≥ 0
This factor defines the relative duration of the pre-excitation before the actual measurement starts to achieve steady-state conditions. If a fractional number (<1) is defined, the signal is faded-in automatically. An integer number adds full repetitions of the main stimulus.
- Averaging
Using this factor, the main stimulus is repeated and the measurement is extended in order to average the measured data. This is useful to increase the signal to noise ratio. Any fractional number is rounded to the next integer value.
- Level Profile
This input mask allows defining a level profile for the multi-tone signal vs frequency (amplitude shaping). See Test Configuration / Test Signals / Multitone / Level Profile in QC User Manual for details.
Routing#
- Various Parameters
See QC-User manual section Test Configuration / Routing / Delay / GPIO control for routing configuration in a measurement task. These settings are available only if the Routing in the Control Task is at least partly set to controlled by Task.
- Test Sensor Input Channel
channel number of capture device or wave file that provides the test sensor signal. Only displayed with 3rd party capture device or Execution Mode - Load Input Sign and if Test Sensor Input is set to controlled by Task.
Note
for re-processing exported wave file data (see Qc Manual section Save Input Signal) use channel #1
- Voltage Input Channel
channel number of capture device or wave file that provides the voltage signal (DUT input). Only displayed with 3rd party capture device or Execution Mode is set to Load Input.
Note
for re-processing exported wave file data (see Qc Manual section Save Input Signals) use channel #2
Results#
- Fundamental
Measure the response spectrum or transfer function of the excited frequencies in the multi-tone signal. Results are displayed in Multi-Tone Distortion window.
Note
Note that only spectral components excited by stimulus are taken into account according to selected frequency resolution (without distortion and noise components in between excited frequencies).
- Level
Measure the total AC response level (full response signal) in dB.
- Multi-Tone Distortion (MD)
Measure the spectral multi-tone distortion (MD). Choose between absolute (band level) or relative (to fundamental) calculation mode using Processing option MD – Relative. Additionally, select mode of calculation in Multi-tone - Type. The detailed definition of the calculation methods is specified in section Multi-tone Distortion.
- Total MD Ratio
Measure the total multi-tone distortion ratio in dB or percent (setting Total MD Ratio – Unit)
- Noise Floor
Activate this parameter to perform pre-measurement without excitation to determine absolute or relative noise floor. Noise floor is measured only in engineer mode for SNR check; no limits can be applied. See section Stimulus Amplitude for more information.
Processing#
- Fundamental - Mode
- Range: Spectrum; Transfer Function; Frequency Response
Select the calculation method for the Fundamental:
Spectrum: use response spectrum magnitude level.
Transfer Function: calculate transfer function based on excitation and response spectrum.
Frequency Response: emulated fundamental frequency response for sinusoidal excitation (RMS voltage = Voltage) according to IEC 60268-21
See section Multi-Tone Fundamental for more information.
- Fundamental - Reference
- Range: Stimulus; Terminal Voltage
Select reference signal (denominator) for transfer function and frequency response calculation:
Stimulus: stimulus (output) spectrum.
Terminal Voltage: measured voltage spectrum at the speaker terminals (recommended).
Note
This parameter is only available if Fundamental – Mode is set to any other than Spectrum and if a Speaker output routing is used.
- Fundamental - Smoothing
- Range: \(1 \leq Smoothing \leq 99\)
Part of octave used for curve smoothing of multi-tone fundamental. No smoothing is applied if value is empty.
- MD - Smoothing
- Range: \(1 \leq Smoothing \leq 99\)
Parts per octave for curve smoothing of multi-tone distortion and noise floor. No smoothing is applied if value is empty.
Note
This is a legacy option and is only displayed in compatibility mode, use Fundamental – Smoothing instead to smooth relative MD.
- MD - Type
- Range: Band Level; Max. Level
Select the calculation mode of spectral multi-tone distortion to define how the frequency bands between excited fundamental frequencies are aggregated:
Band Level: total level of full band (recommended).
Max. Level: level of dominant spectral component in band (legacy)
See section Multi-tone Distortion for more information.
- MD - Relative
If selected, the spectral MD and noise floor are calculated relative to fundamental (recommended). The relative curves are displayed in Distortion window. Otherwise, the absolute distortion level is used and displayed in Multi-Tone Response window.
See section Multi-tone Distortion for more information.- MD - Unit
- Range: dB; %
Select the display unit for relative MD, Total MD Ratio and relative noise floor.
- Input Gain 1/2
Input preamplifier gain for KLIPPEL Analyzer inputs to optimize SNR. Effective range and available gain steps depend on used analyzer/card, please refer to hardware specification
Note
Negative input gain cannot compensate overload of analog input stage
- Recording Delay
Defines a fixed delay of the captured signal relative to generator in ms.
Customization#
- Various Parameters
See separate QC-Feature Libraries for details on Add-Ons and how to configure additional functionality. This section is available only if any Feature Library is installed and activated.
Display#
- Multi-Tone Response - Ymax/Ymin
Maximum/minimum level of the y-axis in Multi-tone Response window in dB.
- Custom Colors
Allows the modification of standard colors for measured curves. Enable option to expand menu for individual color access.
For limit parameters, please see section Test Configuration / Limit Calculation in QC-User manual.
Definition of Results#
Level#
The (input) level L is a single value result that represents the total measured AC RMS level such as sound pressure level
with
Multi-Tone Fundamental#
All results of the MTD Task (except for level) are based on the FFT spectrum of the selected input signal and the stimulus voltage spectrum, depending on the calculation mode.
The complex spectrum for the sound pressure
is based on the Fourier transform of the measured sound pressure waveform p(t) or any other captured signal such as voltage, displacement or acceleration.
The fundamental of the multi-tone spectrum is based on the excited frequencies \(f_i\) only. Assuming a synchronous capture and playback device, the excited lines are exactly matched in the response spectrum. Clock drift or sample rate may cause spectral leakage, which currently is not handled.
The following definitions will refer to sound pressure only, but the information applies to any other state signal.
Different calculation methods are available for the Multi-Tone Fundamental.
Fundamental Spectrum#
The fundamental spectrum magnitude level of the sound pressure is defined as follows:
Transfer Function#
The transfer function magnitude describes the transfer behavior between stimulus signal (stimulus voltage or DUT terminal voltage) and measured response signal (e.g., sound pressure) over frequency.
The transfer function H(f,r) according to IEC 60268-21 describes the linear transfer behavior of a DUT between the stimulus signal u(t) and the sound pressure output p(t,r) at the measurement point r measured using a broadband stimulus
with
The sound pressure signal p(t,r) is measured at the stated measurement point r that shall be static and thus neglected in the following equations. The complex sound pressure spectrum
is calculated using Fourier transform.
The sound pressure transfer function is calculated for the excited fundamental frequencies \(f_i\) by
The transfer function magnitude level is calculated as follows:
For an ideal linear system, the transfer function is independent of the applied stimulus RMS voltage. However, compression and nonlinear distortion typically alter the transfer behavior depending on the amplitude.
An alternative way to evaluate the linear transfer behavior over frequency is the emulated (SPL) Frequency Response that can be interpreted as a sound pressure level.
Note
The voltage spectrum in the denominator can either represent the ideal stimulus voltage signal (analyzer or calculated amp output) or the measured DUT input terminal voltage (measured amplifier output). This depends on the selected output routing and can be controlled by MTD Processing property Fundamental - Reference.
(SPL) Frequency Response#
Strictly speaking, the SPL Frequency Response according to IEC 60268-21 reflects the fundamental (sound pressure level) response to a narrow band excitation signal with varying frequency (e.g., sinusoidal sweep) at constant excitation level.
Since this parameter is commonly known and easy to interpret, it can be emulated based on the transfer function H(fi) that can be measured with any broad band stimulus signal such as a multi-tone signal at the excited frequencies by
This yields a sound pressure level in dB since the transfer function denominator (stimulus voltage spectrum) is normalized with the RMS stimulus voltage.
Note
The frequency response assumes a sinusoidal signal with the same RMS voltage as used for the SAN Task measurement. Although this neglects any stimulus-dependent, nonlinear effects such as compression, the results are directly comparable to a sinusoidal measurement (e.g., SPL Task) for the same stimulus RMS level (at small amplitudes).
Smoothing#
Smoothing can be applied to any multi-tone fundamental level curve, optionally. It is a moving average using the defined octave fraction bandwidth for each individual point.
Note
At min and max frequency smoothing is limited due to bandwidth restriction.
Multi-tone Distortion#
The multi-tone distortion spectrum (MDS) in accordance with 60268-21 shall be approximated by the sound pressure spectrum wherein all fundamental components at frequencies \(f_i\) with i = 1, … , N are set to zero:
Absolute Multi-Tone Distortion#
Based on the previously mentioned assumptions, the full multi-tone distortion spectrum can be reduced to band levels by integrating the energy of the unexcited neighboring frequency bands around the fundamental frequencies. This yields the absolute multi-tone distortion level
This definition applies for MD – Type: Band Level setting which is recommended in general.
Note
When using MD – Type – Max. Level setting, instead of the total band RMS level of the unexcited bands, only the maximum value of the dominant spectral component within the observed band is taken into account. Since this is highly susceptible to fluctuation and depends on the available spectral resolution, this mode is generally not recommended and only exists for compatibility reasons with earlier versions of the MTD Task.
Relative Spectral Multi-Tone Distortion#
Based on the previously defined absolute spectral MD, the relative spectral multi-tone distortion (RMD) is defined as the energy ratio of the integrated multi-tone and the fundamental component at \(f_i\):
The relative MD can also be expressed in percent by
Note
The RMD depends on the spectral properties of the multi-tone stimulus u(t) and the nonlinearities of the DUT. Under the assumption that nonlinearities in the acoustical system generating nonlinear distortion with different directivity patterns are negligible, the RMD is independent of the position of the test point and is identical with RMD in the distorted input signal u’(t).
Smoothing#
Using parameter MD, Noise Floor – Smoothing, moving average smoothing can be applied to the Noise Floor and Distortion curves. However, due to the band level integration, smoothing is usually not necessary.
Note
However, for relative MD this is different since the fundamental level used for the calculation is only based on discrete frequencies and can thus introduce significant fluctuation. Therefore, it is highly recommended to use Fundamental - Smoothing with a wide bandwidth (wider than selected Resolution). This implicitly effects also the relative MD and Noise Floor curves.
Total Multi-Tone Distortion Ratio#
The total multi-tone distortion ratio (TMDR) is defined as a ratio of RMS value of the total distortion and the rms value of the total sound pressure signal:
The ratio can also be expressed in decibels:
Noise Floor#
The noise floor is processed in the same way as the spectral multi-tone distortion (see Multi-tone Distortion) but it is based on the measured signal without stimulus excitation. Therefore, the noise floor inherits all settings for multi-tone distortion.
