
TBM – Tone Burst Measurement#
This module provides an automatic tone burst measurement based on standard CTA-2010-A/B and CTA-2034 (formerly CEA-2010-A/B and ANSI/CEA-2034).
TBM Tutorial#
Viewing TBM Results#
Measurement Database#
Example data used in this manual is stored in the Web Example database. If not downloaded already, get it from the latest R&D release <https://www.klippel.de/go/current-rnd-release> and open the web-based database.
See also
View Results for general information on how to download this database, open and view results in dB-Lab.
Select in the folder Frequency Response + Distortion (TRF, DIS, TBM, SPL, ALD, 3DL, MTON, MTD, LAA) the driver object Subwoofer (TBM). Please refer to the dB-Lab manual section for navigating within or selecting databases.

After double clicking on the operation ANSI/CTA2010A measurement the default result windows will be opened. There are two kinds of result windows:
Windows with information about all measurement frequencies
Windows with information about measurements at the selected frequency.
Summary#
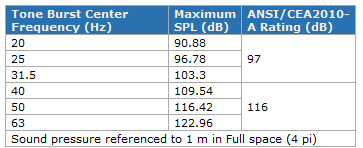
The Summary window summarizes the peak SPL of each frequency in dB. This result corresponds with the standards (CTA-2010-A/B or CTA-2034) as it is configured in the settings.
Other information as settings, measurement conditions, warnings and errors during the operation are included in this result window as well.
Y1(f) Spectrum#
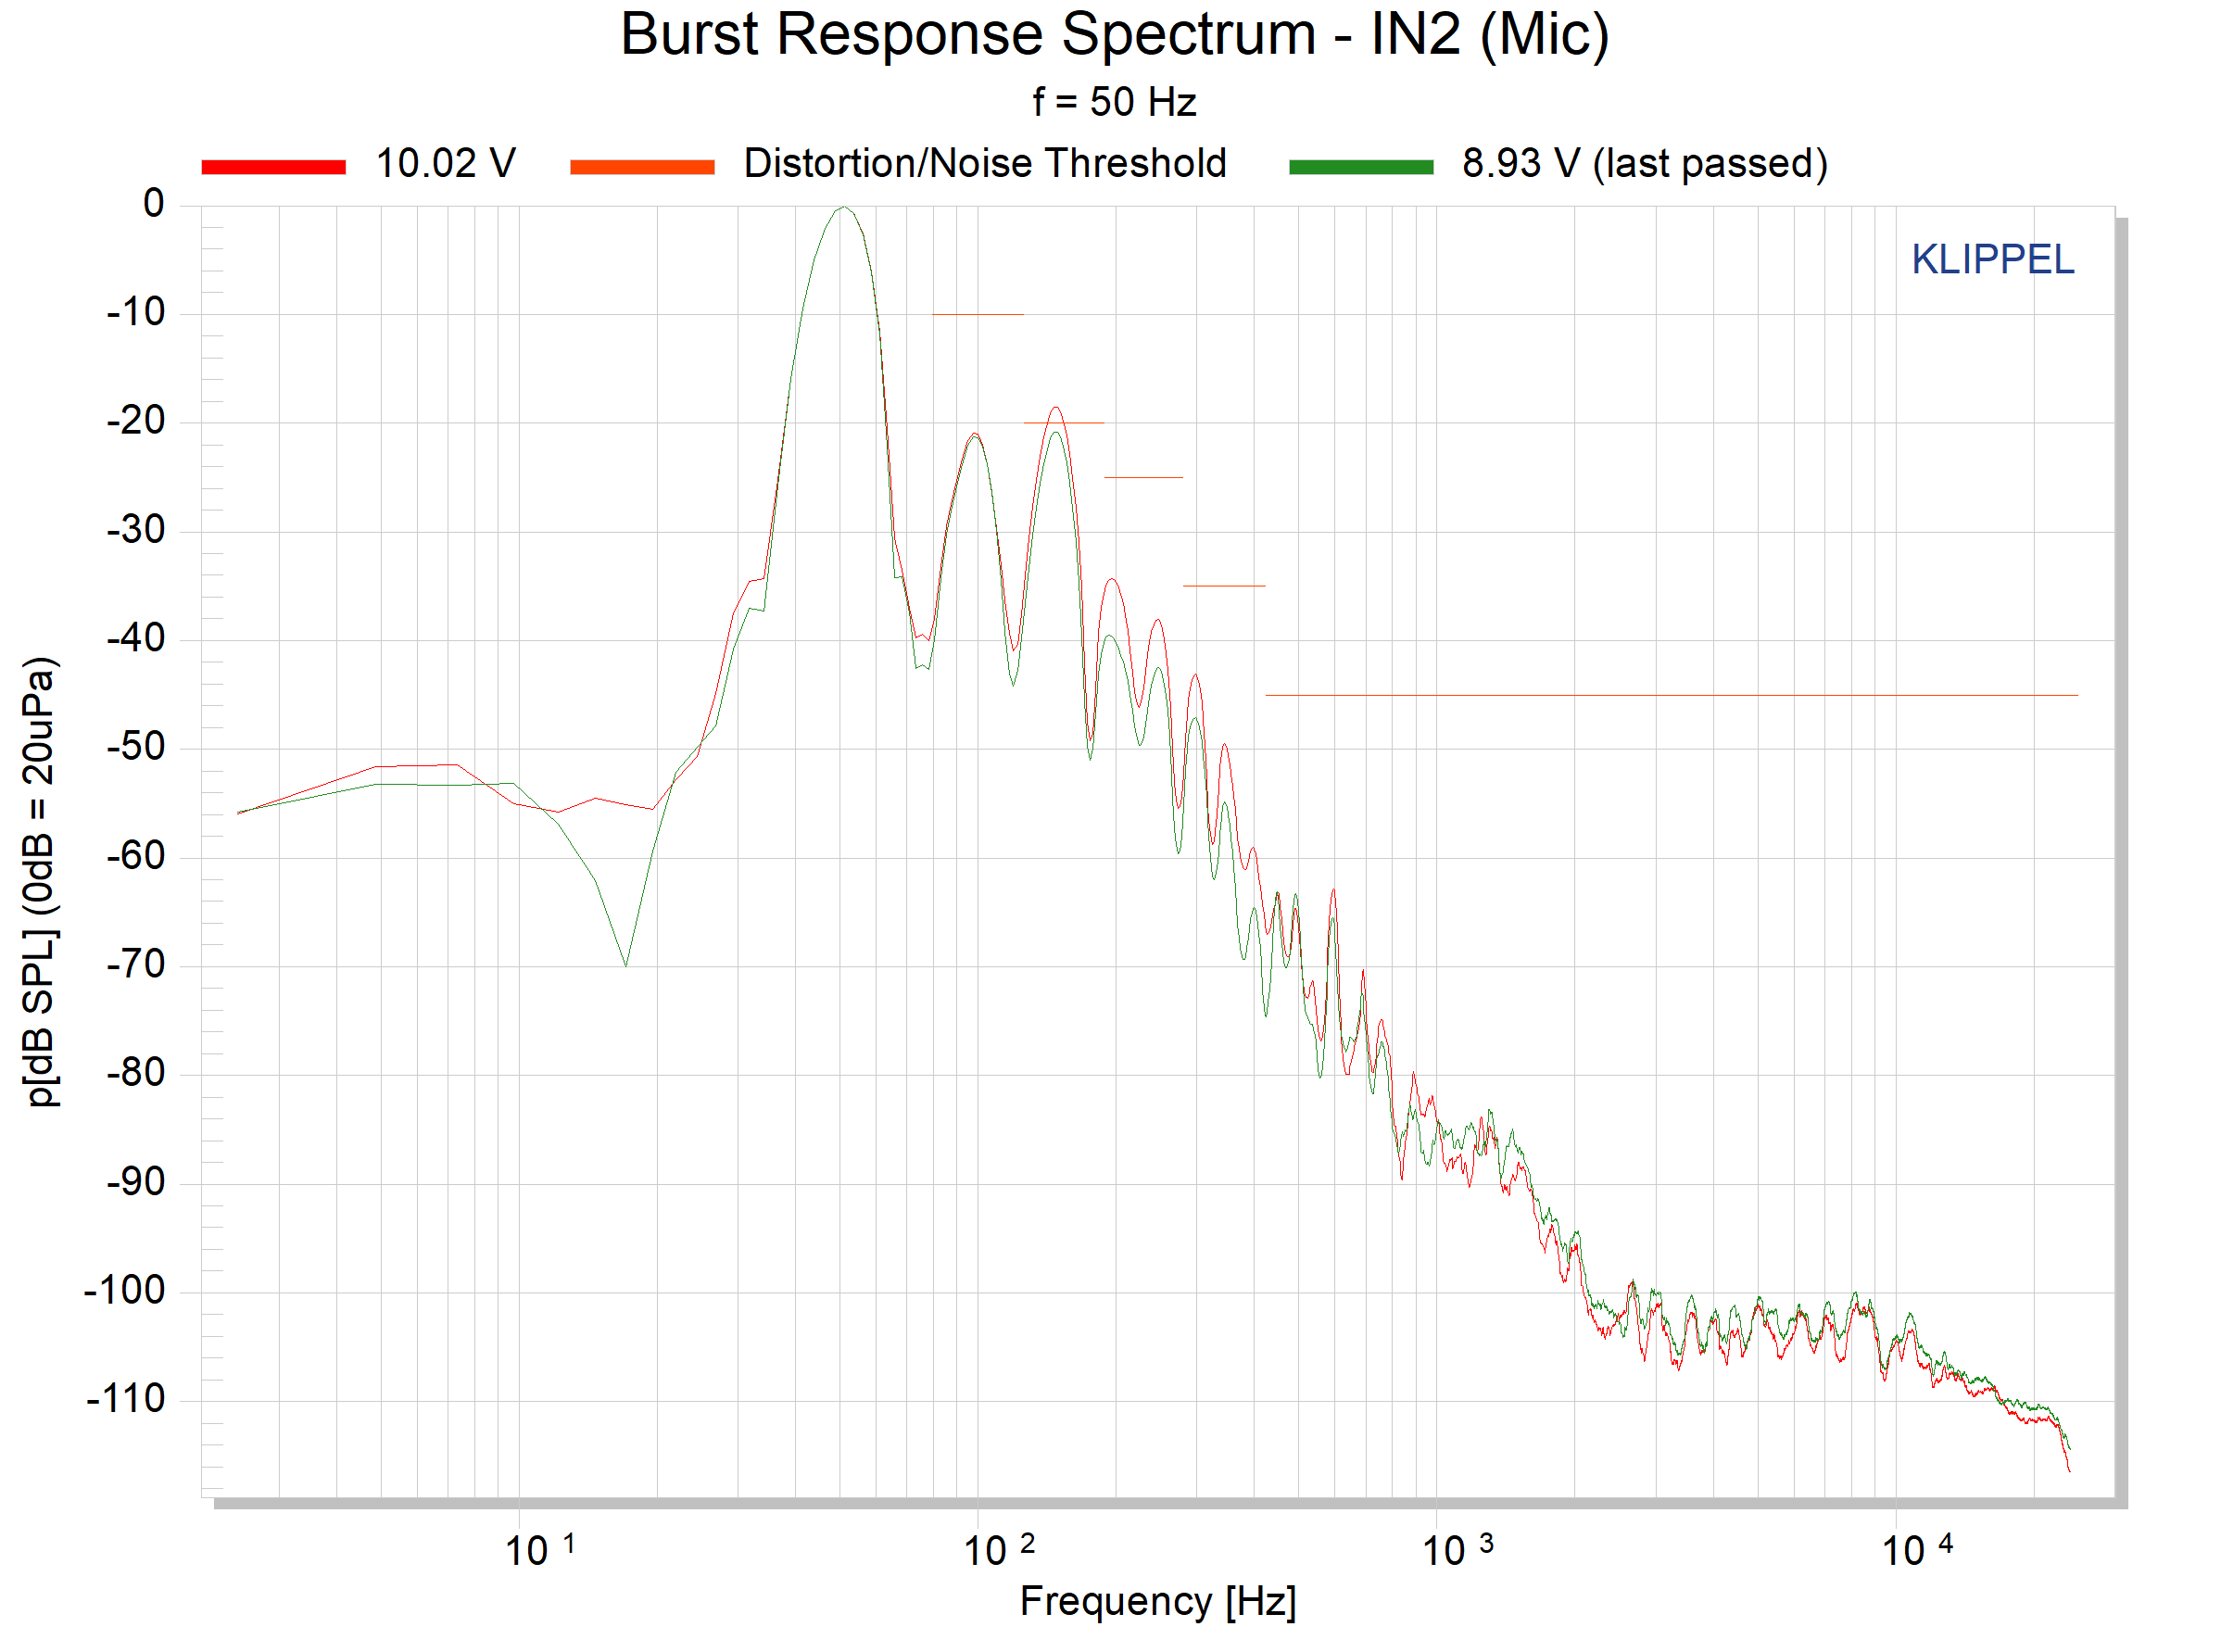
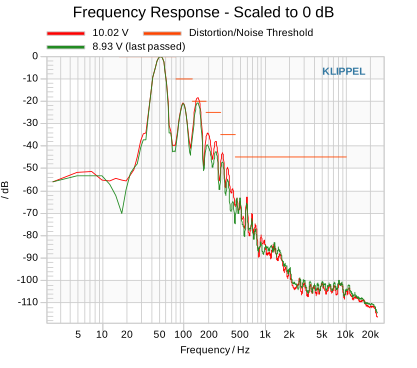
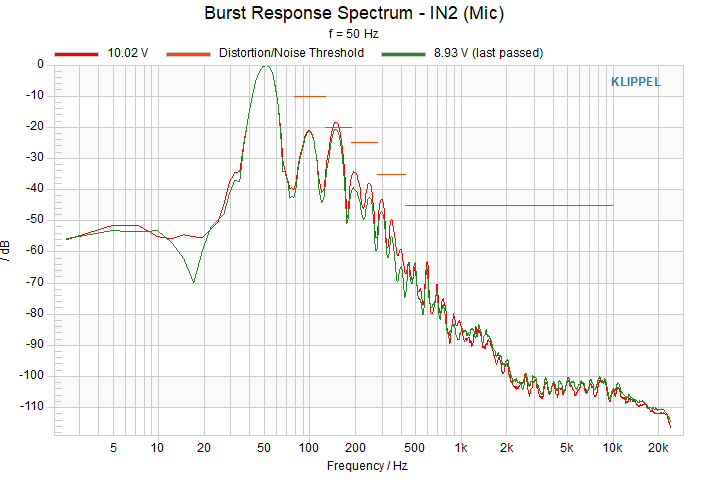
The window Y1(f) Spectrum shows the spectrum of the selected measurement frequency.
If thresholds are defined, the fundamental peak is normalized to 0 dB. The fundamental is normalized to the peak SPL in the frequency range which is defined by the fundamental threshold.
Note
How to normalize the fundamental is not exactly defined in CTA standards. By the implemented method, humming components or resonances that are higher in amplitude than the actual fundamental component will attenuate distortion by the normalization. This may be rather critical at a lower level close to the noise floor but not for higher levels close to the maximum SPL.
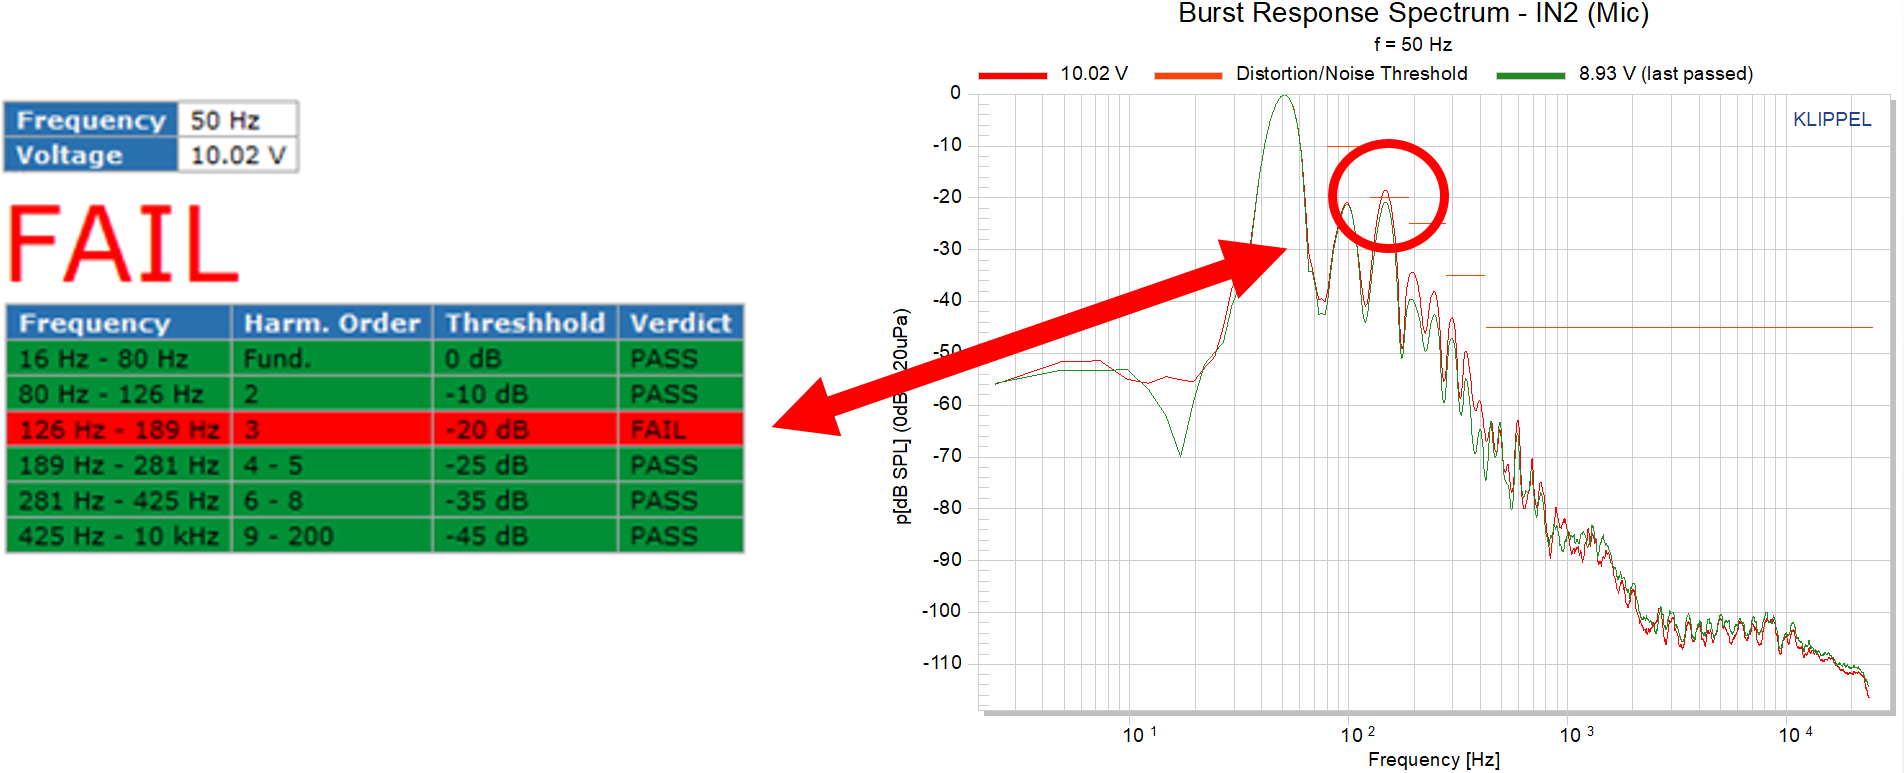
Harmonics are therefore relative to the fundamental and are tested against the defined thresholds. If a measurement violates a threshold (measure color gets red), the last passed result (green curve, measured at a lower level at the same frequency) is also shown. The spectrum illustrates the particularities of the distortion, which define the maximum SPL. As seen in the picture, the example speaker is limited by the 3rd order harmonics distortion.
y1(t) Time Signal#
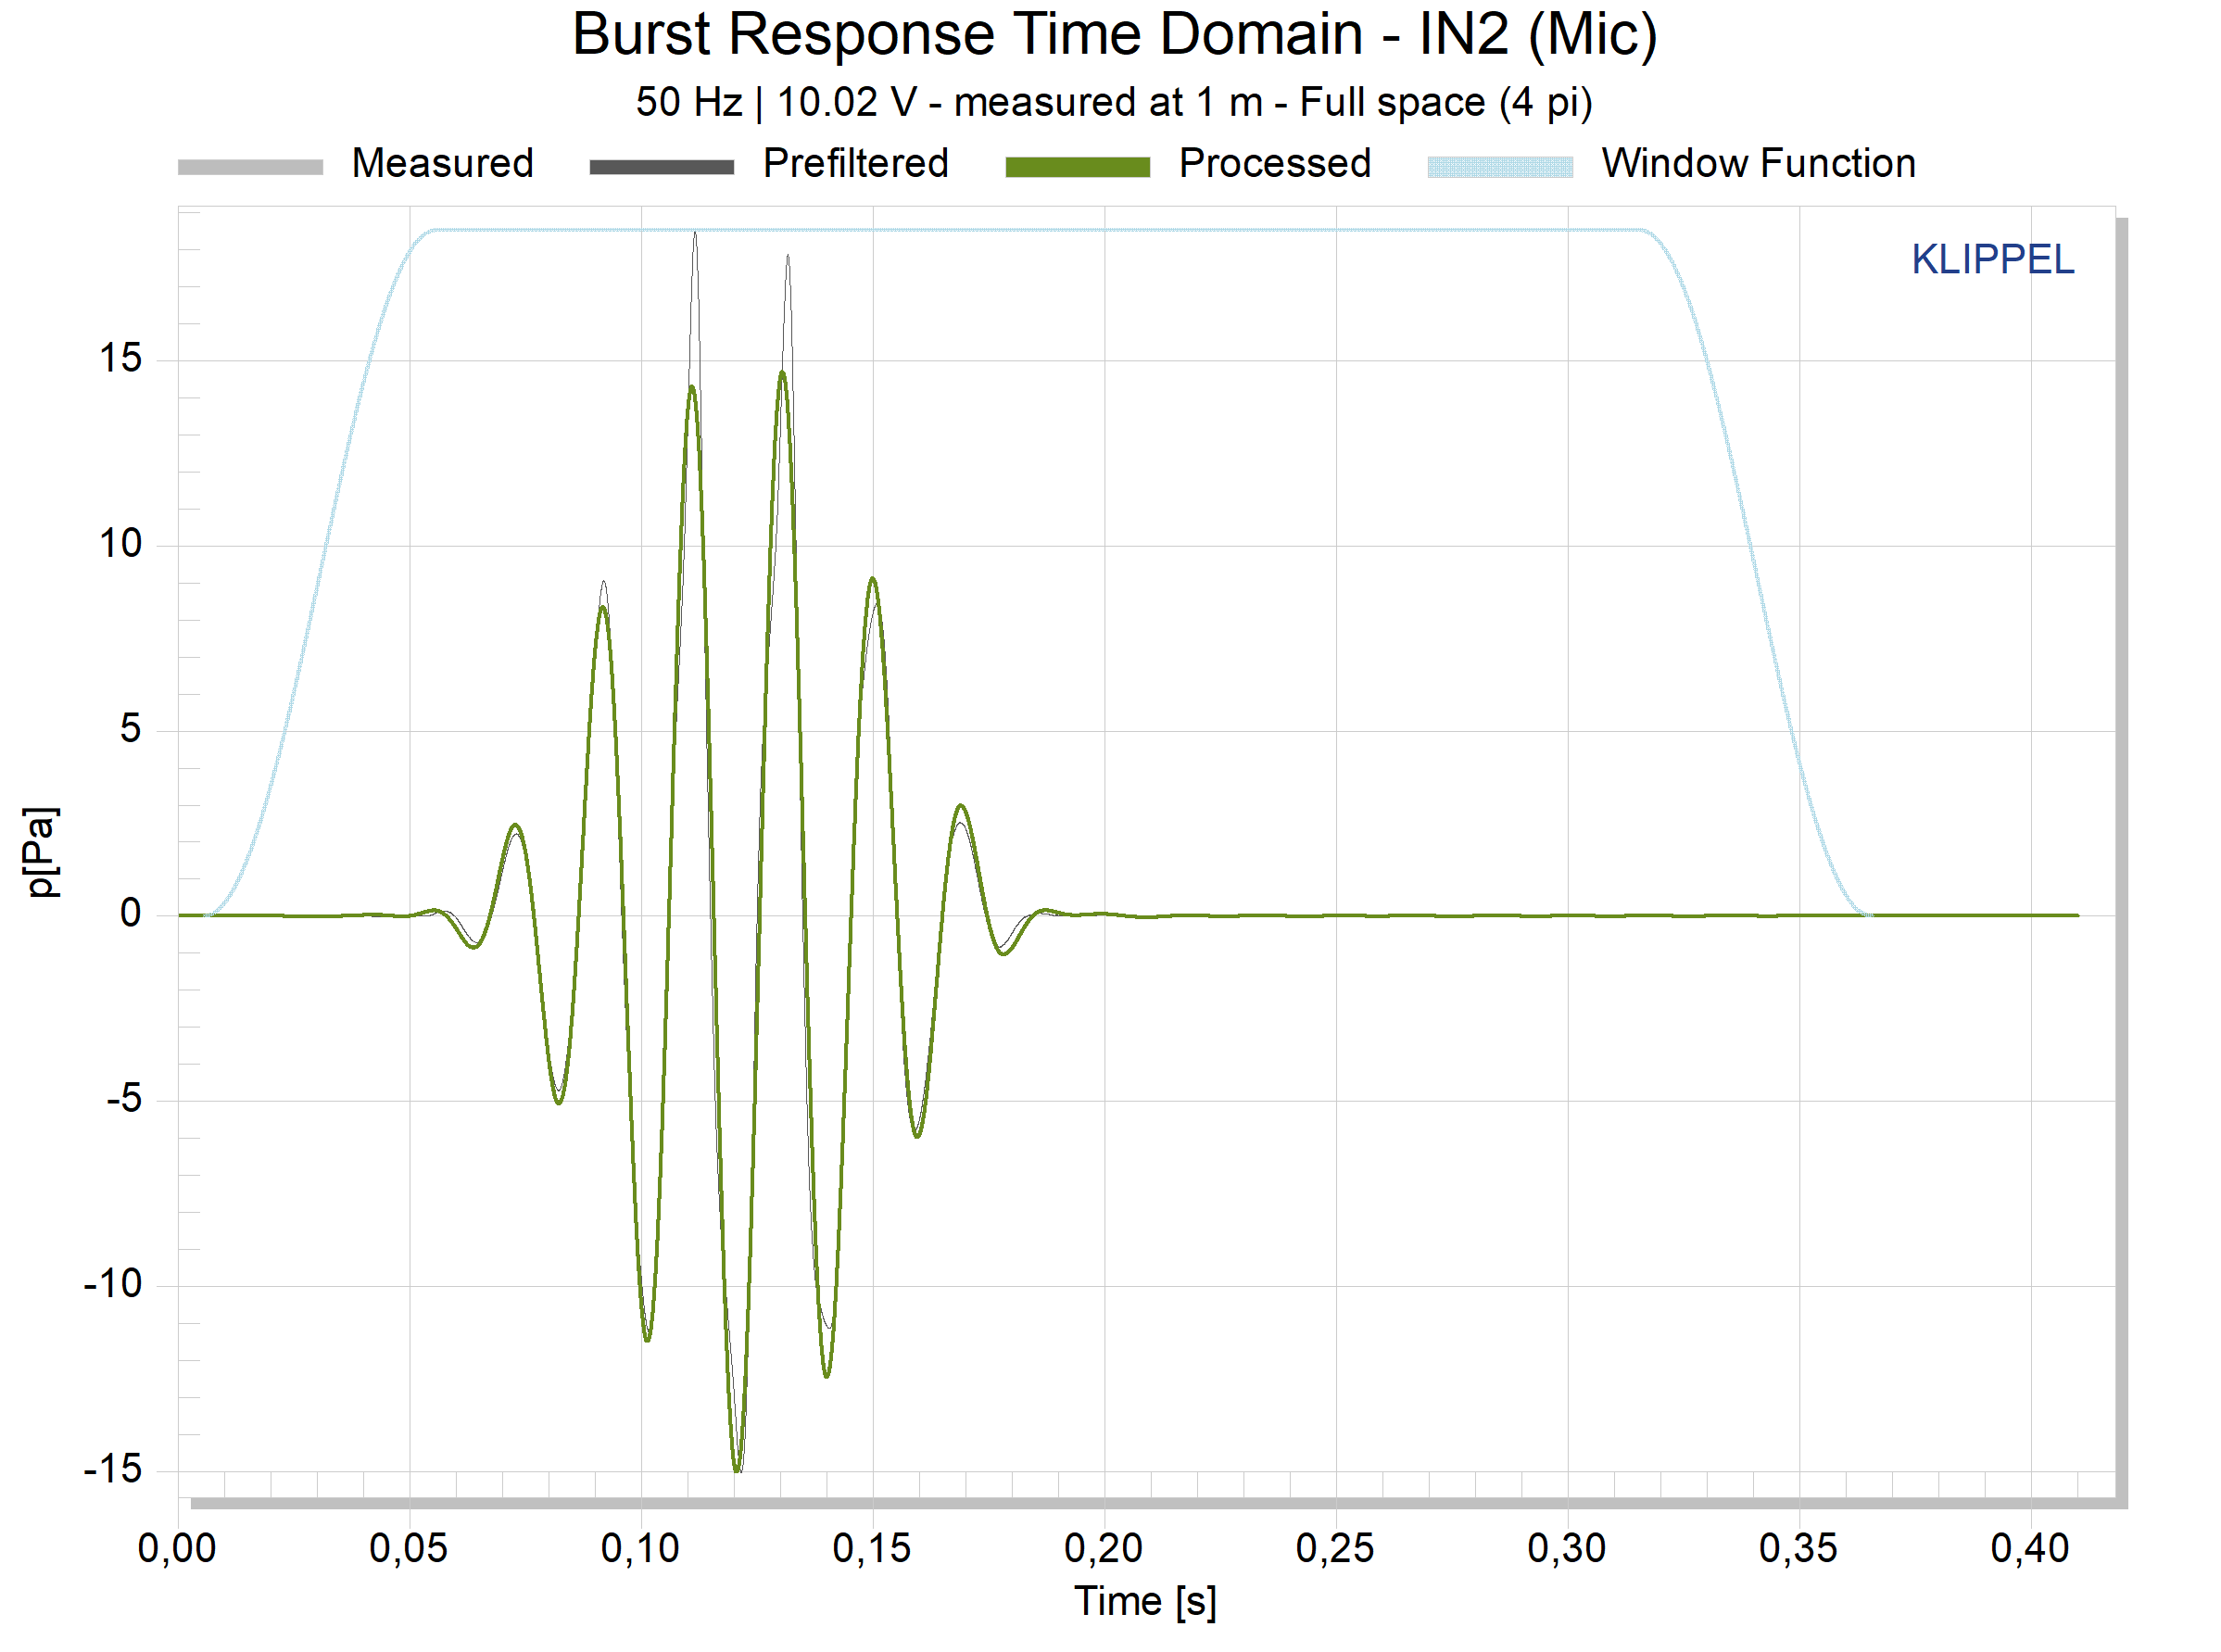
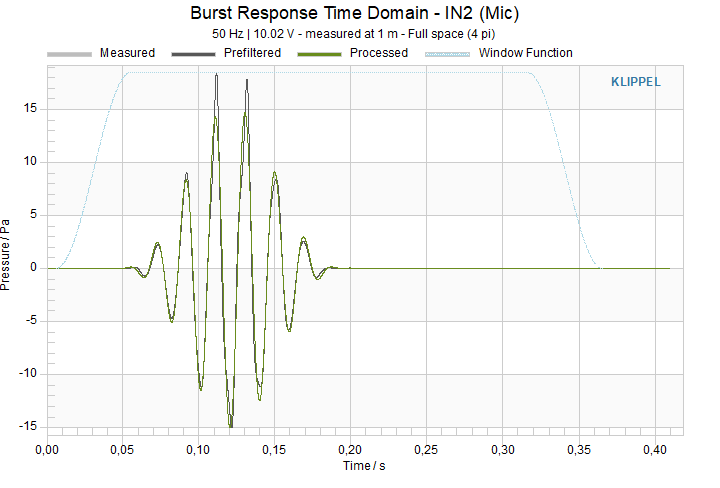
The window y1(t) Time Signal shows the time signal of the selected frequency and voltage. In addition, the windowed and band-passed signal is shown, from which the peak value is denoted as peak SPL. If a filter is used that compensates the influence of the measurement room the filtered time signal is shown as well.
Y1 Peak Value and Table Peak Results#
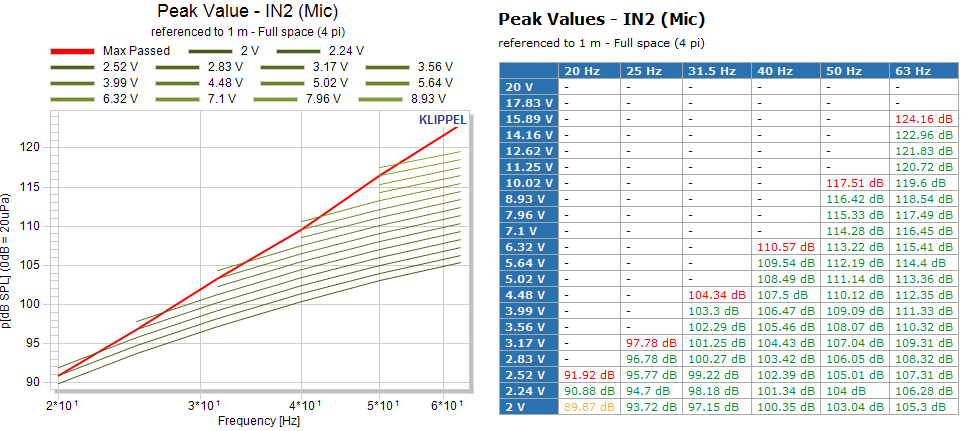
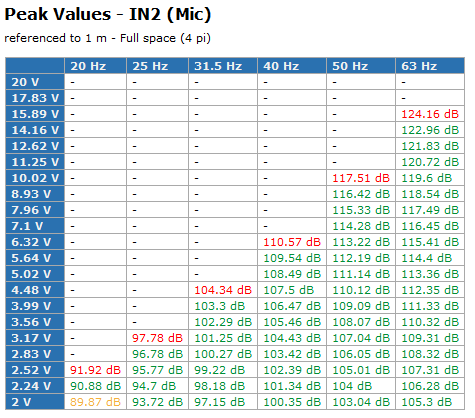
The measured peak SPL values of all measurements are summarized in the Table Peak Results. Green values are passed measurement, red values are failed measurements and yellow values are failed measurements, which are below the neglected voltage.
The window Y1 Peak Value visualizes the values from the table. The peak SPL can be shown dependent from frequency or from voltage.
Performing a Measurement#
This part of the tutorial guides through a first measurement. As typical example, the ANSI/CTA-2010-A measurement is performed for a woofer.
CTA-2010A/B#
Hardware Setup#
The measurement requires the Distortion Analyzer 2 or the Klippel Analyzer 3 hardware. Dependent if the device under test is an active or a passive speaker connect the cables with the following setup.
Passive Speaker#
Connect the Distortion Analyzer with the amplifier (OUT1 to Amplifier Input, Amplifier Output to Amplifier Connector of the analyzer).
Connect Analyzer with the driver. Use Speaker cable and connect Speaker 1 output with driver terminals.
Connect microphone to IN2.
Connect Analyzer via USB to a Computer.
Connect power supply to Analyzer.
Switch hardware unit on.
Active Speaker#
Connect the Analyzer with the DUT. (OUT1 output with Input of the speaker).
Connect microphone signal output to IN1.
Connect Analyzer via USB to a Computer.
Connect power supply to Analyzer.
Switch hardware unit on.
Note
For active speakers it is not possible to measure Current and Voltage responses.
Create CTA-2010-A Measurement Operation#
Create a new database. Create a new object () from the ANSI/CTA2010B Object Template.
TBM Measurement Setup#
Create a new TBM Tone Burst Measurement operation and the select the ANSI/CTA2010A template.
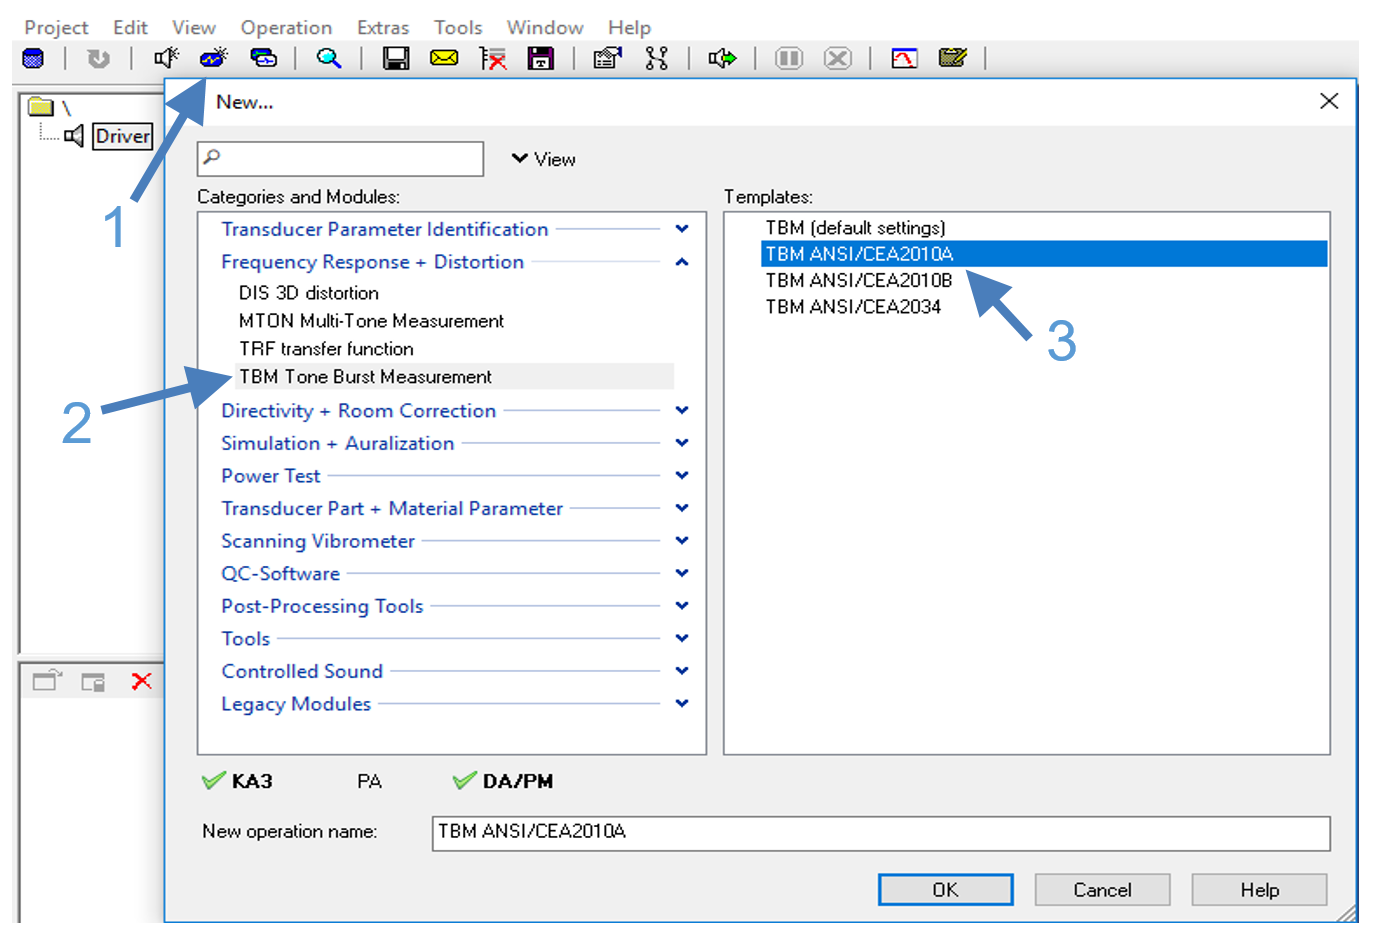
Open the Properties Page to configure the operation. The setup of the template has relevant settings to meet the requirements of the CTA-2010-A standard.
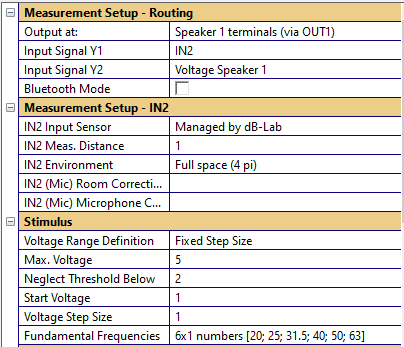
To run a successful measurement, please check the following required settings according to your setup:
- Input Signal Y1
Define the Channel the Microphone is connected to
- Output at
Define the output routing, and where the defined voltage should be realized (at Speaker terminals or at OUT of Distortion Analyzer)
- IN1 Meas. Distance
Distance between Microphone and DUT in meters
- IN1 Environment
Measurement environment (Half space / Full space)
- Start Voltage
Start Voltage in Volts
- Neglect threshold below
Voltage the measurement is continued up to, even if the threshold curve is reached. This should be a save voltage the connected loudspeaker can withstand. Measurements up to this voltage will be realized for all frequencies.
- Max. Voltage
Maximum Voltage in Volts
Start Measurement#
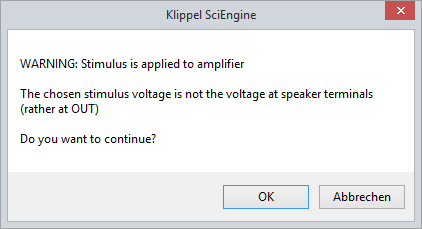
After checking all connections, start the measurement by clicking on the start button  . If
input parameter Output at is OUT1 or OUT2, a warning is shown that the voltage defined is applied
at the input of amplifier.
. If
input parameter Output at is OUT1 or OUT2, a warning is shown that the voltage defined is applied
at the input of amplifier.
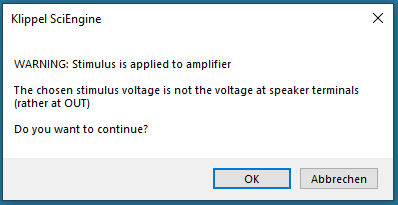
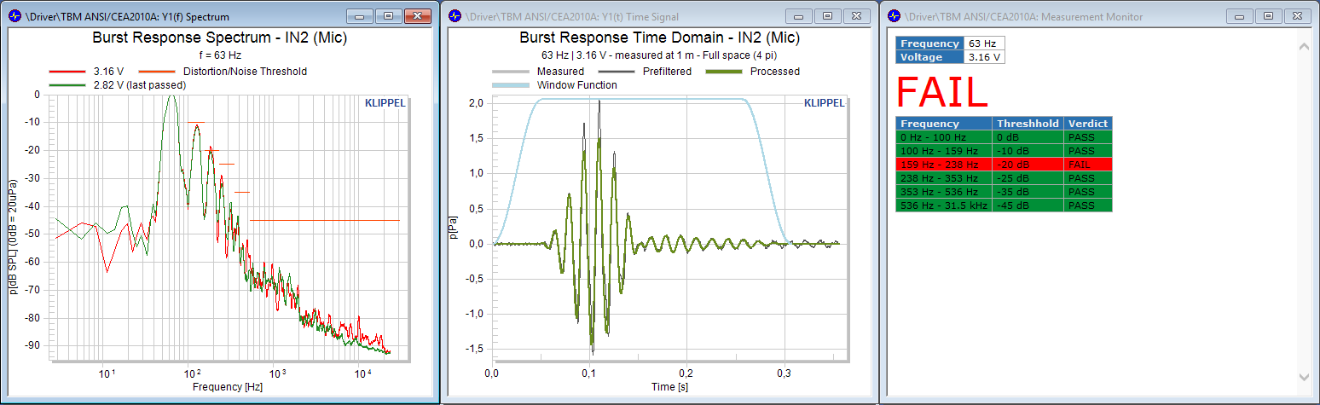
After clicking OK the operation will start at the lowest frequency. The voltage of the tone burst signal is increased until the peak SPL is reached. During the measurement, the result windows are showing the signals of the last measurement e.g time signal and the spectrum. In addtion, the Measurement Monitor window summarizes the results of the limit check. It shows which limits are reached.
Customizing TBM#
In this part of the tutorial various advanced aspects are discussed to use more powerful features and improve the performance of the TBM measurement. To see all parameter please activate the parameter Show Advanced Settings.
Definition of fundamental frequencies#
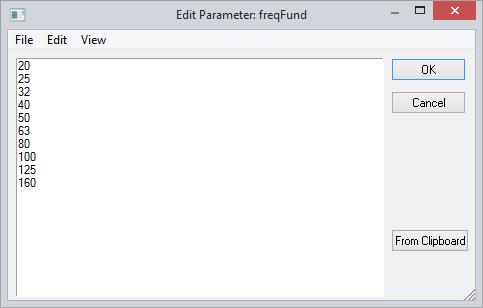
The definition of the frequencies to be analyzed can be determined. Through the input parameter Fundamental Frequencies: in this case the frequencies to be analyzed will be listed directly in this parameter. Edit the list, to customize the frequencies to be analyzed.
Definition of threshold#
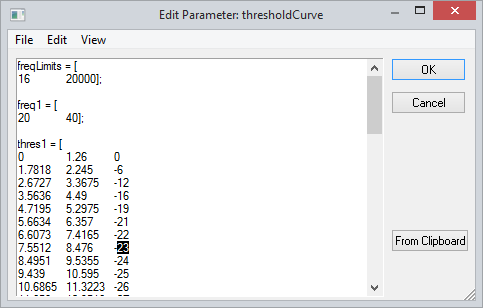
The threshold to compare the frequency responses is defined through Threshold curves. This input parameter is defined as a structure that can set up to 5 different thresholds. It is necessary to define at least one threshold (thres1). The thresholds are defined by a 3-column matrix in the form of: [min, max, threshold level]. Min and Max are the boundaries the threshold applies as multiples of the fundamental frequency. Adjust the levels in this table, to change the threshold levels.
Definition of voltage step size#
Input parameter Voltage Step Size defines the step between the voltages in dB of two consecutive measurements. To increase the speed of the measurement by using less measurements increase the voltage stepping to 6 dB.
Averaging of measurement#
In order improve the SNR it is possible to average the results over multiple measurements. For this purpose set the parameter Averaging [#] to 8, to decrease the noise by the theoretic number of 9 dB.
Open Loop Test#
TBM can be used for open loop testing. However, for open loop tests the automatic stepping versus frequency and voltage is not supported. Thus, open loop testing requires single step configuration.
Note
The object template TBM open loop can be used to setup up an open loop test. Note that this is not a TBM operation template!
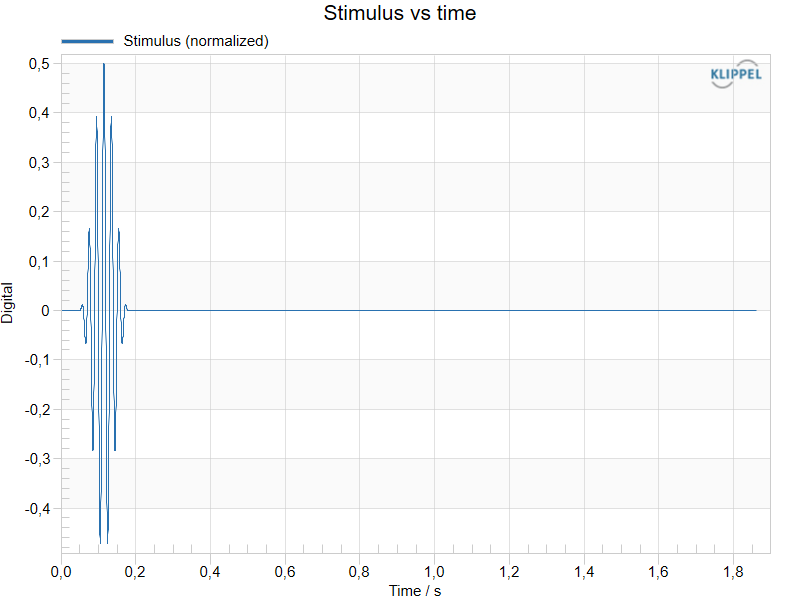
Since the default stimulus is quite short, the stimulus should be extended by zero padding to increase the likelihood to find the complete, asynchronous response of the open loop test within the recorded response.
The following settings must be set to enable Open Loop Testing:
In setup section Measurement Setup - Routing the Bluetooth Mode must be activated to allow a longer analysis time window.
In setup section Stimulus the Voltage Range Definition must be set to Single Voltage
To even further extend the stimulus, you may also activate room correction in setup section Measurement Setup - IN1/2: Either a complex room correction curve can be used or a dummy correction curve can be inserted in IN1/2 (Mic) Room Correction.
A dummy correction curve might be entered as follows:
Curve =[
1     1       0
96000 1       0];
This inserts a flat, zero-phase correction curve for the full audio band.
After setting up, a chart Stimulus Waveform will appear and show the stimulus after performing a measurement (even without a DUT).
A TFA operation can be used to playback the stimulus or export it as a wave file. It is included in the object template TBM open loop. Open the TFA Property page Input and press the Import button. The stimulus shall now be available in the TFA input chart. For playback use the built in player in TFA.
For storing as wav file select the TFA Property page Player, enter the wave file path as an absolute path and press the Export button. This will create a mono wave file with a sample rate of 48 kHz. This file can be played back on the device under test, e.g. in a looped playback mode.
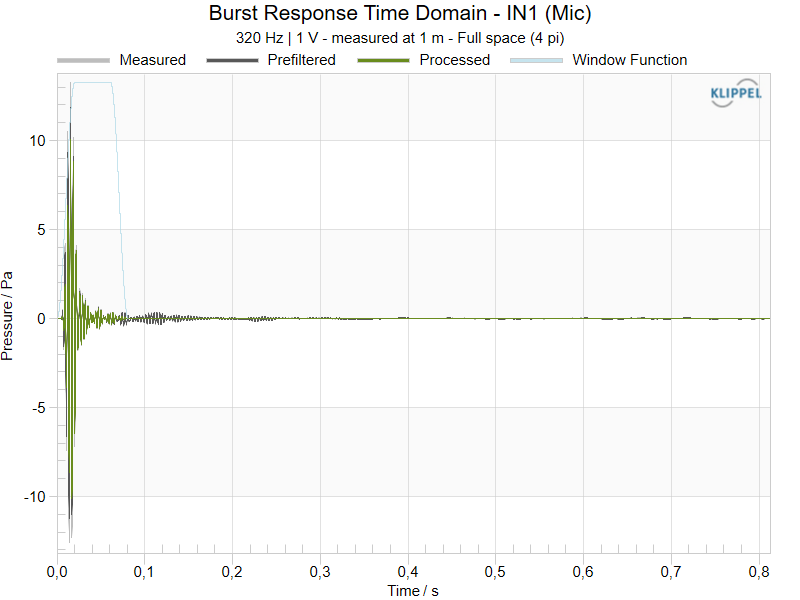
The TBM operation in the object now can also be used to record and analyze the tone burst response. Note, the arbitrary delay in the response chart which depends on the actual playback time but is not related to the DUT.
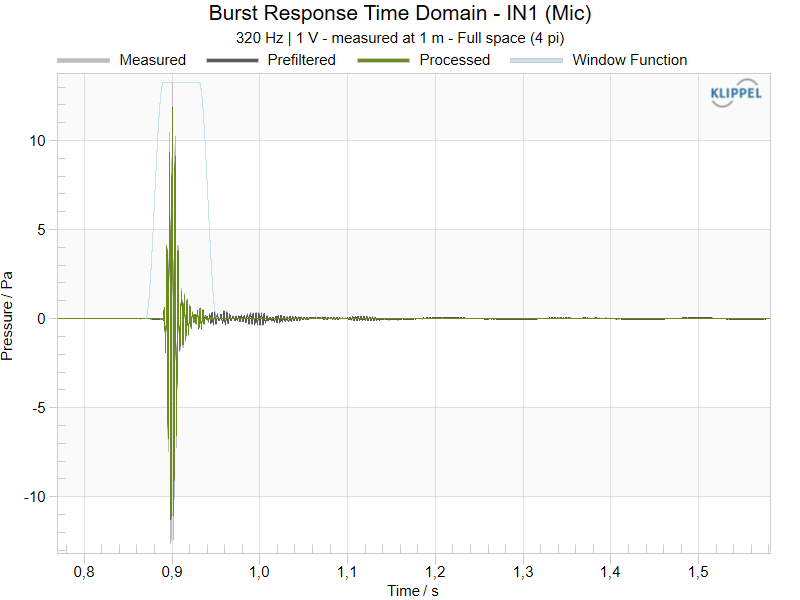
In case the response does not fit in the recording window, an error is generated to avoid wrong readings. In this case, simply repeat the measurement.
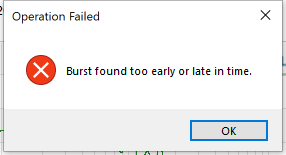
In this example the recorded burst response is outside the actual response time window. The processing consequently is invalid:
Noise Test#
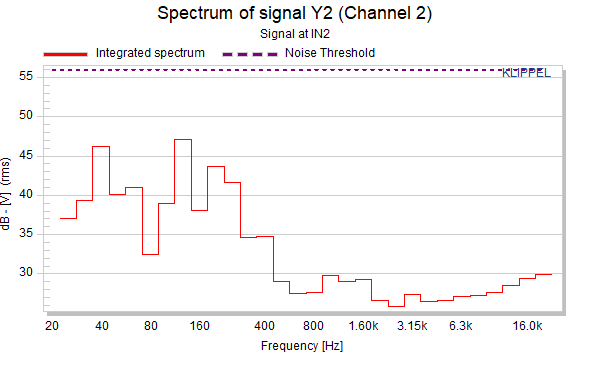
To do the specified noise measurement from the CTA-2010 standard. Create a new TRF operation and select the Template TRF Noise Test CTA2010 and run the operation. Check that the 1/3rd octave integrated noise signal does not surpass the threshold of 56dB (Corresponding to the 1/12th octave noise level below 50dB SPL of the CTA-2010 standard).
TBM Reference#
Overview#
The TBM Module provides an automatic tone burst measurement sequence based on Standard ANSI/CTA-2010-A and B and ANSI/CTA-2034.
The stimulus is a Hanning windowed tone burst signal, adjustable in length and frequency. The sound pressure is measured as a primary signal and optional a second state signal (sound pressure, displacement, current or voltage) is measured simultaneously. For a user defined set of frequencies, the measurement is automatically repeated with increased output level, until the distortion in the sound pressure has reached a user defined threshold.
The peak SPL is reported as the highest band limited peak sound pressure below the distortion threshold for each frequency. Frequency and time responses, distortion levels and voltage applied to DUT are presented as additional results.
Principle#
The TBM module is designed to run band limited burst measurements versus input voltage and frequency. The results are evaluated in frequency domain, to measure the generated distortion. A threshold curve is applied to the 1/12th octave band smoothed spectrum, to define a maximum permissible distortion generation.
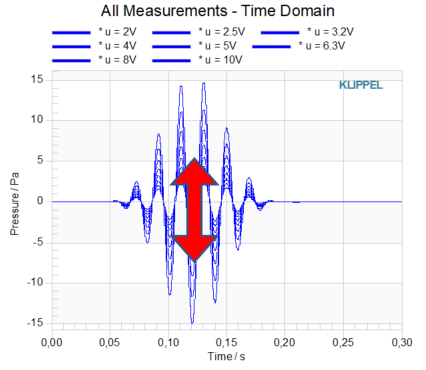
For each frequency, the voltage is increased until the threshold curve is reached. The highest voltage not reaching the threshold curve is used to calculate the peak level of this state signal (Peak SPL in CTA2010). In parallel it is possible to monitor a second state signal, to investigate the displacement or current state signal.
Post Processing#
The following diagram shows the post processing applied in the TBM for every measurement. The different blocks are described in the next sections:
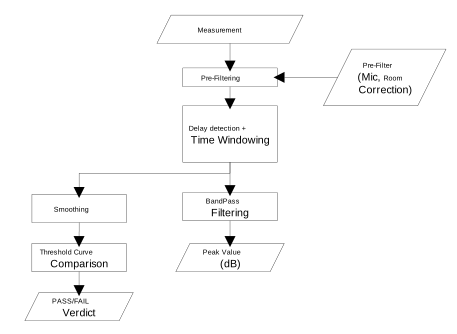
Pre-Filtering, Delay Detection and Time Windowing#
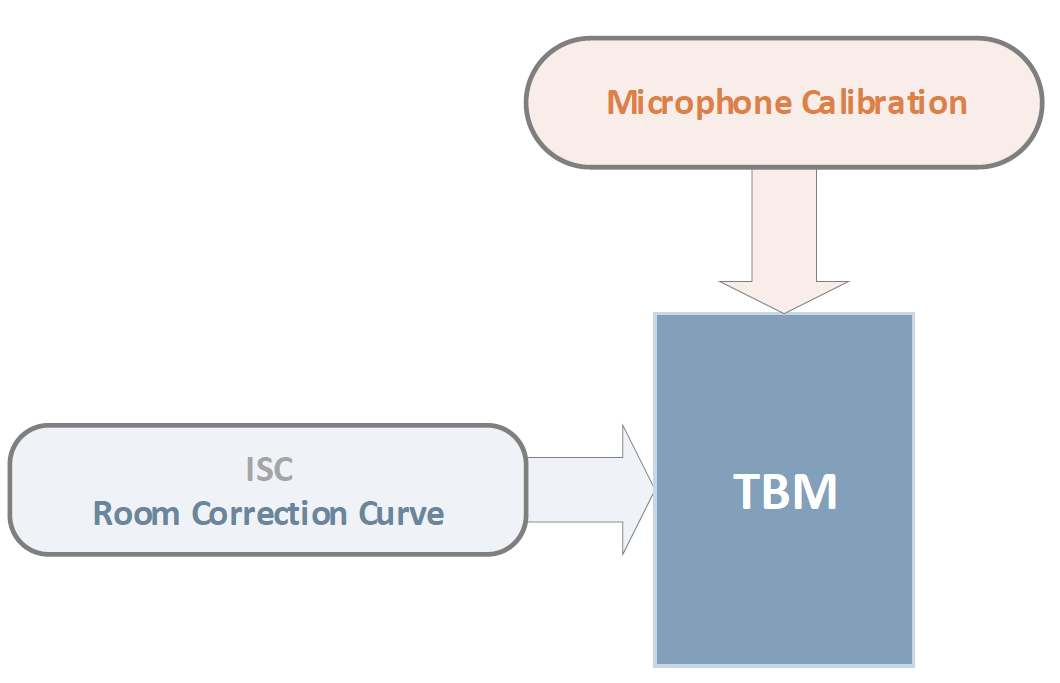
If the room and/or the microphone correction curves are available, they are applied to the measured signal in a first pre-filtering stage.
The normalized room frequency response or normalized microphones frequency response, as it is typically provided by the microphone manufacturer or calibration laboratory, could be used as a correction curve. The measured input spectrum will be divided by the microphone correction curve to compensate for its frequency response. Thus, the correction curve is subtracted from the measured response curve in dB.
The correction curve may be specified
as magnitude curve versus frequency in dB or
as magnitude (in dB) and phase (in degree) curve versus frequency.
it must be normalized at the frequency the sensitivity was specified (typically 250 or 1000 Hz).
Next, the measured burst is windowed using a Tukey window whose length is twice the length of the burst stimulus itself. Since the length of the burst stimulus depends on the burst frequency, the length of the Tukey window will be different for every stimulus frequency.
In the result window Y1(t) Time Signal are shown all the signals in time domain, including the measured and prefiltered signals and the Tukey window.
Once the measured signal is pre-filtered and windowed, two different processes are applied in parallel:
Band-pass filtering + peak value calculation
Smoothing + threshold
Band-pass filtering and peak value calculation#
According to the ANSI/CTA 2010-B standard, the peak SPL value is the highest peak sound pressure within 1/3 octave of the tone-burst stimulus fundamental frequency range. To reach this peak value, the windowed signal is filtered through a band pass filter with the following characteristics:
Filter Type: Butterworth, zero phase
Filter order 16th
Filter Bandwidth: 6/5 octave
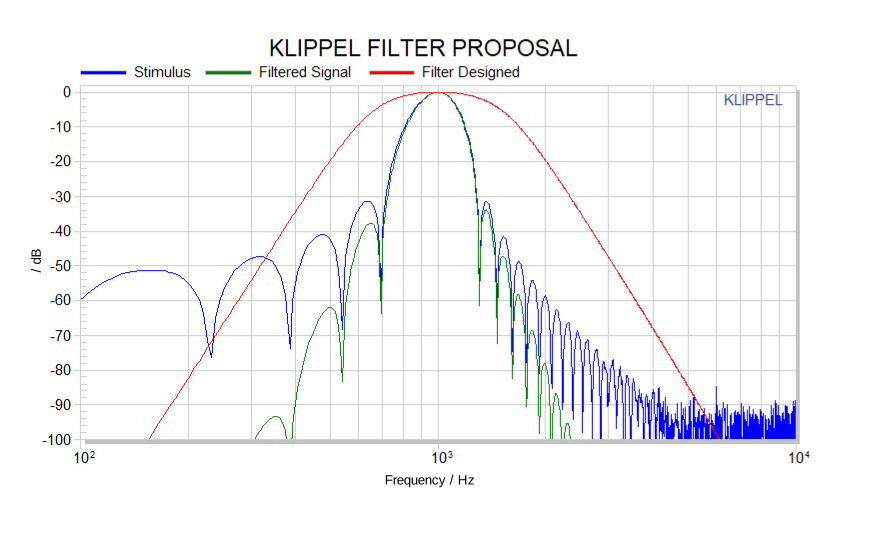
The curve “processed” displayed in the result window Y1(t) Time Signal corresponds to the filtered signal.
Smoothing and threshold#
The windowed signal is smoothed in the frequency domain using a factor of 1/12 octave according to ANSI/CTA 2010-A and B standards. This smoothed curve is then compared to the threshold defined in the standards for the different fundamental frequencies. If the threshold is reached at any point, the measurement at this frequency is finished and the peak value of the last passed measurement is considered the valid max SPL.
Property Page#
Measurement Setup – Routing#
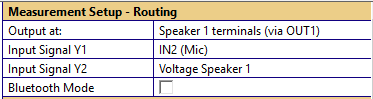
- Output at:
The Parameter specifies where the selected voltage is applied. It can be sent for active devices to OUT1 or OUT2. For passive speaker it can be send to Speaker 1 terminals or Speaker 2 terminals via both output channels OUT1 or OUT2. Default value is Speaker 1 terminals (via OUT1). Possible values:
OUT 1
OUT 2
Speaker 1 terminals (via OUT1)
Speaker 1 terminals (via OUT2)
Speaker 2 terminals (via OUT1)
Speaker 2 terminals (via OUT2)
- Input Signal Y1:
State signal which will be analyzed, und whose results will be compared with threshold. It can be measured Sound pressure, Voltage, Current or Displacement. Default value is IN1 (Mic). Possible values:
IN1
IN2
Voltage Speaker 1
Voltage Speaker 2
Current Speaker 1
Current Speaker 2
Displacement
- Input Signal Y2:
State signal which will be measured simultaneously with Input Signal Y1. It can be measured sound pressure, voltage, current, displacement or it’s turned off. Default value is Off. Possible values:
Off
IN1
IN2
Voltage Speaker 1
Voltage Speaker 2
Current Speaker 1
Current Speaker 2
Displacement
- Bluetooth Mode:
Apply a longer measurement time to compensate the delay produced by wireless devices.
Measurement Setup - IN1 (Mic)#
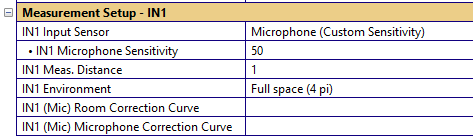
- IN1 Input Sensor
Select the input sensor used in the measurement. Possible values:
Managed by dBLab
Microphone (Custom Sensitivity)
For more details, please refer to Hardware Manual.
- IN1 Microphone Sensitivity
- in mV / PaRange: > 0
Microphone Sensitivity only available if IN1 Input Sensor is Microphone (Custom Sensitivity).
- IN1 Meas. Distance
- in mRange: > 0
Distance between microphone IN1 and DUT. Default value is 1m.
- IN1 Environment
Define the measurement environment. Possible values:
Full space (4 pi) (Default)
Half space (2 pi)
- IN1 (Mic) Room Correction Curve
- [Frequency, Magnitude, Phase (opt.)] in [Hz, dB, °]
Correction filter to compensate the room influence for In-Situ measurements, phase is optional.
- IN1 (Mic) Microphone Correction Curve
- [Freq , Magnitude] in [Hz, dB]
Microphone calibration curve.
Measurement Setup - IN2 (Mic)#
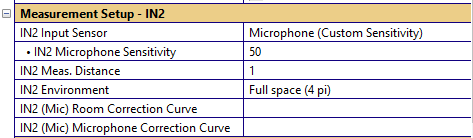
- IN2 Input Sensor
Select the input sensor used in the measurement. Possible values:
Managed by dBLab
Microphone (Custom Sensitivity)
For more details, please refer to Hardware Manual.
- IN2 Microphone Sensitivity
- in mV / PaRange: > 0
Microphone Sensitivity defined in mV / Pa, only available if IN2 Input Sensor is Microphone (Custom Sensitivity).
- IN2 Meas. Distance
- in mRange: > 0
Distance between microphone IN2 and DUT. Default value is 1m.
- IN2 Environment
Define the measurement environment. Possible values:
Full space (4 pi) (Default)
Half space (2 pi)
- IN2 (Mic) Room Correction Curve
- [Freq , Magnitude, Phase (opt.)] in [Hz, dB, °]
Correction filter to compensate the room influence for In-Situ measurements, phase is optional.
- IN2 (Mic) Microphone Correction Curve
- [Freq , Magnitude] in [Hz, dB]
Microphone calibration curve.
Stimulus#
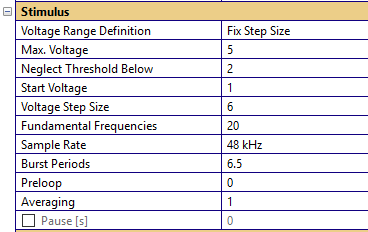
- Voltage Range Definition
Measurement voltages can be defined according three different modes:
Fix Step Size: voltage raises according a fix step size
Single Voltage: a single voltage is measured per frequency
User Defined: User defines the voltages to be measured at each frequency in a matrix
- Max. Voltage
- \(u_{max}\) in VRange: > Start Voltage
Highest allowed voltage, default value is 5 V. If the threshold is reached before, the measurement stops and this voltage is not measured. After a measurement is finished, this parameter can be increased without losing results to continue the burst test for higher voltages. This parameter is only available if Voltage Range Definition is Fix Step Size.
- Neglect threshold below
- in VRange: > 0
Measuring with a low input voltage, the limit check of the TBM can fail because of noise. If the input voltage is below this level, the burst test will be continued even the limit check has failed. Choose a save value, because this voltage will be applied to the device. Default value is 2 V. This parameter is only available if Voltage Range Definition is Fix Step Size.
- Start Voltage
- \(u_{start}\) in VRange: \(0 < u_{start} \leq u_{max}\)
Lowest voltage, default value is 1 V. The measurement starts at this value. This parameter is only available if Voltage Range Definition is Fix Step Size.
- Voltage Step Size
- in dBRange: > 0
Step size of the measurements’ voltages, default value is 1 dB. This parameter is only available if Voltage Range Definition is Fix Step Size.
- Voltage
- in VRange: > 0
Single Voltage measured per frequency. This parameter is only available if Voltage Range Definition is Fix Step Size.
- Voltage Profile
- [Freq, u(1), u(2) …] in [Hz, V, V …]
Voltages to be measured at each frequency. The parameter is defined as a matrix with the format [frequency (Hz), u(1), u(2) …]. Frequencies are defined in ascending order, while Voltage columns can be filled with ‘nan’ if different number of voltages are defined per frequency:
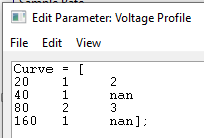
This parameter is only available if Voltage Range Definition is User Defined.
- Fundamental Frequencies
- \(f\) in HzRange: \(0 < f < 0.25 * f_{sample}\)
Vector of frequencies to be analyzed.
Note
Note that max. frequency allowed is 0.25 * sampling rate to assure at least the 2nd harmonic below Nyquist frequency.
- Sample Rate
- \(f_{sample}\) in Hz
Sample rate used for measurements. Possible values are 48 kHz (default) and 96 kHz.
- Burst periods
- Range: \(\geq\) 1.5
Number of Periods of fundamental tone in burst (stimulus signal). Minimum value is 1.5 and default value is 6.5 periods.
- Preloop
- Range: \(\geq\) 0
Amount of signal loops to be run before the measurement is recorded. Range of values is defined between 0 and 128. Default value is 0.
- Averaging
Number of measurements results is averaged over. Possible values are:
1 (default)
2
4
8
16
32
64
- Pause
- in s
Between the measurements, the process can be paused using this parameter.
Processing#
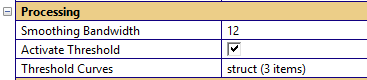
- Smoothing bandwidth
- Range: 1 \(\leq\) Smoothing \(\leq\) 99
Smoothing bandwidth for results in frequency domain. Range of values is defined between 1 and 99. Default value is 12 (BW = 1/12 octave).
- Activate Threshold
This parameter activates the use of the threshold in the measurements. If it is deactivated, the threshold monitoring is disabled.
- Threshold curves
Threshold curves: Threshold to be compared with the frequency response of the measurements. Since the CTA Standards defined different thresholds depending on the fundamental frequency, a total of 5 threshold sets can be created:
freqLimits: 2x1 vector which defines the absolute frequency limits in between all thresholds are applied: [fLOW fHIGH]
freq1 – freq5: Define range of fundamental frequencies the threshold thres1 – thres5 is applied. They are defined as a 2x1 vector: [fLOW fHIGH] where fLOW ≤ fRANGE < fHIGH.
thres1 – thres5: Relative frequencies and amplitudes of the threshold curve saved in a matrix [3xN] First and second columns are minimum and maximum relative frequency to apply threshold step. Third column is value of threshold in dB referenced to the peak value of the fundamental frequency.
In the following example we can see the first 2 threshold sets defined by Standard ANSI/CTA-2010-B:
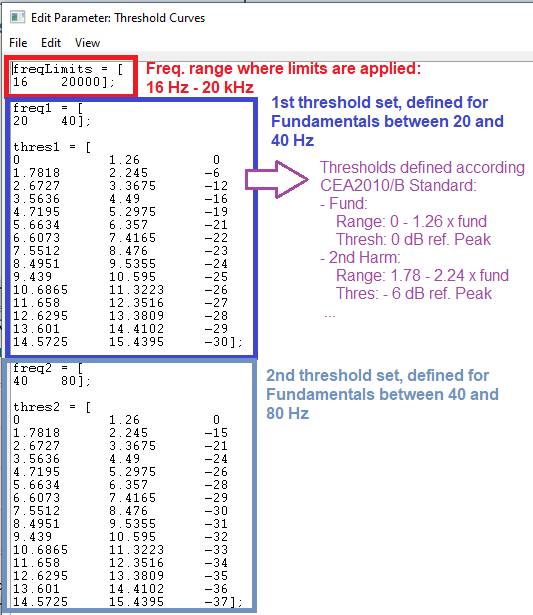
Default value is the threshold defined by Standard ANSI/CTA-2010-B. At least, the fields freqLimits, freq1 and thres1 must be defined. For creating new threshold sets, both matrix freqX and thresX have to be defined.
Note
Please note that all fundamental frequencies must be included in the fields: freq1 – freq5.
Display#
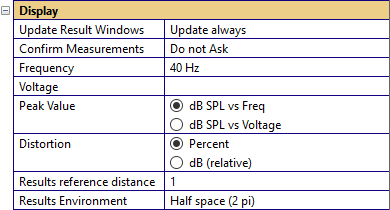
- Update Result Windows
To monitor the measurement process the result windows can be updated. The Parameter defines how often the windows are recalculated. The curves can be updated after each burst, only after failed measurements or once at the end.
- Confirm Measurements
To get more process control over burst measurement the parameter confirm measurements can activate more user interaction. If it desired the TBM module will ask after every measurement or after all failed measurement how to continue. Thus the user has full control to continue with the next burst or repeat the last measurement.
- Frequency
Tone burst measurement frequency of which the State Signal Y1 and Y2 results are shown.
- Voltage
Voltage value of measurement to be plotted in windows Spectrum and Time Signal of State Signals Y1 and Y2. Possible values are the voltages measured at Frequency. Default value is the voltage of the last measurement.
- Peak Value
Defines plot style of the following output windows of state signal Y1 and Y2: Peak Value, Compression, Total Burst Distortion, 2nd Order Burst Distortion and 3rd Order Burst Distortion. It is possible to visualize the curve over Frequency (default) or Voltage.
- Distortion
Defines unit used in charts Total Burst Distortion, 2nd Order Burst Distortion and 3rd Order Burst Distortion of State Signals Y1 and Y2. Possible values are Percentage (default) and dB.
- Results reference distance
- in mRange: > 0
Reference distance microphone for DUT for results. The peak values in the tables and the graphs are scaled to this distance using the 1 by r law. Default value is 1 m.
- Results Environment
The peak can be scaled to full-space or a half-space environment.
Advanced#
- Show Advanced Settings
Checkbox to show and hide the advanced settings.
Result Windows#
Y1(f) and Y2(f) Spectrum#
The results window shows the spectrum of the burst signal and the threshold defined by the Standard as well. If the measurement is above the threshold (red curve), the last passed measured (green curve) is also shown.
Y1(t) and Y2(t) Time Signal#
Tukey window, recorded signal and gated and filtered signal of the last passed measurement at the selected frequency are shown in time domain. The result values collected in the Table + Results window are calculated from the processed signal, while the measurement spectrums are obtained from the prefiltered signal. Please refer to the chapter Post Processing for detailed information.
If the input signal is IN (Microphone), the referenced distance DUT – Mic and the measurement environment are shown in the chart title. Time axis (X-Axis) is defined in seconds, while Y-Axis is defined as the linear value of the state signal unit. Available units are Voltage (voltage), Ampere (current), Pascal (pressure) and millimeters (distance).
Y1 and Y2 Peak Value#
Peak value of measurements versus voltage and frequency in dB is shown, allowing to the user to detect the saturation of DUT.
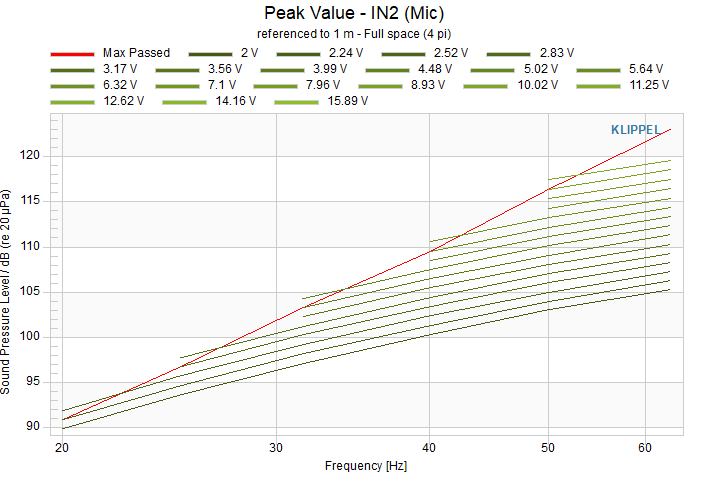
If the state signal is IN (Microphone), the referenced distance DUT – Mic and the measurement environment are shown in the chart title. Y-Axis is defined as dB referenced to 1V if state signal is Voltage, 1 Ampere if it is current, 20uPa if pressure and 1 millimeter if it is distance. If Peak Value plot is dB SPL vs Voltage, X-Axis is frequency defined in Hz in a logarithmic scale, and the curve Maximal Value which indicates the maximal passed measurement for each frequency is defined.
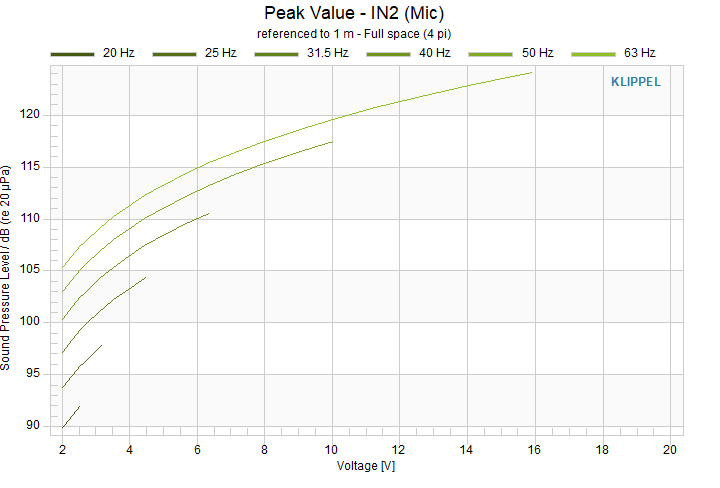
If Peak Value plot is dB SPL vs Voltage the X-axis is defined as Voltage in a linear scale and each curve represents one frequency measured. The Maximal Value curve is not plotted in this configuration because it loses its meaning.
Y1 and Y2 Compression#
Compression calculated in each measurement related to the lowest voltage measurement of every frequency normalized to the gain. This nicely visualizes thermal and physical compression effects
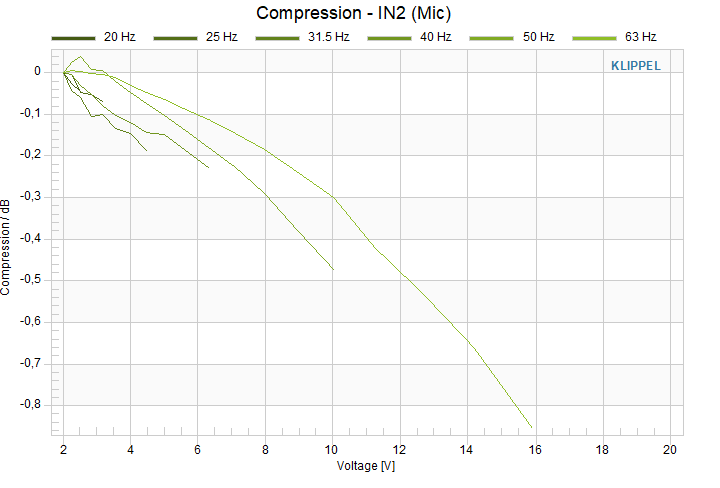
If Peak Value plot is dB SPL vs Voltage X-Axis is frequency defined in Hz in a logarithmic scale. The lowest voltage curve has a value of 0dB in all its points because it is used as reference level.
Y1 and Y2 Burst Distortion#
Burst distortion describes the distortion signal at multiples of the fundamental burst frequency relative to the fundamental burst signal. The fundamental burst signal and the distortion at a multiple of the fundamental is defined as RMS signal (sum of the spectrum from \(\frac{1}{2}f_{1}\) below to \(\frac{1}{2}f_{1}\) above the center frequency), calculated from the spectrum Y(f) as following:
Second Order Burst Distortion:
Third Order Burst Distortion:
Total Burst Distortion:
Total, second order and third order burst distortion of all frequencies are showed in individual windows whose X-Axis is defined as Voltage in a linear scale. Y-Axis is visualized in percent or dB according to parameter as defined in the parameter Distortion.
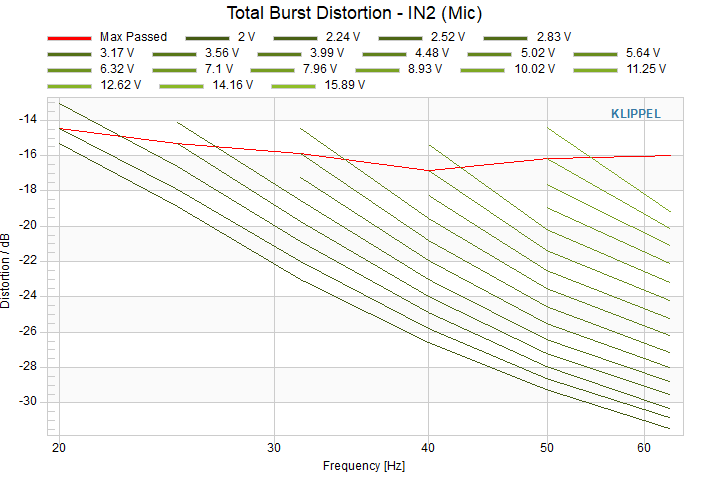
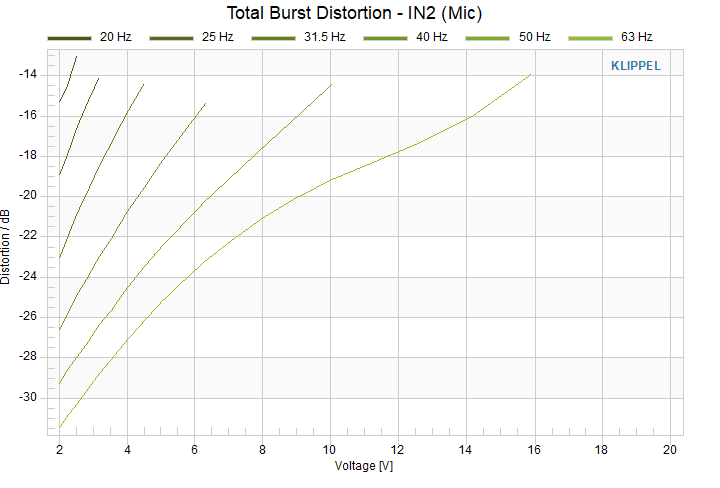
Max Input Voltage#
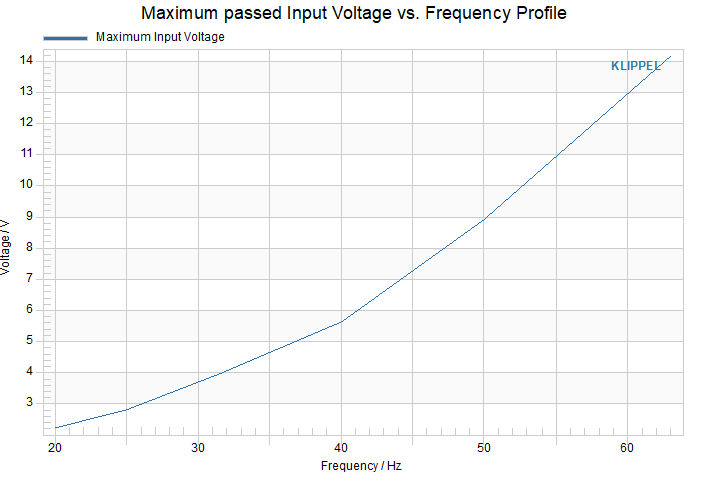
Voltage profile of passed max SPL measurements in frequency domain is shown in this chart.
Correction Curve#
For measurements in small anechoic chambers or non-anechoic rooms it is required to use correction filter that compensates the room influence. The magnitude of this room correction filter as well as the microphone correction curve are shown in the window.
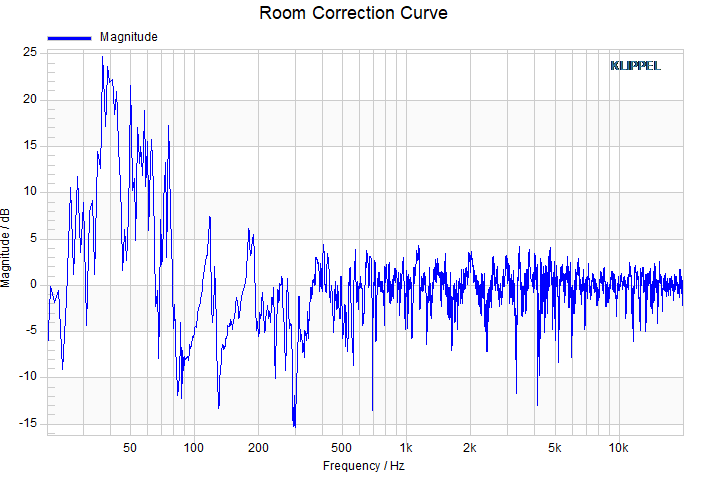
Table Results + Settings#
General results of the measurements and settings are summarized in this window.
The data collection table shows the peak value measured in each frequency. Moreover the standard results are calculated:
ANSI/CTA-2010-A: Max SPL Rating ,Ultra-low bass and low bass SPL
ANSI/CTA-2010-B: Maximum Broadband Peak SPL
ANSI/CTA-2034: Maximum Broadband Peak SPL
The measurement conditions table collects the position and environment of the microphones, the level difference in dB related to the reference condition.
The settings of the measurements are summarized in the last table.
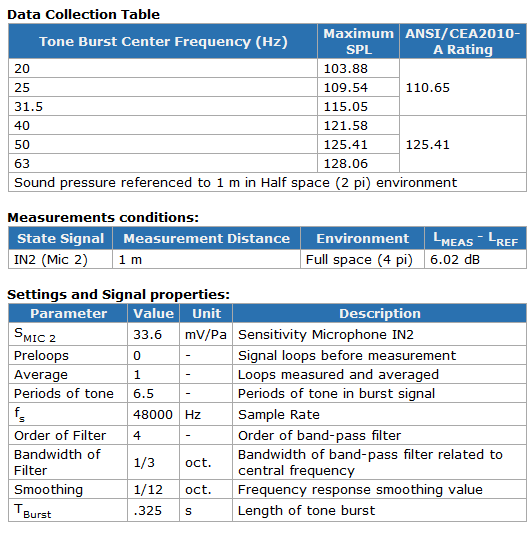
Table Peak SPL#
This window summarizes the entire peak SPL values of all measurements. The color visualizes the verdict of the limit check.
Passed measurements are green
Failed measurements are red
Failed measurements below neglected threshold are yellow
Measurement Monitor#
The measurement Monitor gives basic information about the last burst measurement if the threshold is activated. It shows the frequency, the voltage and the result of the threshold check. In following example, the 3rd order distortion exceeds the limit so the frequency band of from 126 Hz – 189 Hz failed.
Supported Modules for Im/Export#
Malfunction and Troubleshooting#
Error Messages#
Input Parameter Error#
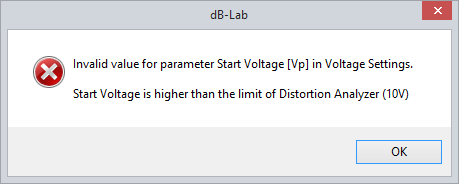
If the operation is run when there are errors in the input parameter page, the error message of the parameter will be shown in a window and the operation will be aborted.
Measurement aborted by user#
A warning-box alerting about high voltages at speaker terminals will appear if output at is OUT1 or OUT2.
If the user does not click the “Ok” button, this error message will appear.
Warning Messages#
f = xx Hz: no passed measurement#
This warning is activated for all the frequencies whose measurements are above threshold. A solution for this problem could be to combine a lower U_start value with a safe value of U_save.
f = xx Hz: peak SPL value does not correspond to highest V measurement#
Due to the saturation of the amplifier or the microphone at higher voltages, it is possible that the maximal peak SPL obtained does not correspond to the highest voltage measurement.
f = xx Hz: Threshold is not reached, increase Voltage if it is possible#
This warning is showed for all frequencies whose measurements are below the threshold. The solution for this warning is to work with a higher U_stop value.
SPL value of 20Hz is calculated from the value of 25Hz - 18dB#
If CTA2010A Configuration is activated, the Standard includes the possibility to calculate the peak SPL of 20Hz through the SPL peak of 25 Hz. This exception only is defined for 20 Hz in the A version of the Standard.
CTA-2010-A rating cannot be calculated for the ultra-low band#
If it is not possible to calculate the SPL peak of one frequency, the result of the Standard ANSI/CTA-2010-A must be defined as “N/A”. This warning message will appear if the failed frequency belongs to the first octave of frequencies (20 Hz, 25 Hz, 31.5 Hz).
CTA-2010-A rating cannot be calculated for the low band#
If it is not possible to calculate the SPL peak of one frequency, the result of the Standard ANSI/CTA-2010-A must be defined as “N/A”. This warning message will appear if the failed frequency belongs to the second octave of frequencies (40 Hz, 50 Hz, 63 Hz).
