dB extract – Data Extraction#
dB extract - Tutorial#
Introduction#
Overview#
db extract is a utility of the KLIPPEL Analyzer System that allows exporting selected R&D measurement data and QC test results to an open formats, e.g. for post processing in 3rd party software.
R&D measurement data may be extracted as well as log data from QC. Please make sure the logging is active. It is recommended to use the full results and the summary logging.
Installation#
db extract v3 requires KLIPPEL dB-Lab v210 coming from a QC or R&D installation. It is not necessary to install it on a measurement PC. Since data is only read from the result databases, no additional licenses are needed.
Limitations#
db extract can be used to extract measurement data from KLIPPEL R&D and QC modules.
Supported operations:
All KLIPPEL measurement operations except LSI 1.0 and SIM 1.0
Supported data:
2D curve data from all supported KLIPPEL operations
Single value data from all supported KLIPPEL operations
How to extract data#
Basic Steps#
These are the very basic steps necessary to perform any extraction:
Open db extract, the tab SELECT DATABASE FILES is shown. Load a pre-defined settings file () or create a new configuration, which can be saved for later use.
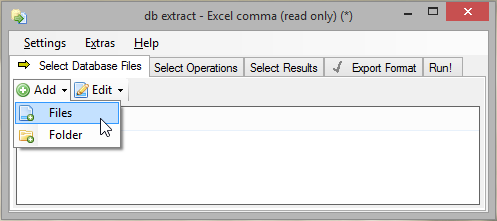
Add the database(s) to extract, either by selecting the databases file-wise or by selecting a folder.
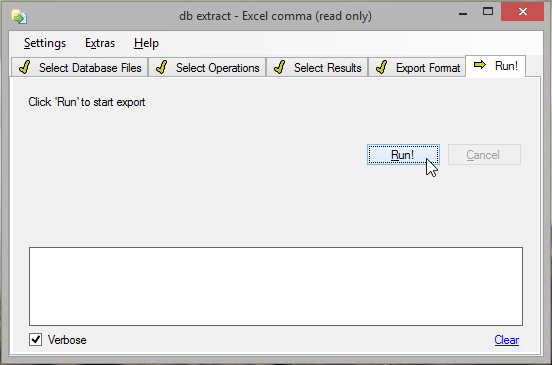
For a first execution, jump to the RUN! tab and hit the Run! button.
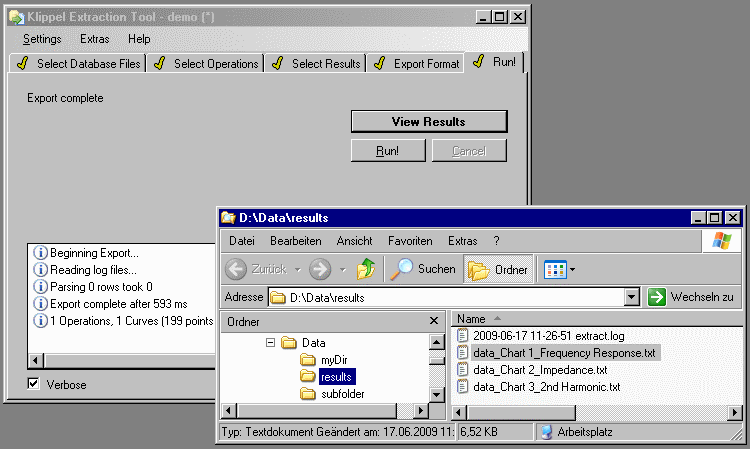
After the extraction is complete, click on View Results. Windows Explorer \(©\) is opened and shows the exported data. Import the extracted text files into the post processing software of your choice.
Standard Settings Files#
db extract automatically installs a set of settings files for standard applications and for special data processing. These standard settings can be selected from the Settings menu, as shown below.
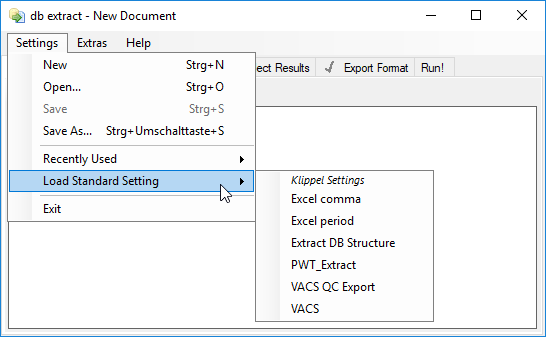
The folder that contains the standard settings files can be accessed by selecting Standard Settings Folder from the Extras menu.
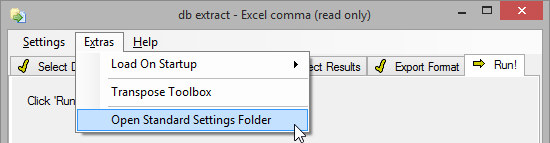
You can add your own standard settings or modify the installed ones.
Note
If a pre-defined settings file does not meet your requirements exactly, it still might be a good starting point. Simply adjust the settings and save it.
Applications#
Export to Excel ©#
There are two settings files to perform an export to Excel \(©\). Both generate Microsoft Excel \(©\) compatible text files - the only difference is the decimal separator setting, which is comma or period. Depending on the language settings, some Excel \(©\) installations require a comma for the decimal separator.
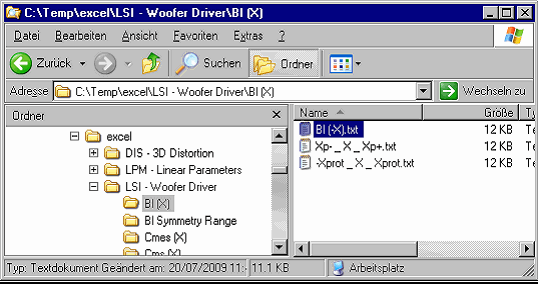
Extracting databases with either of these settings files will generate a folder for each measurement operation type (e.g.: DIS, LPM, LSI etc.). These folders will contain subfolders for every chart found in the operations of that type, which contains a text file for each curve name.
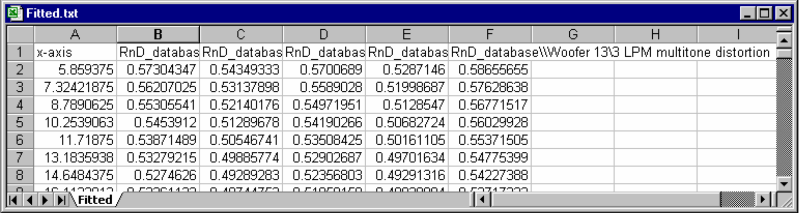
If multiple databases are selected for extraction, the text files contain the measured data of all equally named curves in equally named charts (one column per curve).
Note
This setting can be used to extract curves only. (Character strings and scalar values are not extracted.)
The chapter Tutorial: Export to Excel© and KLIPPEL Application Note No.43 contains more detailed examples on how to export and process measured data in Excel \(©\).
VACS Export#
VACS stands for Visualizing Acoustics, a software package developed to simplify visualization, processing and organization of acoustical data, notably of transfer-functions. For more information, please refer to the website.
Load the VACS.kxdbsettings file and perform the steps described in How to extract data.
Start VACS drag the files into a new chart.
Note
For detailed information about the VACS export, please refer to KLIPPEL Application Note No.43.
Extract Database Structure#
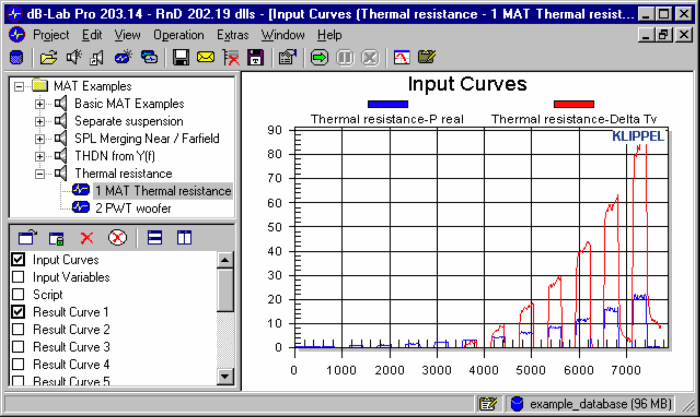
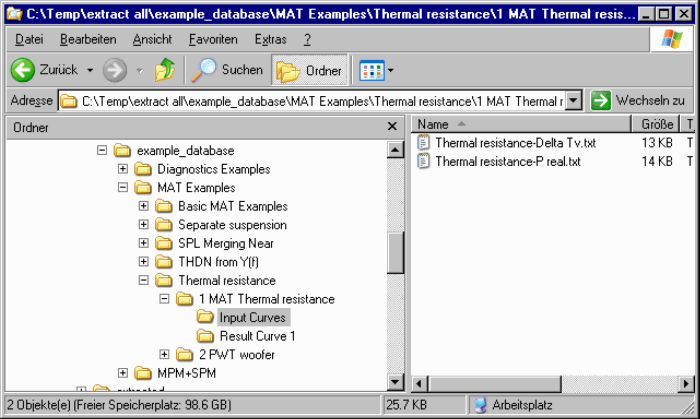
The Extract DB Structure.kxdbsettings settings file is set-up to reproduce the database structure as file system structure. Each curve is stored in an individual text file. The location of the text files corresponds to the operation’s location. Additionally, a subfolder is created for every chart.
Note
This setting can be used to extract curves only. (Character strings and scalar values are not extracted.)
Optimizing Performance#
There are several ways to optimize the time consumption of db extract:
- Select only the desired curves for extraction
Do not select curves you do not need as this takes additional extraction time. Thus the option Extract all curves on tab Select Results should be avoided, if possible.
- Avoid axis interpolation, if possible
Some standard settings use the Interpolated option for X Axis Export by default. In most cases this option can be set to SharedXAxis.
Tutorial: Export to Excel©#
Example: Visualizing the SPL Frequency Response of a production batch#
This tutorial is a guided example to extract all SPL Frequency Response curves of a selection of stored database files during the production process.
This example is based on the KLIPPEL QC-system.
The main idea is to keep online and offline processing separated: The QC measurement, that produces the databases to extract, is online. The selection and extraction of results, as well as the post processing, are offline. The result of this example is an Excel© sheet with the extracted data.
Starting db extract#
Double click on the db extract icon

on the desktop. You may also select the Start Menu entry.
The program is opened:
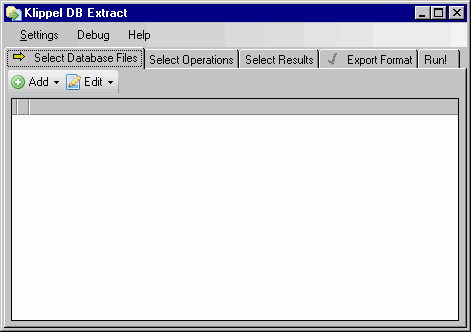
The software is organized in several tabs. Filling each window will automatically guide you through the complete extraction process. The tabs are labeled as follows:
SELECT DATABASE FILES#
All displayed measurement results (curves, such as THD, Frequency Response) of one particular test are stored in a binary database. The single value results (such as \(R_{\text{e}}\) , \(Q_{\text{TS}}\)) of a complete batch are stored in one single file, the Summary-Log File.
Both export options may be individually enabled / disabled in the measurement Setup of the QC test. For more information check the QC User Manual section Storing Results.
To select database files click on the Add button
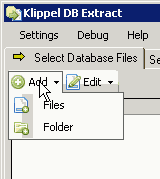
Select Files or Folder and navigate to the folder, were you have stored the databases during production testing.
The location of the LOG folder can be found via QC Start:
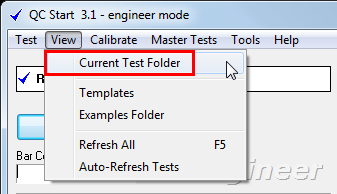
Using the standard Windows selection functions (e.g. Control + mouse, Shift + mouse) you may select a certain time interval or specific database files.
If you select a complete folder and enable the recursive option, all databases in this folder and all subfolders are selected.

You may add multiple folders and files from different locations according to your needs.
Once selected, the database files and folders are listed in the main window.
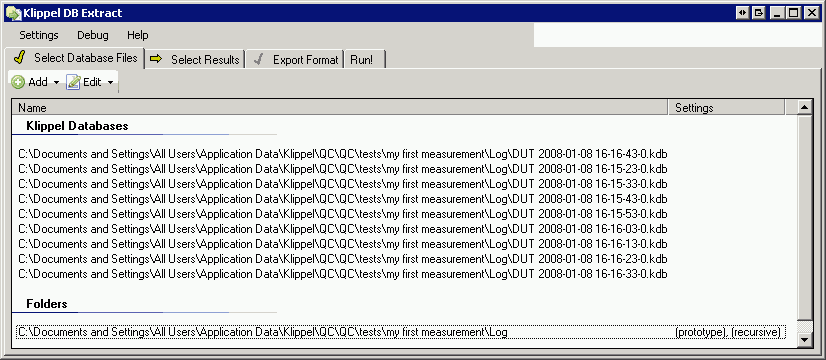
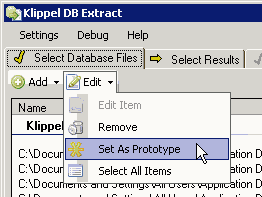
One entry is always marked as prototype, to select a database for result selection (see next step).
If all database files have identical results, it makes no difference, which database is the prototype. If not, the user may select a certain database or folder using the Edit button.
Click on the next tab SELECT OPERATIONS.
SELECT OPERATIONS#
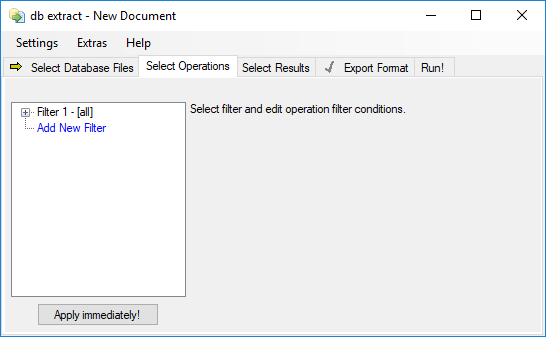
If you have QC log databases you can leave the filter settings untouched. If you have mixed databases (with operations than QC operations), this would be the place to define a filter to pick only QC operations for extraction.
SELECT RESULTS#
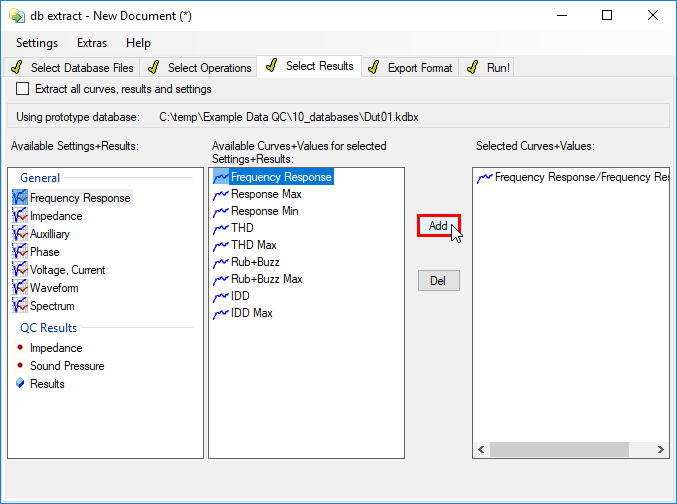
At the top of the window, the prototype database is listed. This database is used to select the curves for extracting.
Note
Due to technical limitations, it is not possible to extract multiple Curves, which have the same name within one Chart!
In the Selected Curves+Values list now all required curves are listed. Note, that multiple results from different result windows may be extracted. Just repeat the curve selection.
EXPORT FORMAT#
The next tab EXPORT FORMAT defines the output format. In this example a plain text format (txt) will be used to interface with Excel©.
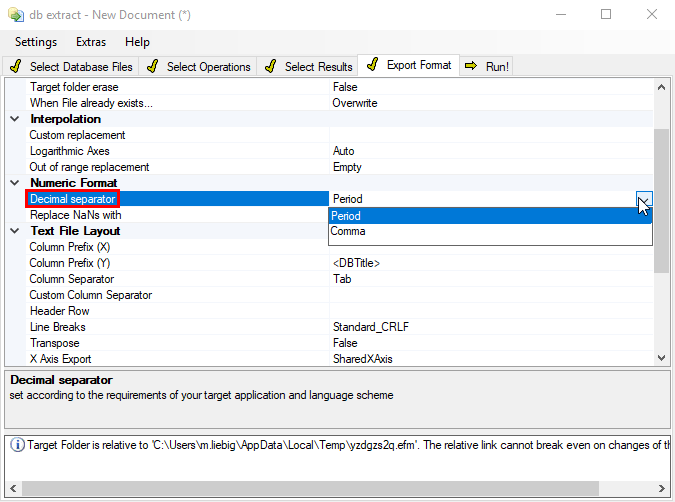
You may change the output file name, the number of output files (one per criteria to extract or combined), the format and sorting in the output file. See section dB extract - Reference for details.
In this example it is only required to adjust the decimal separator according to the Excel© requirements.
Note
Excel© handles the decimal separator differently according to the country setting on the computer. For English systems, the period must be used as decimal separator whereas for other countries (e.g. Germany) the comma must be used.
Now is a good time to save the settings for later use:
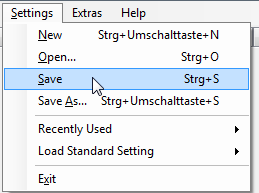
Specify a filename and folder. You may load that file later to simplify future setup process.
RUN!#
To start the actual extraction process, click on the Run! button (in tab of the same title).
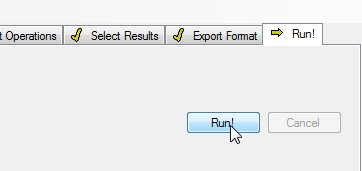
Note
Extracting data from many database files may be time consuming. It is recommended to test the extraction result before with a limited number of files. Thus compliance with the target application and syntax can be ensured.
A summary of the extraction process, as well as possible error messages, is displayed. This log output is useful for debugging purpose. Always include that log information to service requests from KLIPPEL in case of malfunction.
After the extraction process, click View Results to open Windows Explorer© and to view the extraction output. This is especially useful when using the default setting (when the target folder is left blank). In this case a temporary folder is used and sometimes difficult to find.
Analysis in Excel ©#
Right-click on the generated output file, select Open With and select Microsoft Excel \(©\).
Note
You may also use other spreadsheet software with the extracted files.
If there is no Excel item in the list, select Choose Program … and browse for Excel \(©\) on your system.
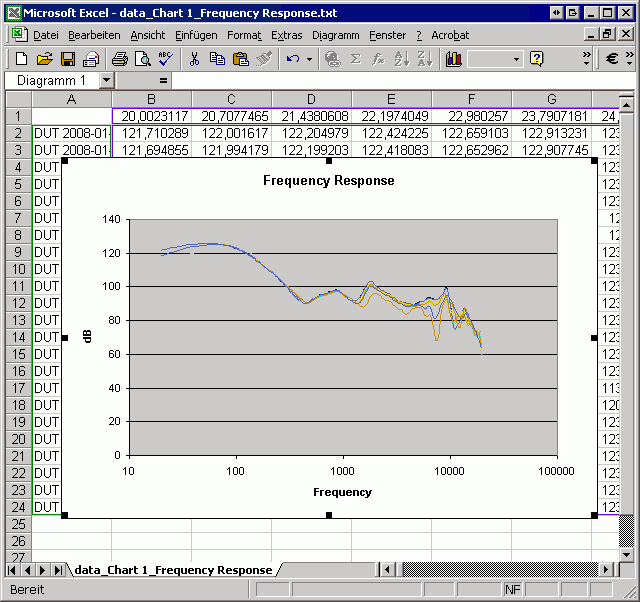
Excel \(©\) will be opened with the data:
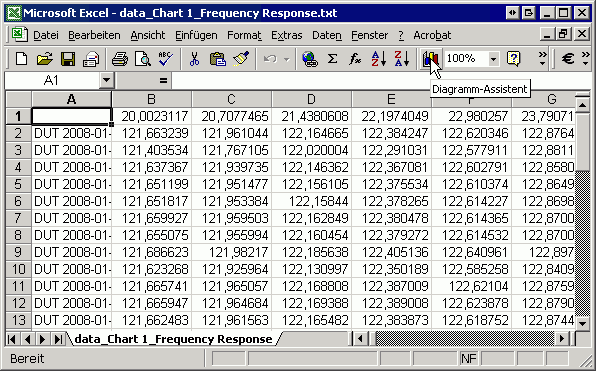
If you see the numbers in a strange format (like 20.123.562.543) you probably need to change the decimal separator (see above). Now you may apply all Excel \(©\) functions to implement your own post statistics.
Note
Older Excel \(©\) versions like that version used in this tutorial (Excel 2003 \(©\)) have limits for rows (64k) and columns (256).
Create Graph in Excel ©#
Click on the Diagram icon  like indicated on the screenshot above. Select the Diagram Type Point (XY)
  .
.
Select the Sub-Type Points with Lines and no data points

Enter a title and axis labels if required and press Finish.
The output should look like this (The \(x\)-axis is set to logarithmic and the legend was removed):
Please refer to the dB extract - Reference for all options of db extract.
Note
Note, that it is also possible to extract the single value results (like \(R_{\text{e}}\) , \(Q_{\text{ts}}\)) from one or multiple Summary Log file(s).
dB extract - Reference#
The db extract User Interface#
When you run db extract, you will see the following user interface:
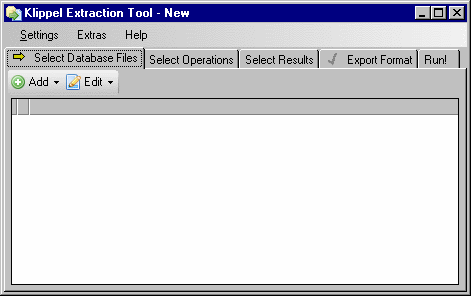
Configuration takes place in different steps. Each step is accessed through a tab near the top of
the window. A little arrow  indicates that the configuration in a tab is not yet completed.
The following chapters describe the individual steps.
indicates that the configuration in a tab is not yet completed.
The following chapters describe the individual steps.
Select Databases to process#
On the SELECT DATABASE tab, click Add Files to select the databases to process. Each time, you can select multiple files.
QC log files (Summary (...).log) can be added to the extraction list to include additional
information (like PASS/FAIL, or individual values) to the exported text files. Please note that
including QC results via Summary-Logs is deprecated and provided only for compatibility reasons. QC
results may be exported directly.
Note
In the Add Files dialog, you can select all files in a folder by clicking on one file, and then pressing Ctrl + A . Click OK to add the files to the list.
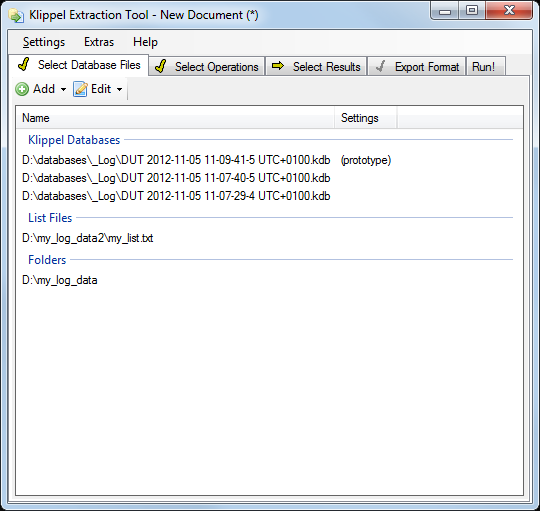
To remove one or more files from the list, select them and click Remove.
Note
Generally, you should only select results that were measured with exactly the same settings. Mixing data from different setups may lead to a misalignment of data when the \(x\)-axes are merged. But, with some limitations, you can also accumulate data from different measurements.
When you have selected at least one database file, the next step, SELECT OPERATIONS, becomes available.
Filter Operations#
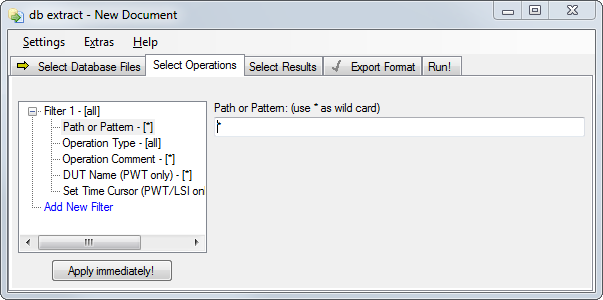
This tab page contains advanced options for R&D purposes mostly.
Using these filters it is possible to allow certain types of operations only. All other types will not be processed.
Note
The conditions of one filter are combined with a logical AND. Different filters are combined with a logical OR.
There are different types of filter conditions that can be applied.
Path / Pattern#
The Path Pattern condition can be used to specify a certain path in the database structure to select one or more operations. The later can be done by using wild cards *.
- Examples
- *
Using a wild card only means all operations are allowed
- myDriver\myOperation
Providing a complete path without wild cards means only that one defined operation will be processed (if it exists).
- myDriver\* Test01
All operations located in myDriver that end with Test01 are processed.
Note
The path pattern is case insensitive.
Operation Type#
Using these condition operations of certain measurement types (i.e. measured with a certain KLIPPEL module) can be selected. For example: It is possible to allow TRF and MAT operations while all other types are ignored in further process.
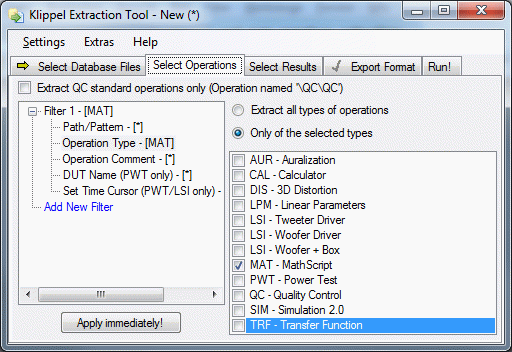
The list of operation types depends on the current installed (and registered) dB-Lab. db extract supports all operation types which are supported by dB-Lab.
Operation Comment#
It is possible to add comments to measurement operations in KLIPPEL dB‑Lab.
As shown in the example image below.
Example Image#
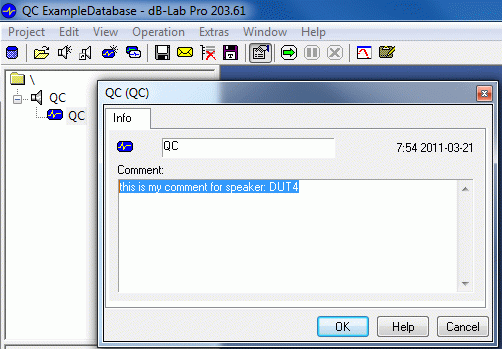
In db extract Operations can be filtered by this comment.
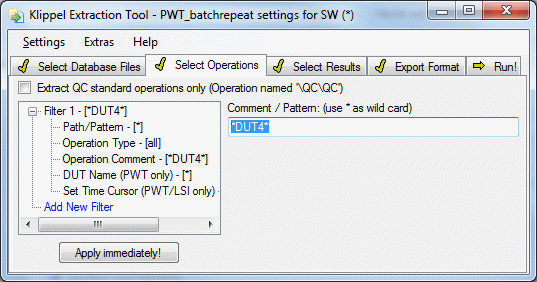
- Examples
- *
Using a wild card only means all operations are allowed
- I want exactly my comment
Providing a complete comment without wild cards means only operations containing exactly this comment will be processed.
- *DUT4*
All operations with a comment that contains the text DUT4 somewhere are processed.
DUT Name#
This option is only available for PWT – Power Test measurements.
In a Power Test Operation it is possible to name the individual DUT’s as shown in the example image below.
Example Image#
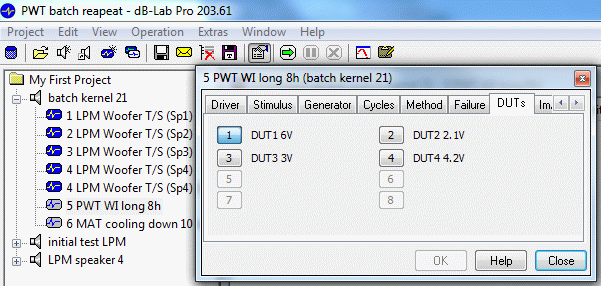
Using the DUT Name filter condition it is possible to select the measurement results of certain DUT’s for extraction. For details about the handling of Power Test Data please refer to section on how to extract PWT results
Set Time Cursor#
The Set Time Cursor filter only affects operations that have a time cursor, like LSI (Large Signal Identification) and PWT (Power Test).
Their measurement results might change over the time. Hence selecting a point in time is necessary.
By default the pre-selected point in time as chosen in the measurement operation is used for the extraction. This point is chosen by the user when viewing LSI or PWT results in dB-Lab.
To select other points in time select the corresponding checkbox(-es).
When a point in time is chosen db extract will automatically place the time cursor there and extract the corresponding measurement results for this instance in time.
When more than one instance in time is chosen, the operation is extracted multiple times. Each selected point in time is handled like an individual measurement operation.
This results in multiple lines in the extracted files (or the MAT filter being called multiple times) for one operation.
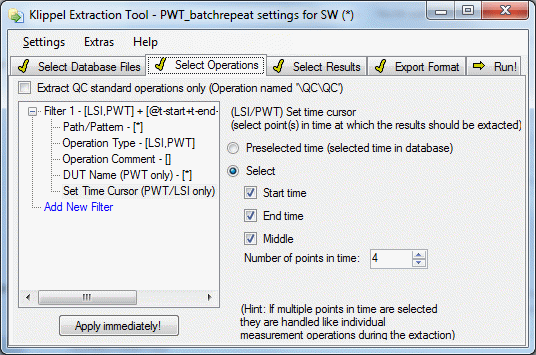
You can select the start and the end of the measurement. Furthermore it is possible to select points in between. To do that check the Middle checkbox and select the amount of points. Those points in time will be equally distributed over the time span between start and end of the measurement.
SELECT RESULTS to Export#
Here, you select which result curves you want to export.
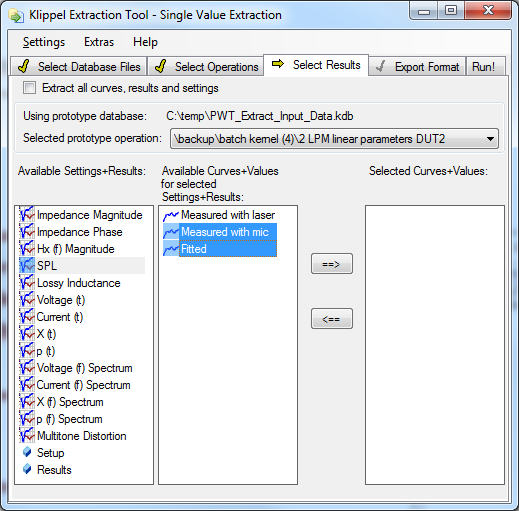
First it is necessary to select an operation as prototype from the drop-down list. (Only if prototype database contains more than one operation.)
The first list to the left shows all result windows of the selected operation. Result windows without any result curves are greyed out. Setup parameters and single value results are stored in the Setup and Results objects at the end of the list.
The second list shows all curves or values available in the selected result windows or objects selected in the first list.
The third list shows the results you have selected to export.
- To add curves and values to the export list
Select one or more result windows or objects from the first list
Select one or more curves or values from the second list
Click the Add Button.
- To remove curves from the list of curves to export
Select the curves or values to remove from the third list
Click the Del button
Extract All Curves, Results and Settings#
In some cases it is necessary or easier to extract all available curves or values in the selected operations.
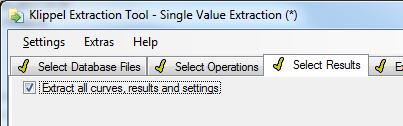
Checking the Extract all curves, results and settings checkbox tells db extract to scan all operations for available curves or values and extract all of them during the extraction run.
Extract all curves from one chart (or values from an object)#
To extract all curves contained in a chart or to select all values in an object (e.g. Setup or Results) right-click on the list item and click on Select All Contained Data.
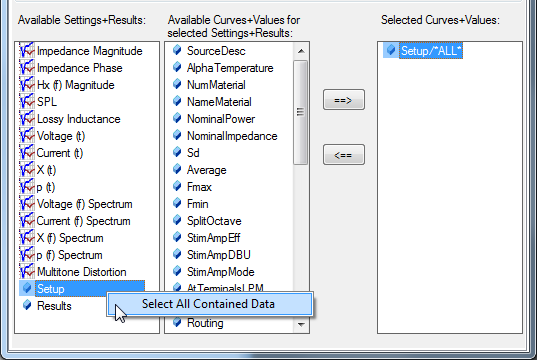
A wildcard will appear in the list of selected curves and values.
During the extraction all curves and values in the chart/object will be processed.
When you have selected at least one result curve, the next step, Export Format becomes available. You may get useful results already with the default settings. However, it is still a good idea to examine them before you start the export.
General vs. QC Results#
General results are obtained from the charts and the clipboard interface of the modules. Those results are available for text and scilab © export.
QC results are obtained directly from the QC module (only available for QC operations). Since version 3.170 QC results (2D curves and single values) are available for text and Scilab \(©\) export.
If the extraction source data are QC operations, using the QC results directly should be preferred.
Define Export Format#
The EXPORT FORMAT page provides extensive control over the format of the exported text files. We tried to make all aspects configurable that are necessary for a smooth import into all kinds of external tools and applications.
The default settings work well for Microsoft Excel ©, if your PC is configured to use a period as decimal separator.
Note
Some of the settings contain tokens in angle brackets, e.g. data<Window>_<Curve>.txt. During export, these tokens are replaced with actual values from the exported data. Mastering these tokens gives you most flexibility in getting the exact export you need. For more information, see the chapter Export Format Tokens below.
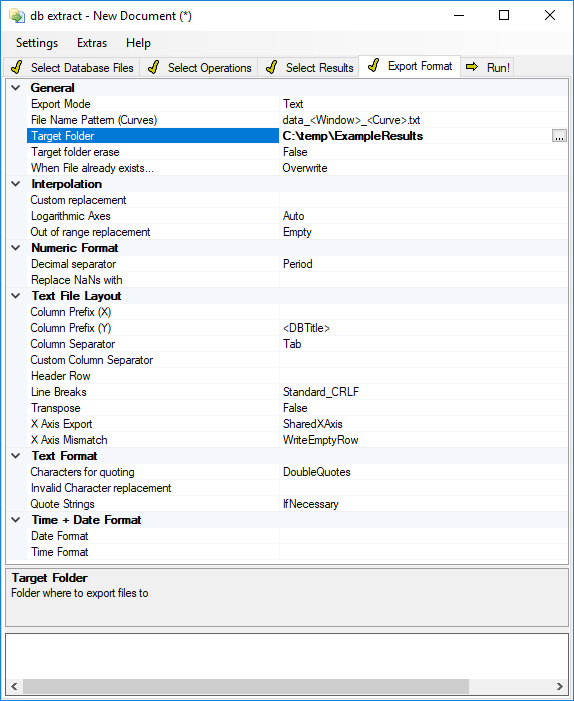
The individual settings are grouped into categories like Files, General Format etc., which are described in the following sections.
Usually, you will create one file for each selected result curve (e.g. Frequency response), holding one row for each QC database with the values of this curve. You modify this behavior by adjusting the Data File Name Pattern property.
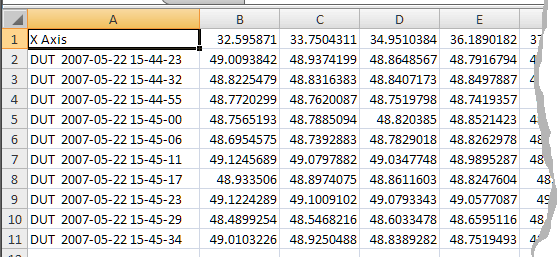
You can configure how the \(x\)-axis is exported, the contents of the columns in front of the data, and the text format.
Note
Data is written row-wise to cope with the amount of data to be expected from QC on line operation. Column wise export can be generated by using the . For more information, see below.
Export Format Tokens#
In some export settings, like the target file name pattern and the prefix columns, you can use tokens that are replaced with current value during export.
Tokens are always in angle brackets, and not case sensitive. Unknown tokens are written to the export file unmodified.
The following fixed tokens are available:
<DBPath>Full path of the KLIPPEL database (folder, filename, extension)
<DBName>File name of the KLIPPEL database (with extension)
<DBTitle>File name of the KLIPPEL database (without extension)
<DBFolder>Folder path of the KLIPPEL database
<OpTitle><OpName><Operation>Name of the measurement operation
<OpPath>Path to the operation in the KLIPPEL database (e.g.: )
<OpType><Module>Type of the measurement operation (e.g.: QC – Quality Control, LSI – Woofer Driver,…)
<OpTypeShort><ModuleShort>Short abbreviation of measurement operation type (e.g.: QC, LSI,…)
<ObjectName><Object>Name of the object the current operation belongs to (the folder that contains the operation in the database structure)
<OpDate>Date of the measurement
<OpTime>Time of the measurement
<OpComment>Comment for the operation
<DUT>Number of the DUT (for Power Test only, DUT’s are handled like individual Operations)
<DUTName>Name of the DUT (for Power Test only, DUT’s are handled like individual Operations)
<AxisLabelX>\(x\)-Axis Label
<AxisLabelY>\(y\)-Axis Label
<Window><Chart>Name of the result window
<Curve><ResultName>Name (label) of the curve or result
<Axis>(Prefix columns only) \(x\) for \(x\)-Axis Data, \(y\) for \(y\)-Axis Data
<tab>Tabulator character (cannot be used in File Name Pattern)
<log:column>Value from a column in the QC Log file (see below).
Replace column with name of the column- Tokens from QC Log file
The QC Module writes a log file with one row per DUT measured, containing PASS/FAIL decisions and scalar values (like Level, Temperature, Humidity). The actual contents depend on the configuration of the QC operation.
Note
To import information from the QC Log file, the QC measurement must be run with QC 2.0. Log files written by previous versions of the QC module are not interpreted.
Category General#

- Export Mode
Defines the export mode, available:
Text: Exports the selected results (curves, single values) from General and QC results to text filesScilab \(©\) : Exports the selected results (curves, single values) from General and QC results to HDF5 containers in a pre-defined order along with an index file that maps the extracted measures to the output files.- File Name Pattern (Curves)
(Only for text export) Determines how the exported data is split into separate files, and how these files are named. See also below.
- Target Folder
The destination folder where to export data to. If you leave this empty, data is exported to a new folder below your Window temp directory. You can navigate there easily by clicking View Results after the export.
- Target Folder Erase
When the target folder already contains some files or subfolders, this option will delete all files from the target folder before export. (There is a message box to confirm that)
- When file already exists…
(Only for text export) When a file already exists during export, this option decides whether it should be overwritten, or the new data should be appended.
Note
When appending to a file, a new file header and – if selected – a new shared \(x\)-axis is written.
Data File Name Pattern#
Default setting: data_<Window>_<Curve>.txt
Determines how exported files are named, and which data goes into separate files.
The default setting includes the tokens <Window> for the result window name and <Curve> for the name of the curve to be exported. For the example data selected above, this would create the following files:
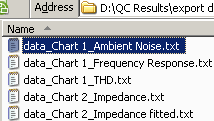
If you would specify just results.txt, all data for all databases and all curves would go into a
single file. This may be useful in some scenarios.
There are many more tokens you can use, for a full list, please refer to section Export Format Tokens.
- Examples
<Curve>.txtFor a typical QC operation, you can omit the
<Window>token, and use e.g. only<Curve>.txtas file name pattern.The default configuration keeps the <Window> token, to get separate files for all potential QC configurations, even if curves with the same name appear in different windows.<OpDate>\<Curve>.txtThis will create a sub folder for each day a measurement was taken: The
<OpDate>token will be replaced with the day the measurement was taken, and the backslash acts as separator for a sub folder.<Window>_<Curve>_<DBTitle>.txtThis will additionally include the name of the QC result database (without path or extension). As a result, you get a separate file for each single curve.
Forbidden Characters#
Any characters in the file names that are not valid for Windows file names will be replaced by an underscore.
Category Interpolation#

Customizes additional format options for interpolated curves – only active for text export and if Interpolated is selected for
- Custom replacement
Replacement for a value that cannot be calculated because the original curve does not contain values in that certain range (Applies only if Out of range replacement is set to Custom)
- Logarithmic Axes
Changes interpolation mode depending on the axes-scaling if the extracted data shall be displayed with logarithmic axis-scaling set the parameter accordingly for better optical results
- Out of range replacement
Replacement for a value that cannot be calculated because the original curve does not contain values in that certain range
Curves may have different \(x\)-Axis values; thus, they cannot share the same \(x\)-Axis in the output file. This also means these curves cannot easily be compared or processed in software like Excel \(©\). Therefore, it can be very useful to generate a new \(x\)-Axis with sufficient range and resolution to be shared by all curves. The \(y\)-values for those new \(x\)-Axis values are calculated by linear interpolation.
Interpolation Problems#
One should be careful when using the interpolation option as problems might occur. In some cases, it is better to split the extraction in two runs. One extracting all curves that really need to be interpolated. And one to extract all curves that are fine without interpolation.
Possible problems:
Missing values (holes) in the extracted curve#
- Cause:
This happens when the Logarithmic Axes option is set to logY or logYX but the curve contains values equal to or less than zero. This can also happen if the Logarithmic Axes option is set to Auto but the dBLab chart containing the curve has more than one \(y\)-axis - with one of them set to logarithmic. (e.g.: LPM Lossy Inductance)
- Solution:
Try again using the linXY or logX setting.
Output curve does not look as expected#
There are several reasons why this can happen.
- Cause:
Wrong Logarithmic Axes setting
- Solution:
Always select the mode in which the extracted curve will be displayed after the extraction.
- Cause:
Additional or missing points
- Solution:
For the interpolation of multiple curves a new \(x\)-axis is created. This axis might not contain exactly the same values. (The output curve has at least the same but often higher resolution than the original).
- Cause:
Problems with multiple \(y\)-values at the same \(x\)-value: If the original curve contains multiple \(y\)-values at the same \(x\)-value (like all types of signal lines in LPM) it cannot be interpolated correctly.
- Solution:
Switch off Interpolation if possible
Category Numeric Format#
Customizes some aspects how numeric values are written.
- Decimal Separator
Select whether decimals are separated with a period or a comma (e.g.
123.45vs.123,45)- Replace NaN’s with
Some of the curves may contain numbers that are not representable (e.g. infinity, or simply empty cells). This setting controls what is written for these. The default is an empty cell
Category Text File Layout#
This category defines the general layout of the files, such as header rows, \(x\)-Axis export, column separators and line breaks
- Column Prefix (X)
Defines the contents of one or more columns before the actual \(x\)-Axis data. See below for details.
- Column Prefix (Y)
As Column Prefix (X), but for \(y\)-Axis Data.
- Column Separator
Select one of the standard characters to separate columns
Tab: a tabulator. Good idea for excel \(©\) and most programsComma: also good for many programs, unless you need a comma as decimal separatorSemicolonSpace: ok if you just export raw data (without any text or tokens containing spaces themselves)Custom: define a different column separator below- Custom Column Separator
If you selected Custom above, you can enter a column separator of your choice here. You can also use more than one character.
- Header Row
Contents of the first row. Again, you can use all tokens listed in section Export Format Tokens. If empty, no header row is written
- Line Breaks
This determines which character or character sequence is used to separate lines. In almost all cases, you will leave that at the default,
Standard_CRLF. However, with some tools you might see additional empty lines or “weird” characters, especially if you need to process these files on another platform. You may need to experiment which line break these tools treat correctly.- Transpose
Changes the format of the output files from row-wise to column-wise. Use this to import large curves to Excel or if your post processing software requires column-wise format (This option does not work if is set to Append; This is because the transposition is performed after the extraction run is complete, appending another extraction run would break the format. You can transpose files manually using the Transpose Toolbox, see )
- \(x\)-Axis Export
This determines how the \(x\)-Axis data is exported.
None: \(x\)-Axis data is not written to the file.For Each Curve: for each curve and operation, there will be one row with \(x\) data, and one row with \(x\)-data.Shared x-Axis: The first data row contains the \(x\)-Axis all following rows contain \(x\)-Axis Data. During export, it is verified that all curves written to one file do share the same \(x\)-Axis data. (If the curves do not share the same \(x\)-Axis a warning is prompted. These curves cannot be extracted to the same file -> use Interpolated to cope with that)Interpolated: Creates new \(x\)-Axis for all curves, corresponding \(y\)-values are calculated using linear interpolation (check additional parameters in Interpolation section) [Interpolated is slower than Shared X Axis]- \(x\)-Axis Mismatch
When you have Shared X Axis selected, but the \(x\)-Axis doesn’t match for one curve, this option determines what will be done:
Write Empty Row: writes a row with all column prefixes, but no data. If no prefixes are configured, an empty row is writtenSkip Row: no row is written at all. (This may cause problems with post processing tools that assume data on the same line number in different files belongs to the same operation)
Column Prefix Definition#
The default for \(x\)-data rows is X Axis, which will put this text in the first column of the (usually shared) \(x\)-axis data rows.
The default for \(y\)-data rows is <DBTitle>, which puts the database title in the first column.
Again, you can use any of the tokens documented in the Export Format Tokens chapter.
Multiple Prefix Columns#
You can also specify multiple prefix columns, by using the Column separator you selected.
Note
If you selected Tab as column separator, use <Tab> as separator for multiple prefix columns.
- Example
<DBTitle><Tab><log:Verdict-Overall>
Will put the QC result database title in the first column, and the overall verdict (PASS/FAIL) in the second. (This requires information from the QC Log file)
Category Text Format#
This controls some details how to treat text cells containing special characters.
Sometimes, a text cell contains the column separator, but should be treated as one cell. This happens often if you are forced to use spaces, comma or semicolon for column separators, but also need to add comments or other meta information. This will not always succeed, as sometimes the importing program has no way to know what is supposed to be a column.
These options allow to put quotes around offending cells, which helps some import tools to recognize that data. Check the documentation of the reader, or experiment with the settings.
- Character for Quotes
You can select to have single quotes or double quotes
- Invalid Character Replacement
Some characters (such as new line) cannot be included at all; also the quote character usually cannot be put into the middle of a quoted cell. This option determines what to use to replace such problematic characters.
- Quote Strings
Determines when to put quotes around a string
If Necessary (default): only when the cell contains characters that may be confused with the column separatorAlways: put quotes around all cells that contain strings
Category Date + Time Format#
Specifies how date and time is formatted when using replacements like <OpDate> and <OpTime>. If you
don’t specify a string (default), the short date or time representation for the current locale is
used.
Single letter formats provide standard formats based on your current locale settings. Specify one of the letters from the following table:
- d
short date
Note
lower case give short time format, uppercase long time format (with seconds).
- f
long date + time
Note
lower case give short time format, uppercase long time format (with seconds).
- M
Month + Day
- s
based on ISO 8601, sortable
- y
year + month
- t
time
Note
lower case give short time format, uppercase long time format (with seconds).
- g
short date + short time
- R
RFC 1123 format
- u
universal sortable format
You can also use one or more of the following letters to build custom format strings:
- dd
day of the month (1-31)
Note
Using two letters adds a leading zero to single-digit values. Use one letter to not use a leading zero.
- ddd
abbreviated weekday name
- dddd
full weekday name
- yy
year (without century)
Note
Using two letters adds a leading zero to single-digit values. Use one letter to not use a leading zero.
- hh
hour on a 12 hour clock
Note
Using two letters adds a leading zero to single-digit values. Use one letter to not use a leading zero.
- t
first letter of local am/pm string
- mm
minutes (Using two letters adds a leading zero to single-digit values. Use one letter to not use a leading zero.)
- f
fractions of a second.
Note
Repeat up to seven times for higher precision (i.e. “f” for tenths of seconds, “fffffff” for 7 digit precision). May be zero.
- :
default time zone separator
- MM
month (01-12)
Note
Using two letters adds a leading zero to single-digit values. Use one letter to not use a leading zero.
- MMM
abbreviated month name
- MMMM
full month name
- yyyy
year (four digits)
- gg
period/era (for locales that use this)
- HH
hour on a 24 hour clock
Note
Using two letters adds a leading zero to single-digit values. Use one letter to not use a leading zero.
- tt
local am/pm string
- ss
seconds
Note
Using two letters adds a leading zero to single-digit values. Use one letter to not use a leading zero.
- F
fractions of a second, without trailing zeroes
Note
Repeat up to seven times for higher precision (i.e. “f” for tenths of seconds, “fffffff” for 7 digit precision). May be zero.
- /
default date separator
Note
if you want to use a format string with only a single letter from this table, prefix it with “%”, e.g. “%d” for only the day of the month. To have a character not interpreted, prefix it with a backslash, e.g. “day dd” for “day 12”.
- Examples
yyyy-MM-dd(without the quotes) enforces international date format, independent of current settingsMM\/dd\/yy(without quotes) enforces US date format, independent of current settings. (Due to the backslashes forward slash isn’t replaced by the locale-dependent date separator)
Perform Export#
After all settings have been made, you can click Run on the EXPORT page to start the export process.
During the export, there will be an indicator of progress, and a log with errors, warnings, and additional information about the export.
Additionally, an extraction log file is written to the target folder which contains all diagnostic information.
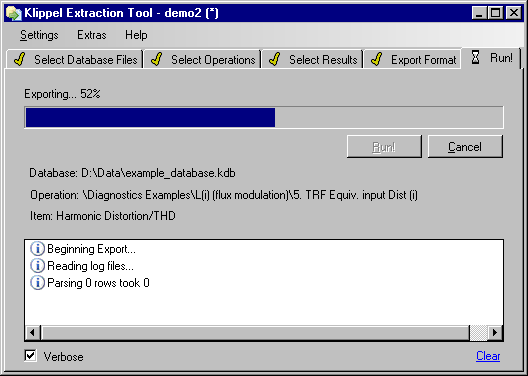
After the export, you can click View Result to browse to the folder where data was exported to.
Disabling Verbose hides the additional information in the Export log (so only warnings and errors are shown).
Double click on warnings or error messages for more detailed information.
Extraction Results#
After the extraction run the View Results button appears. Clicking on it opens the target folder in windows explorer \(©\). The target folder contains all the extracted data and the extraction log file (with warnings and error messages).
Open the result files with your post processing software (e.g.: Excel \(©\)).
Scilab © export#
The Scilab \(©\) export exports the binary data to HDF5 files for every measure to a structured folder structure. The index file maps the extracted data to the output files.
Scilab \(©\) version 5 can be used to open those files for automated processing.
Transpose Toolbox#
Introduction#
Using the Transpose Toolbox you can reformat extracted text files from row-wise to column-wise format and back. This is especially useful if the data has already been extracted but the used post processing software (e.g.: Excel \(©\)) requires the other (row/column-wise) format. Transposing already extracted files is faster than extracting them again with the transpose-option toggled.
How to use it:
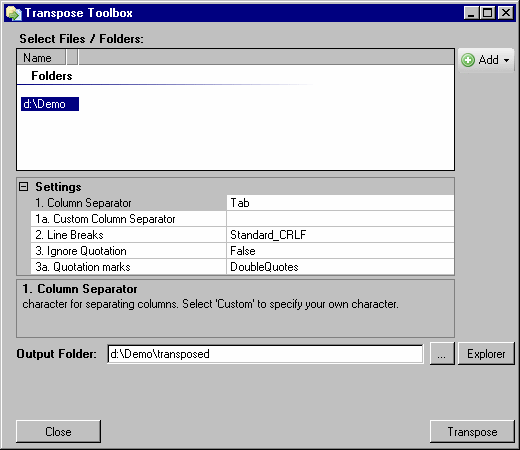
Simply add the files (or whole folders) to transpose by drag&drop or selecting them using the Add Button.
Check and correct the Settings (see below)
Choose an Output Folder for the transposed files.
Click Transpose
Click the Explorer button to show your transposed files
Settings#
Some settings need to be defined to correctly transpose the result files. These Settings need to be equal to the ones used to create the extracted files. By default these settings are defined by the settings defined in db extract. This means if you have loaded the settings file that was used for extracting the files to transpose, the settings are already correct.
- Column Separator
Select one of the standard characters to separate columns
Tab: a tabulator. Good idea for excel and most programsComma: also good for many programs, unless you need a comma as decimal separatorSemicolonSpace: ok if you just export raw data (without any text or tokens containing spaces themselves)Custom: define a different column separator below- Custom Column Separator
If you selected Custom above, you can enter a column separator of your choice here. You can also use more than one character.
- Line Breaks
This determines which character or character sequence is used to separate lines. In almost all cases, you will leave that at the default,
Standard_CRLF. However, with some tools you might see additional empty lines or weird characters, especially if you need to process these files on another platform. You may need to experiment which line break these tools treat correctly.- Ignore Quotation
If set to True quotation marks are handled as normal characters otherwise column separators within quotation marks are part of a string - not generating new columns
- Quotation marks
You can select to have single quotes or double quotes
Note
This toolbox should only be used for extracted text files. Using it on other files might break these and can lead to serious problems. When selecting a whole folder - files with following extensions will not be transposed: extract.log, .kdb, .ldb, .kdbextract, .pdf, .doc, .xls, .zip, .exe, .dll
Working with Settings Files#
Using the Settings Menu, you can save and load the current settings. The settings files are plain text files using .xml format. They can be altered manually to provide most flexible settings for automated post processing. A consultation of this matter with KLIPPEL is strongly recommended.
Settings loaded on program startup#
By default db extract automatically loads the last used settings file on startup. That behavior can be changed by going to the menu .
The menu shows two alternatives to the default setting.
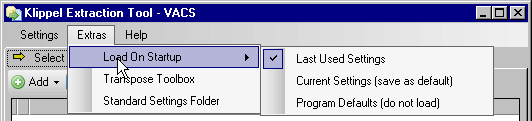
- Current Settings (save as default)
By selecting Current Settings (save as default) a default settings file with the current settings is saved. This file will from now on be loaded on startup.
- Program Defaults (do not load)
The third option Program Defaults (do not load) will cause the program to keep its programmed-in defaults and to not load at all. This will result in a slightly faster startup time.
Organizing Projects - Location of Data and Configuration Files#
A current set of folder and file specifications for a project (e.g. database selections, the MAT filter database, output filter and others) will be stored in the settings file. If any of the files or folders is moved on the hard disk these settings become invalid.
The db extract program offers one solution for that problem. The parent folder of the settings file can be seen as the project folder. All data herein (files or sub folders) may be seen relative to this folder. The project folder may be moved on the hard disk without invalidating the references stored within the settings file. Hence, the extraction of data will work after loading the settings file at the new location.
The MAT filter script files are not included in this mechanism. These files have to be defined relatively to the script base folder of the current dB-Lab installation. The script location can be found in the folder diagnostics window of dB-Lab (Scilab \(©\) Script Library).
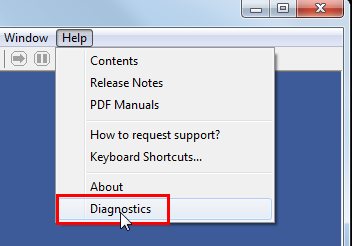

Some scripts might be missing in case of multiple installations. Then the correct version of dB-Lab (for which the scripts have been installed) has to be activated.
Distributing kdbextract- Files#
A quick way to distribute a configured settings-file in a company, to customers or to colleagues, is to use the KLPACK feature available from dB-Lab v206 and newer. Pack the settings file into a ZIP archive and rename the archive from *.zip to *.klpack.
Double clicking on the klpack-file will install the contained settings-file(s) to db extract’s standard settings folder.
Note
Please note that only kdbextract-files are to be installed. It is not possible to install additional files (like template databases). Existing files are overwritten without backup.
Command Line Parameters#
Using command line arguments, db extract may be configured and started with using a shell which provides an interface for the using db extract in batch files or arbitrary software.
Base for all command line arguments is the settings file. The settings may be overwritten by subsequent comment line options.
Syntax:
mysettings.kdbextractAbsolute or relative path to an existing or new settings file (see
/createNew).[/exportmode:{text|scilab}]Selection of export mode. Default: text
[/base: "<folder>"]Absolute path of base folder that is used as base for relative paths of settings file or input data. If not specified, all relative paths use the current working directory.
[/adddb: "<file.kdbx>" ]Absolute or relative path to a database that is added to the input data. May be specified multiple times. Wildcards are not supported.
[/addlog: "<Summary.log>"]Absolute or relative path to a QC summary log file that is added to the input data. Only used for text export of single values. May be specified multiple times. Wildcards are not supported.
[/addlist: "<List.txt>"]Absolute or relative path to a list file containing multiple database or QC summary files. Every file has to be listed in a separate line. Absolute or relative paths may be used.
[/addfolder: "<folder>[,rec]"] [/adddir: "<folder>[,rec]"]Absolute or relative path to a folder that is added to the input data. Every database and log file is extracted. The optional rec enables recursive adding of directories. Wildcards are not supported.
Note
Note: specify the path without a trailing slash or backslash.
[/addfolder2:"<folder>[|{rec/norec}[|<filter>]]"]Like /addfolder, but with this option it is possible to use <filter> to filter the contained files by a name pattern. You have to define whether the folder should be indexed recursively (rec) or not (norec).
Allowed symbols in pattern:
- ?
Any single character
- *
Zero or more characters
- #
Any single digit (0–9)
- [charlist]
Any single character in charlist
- [!charlist]
Any single character not in
[/targetdir: "<folder>"][/targetfolder: "<folder>"][/target: "<folder>"]Absolute or relative path to output directory Wildcards are not supported.
[/targetfoldererase][/tferase]Set Target folder erase option to true. If user should not be asked for deleting, you have to set /silentDelete also.
[/silentDelete][/sD]Deactivates configuration dialog for deleting the output directory. Only active if Target folder erase is set to True.
[/extractall][/ea]Everything is extracted that is contained in the source data, it is independent of the prototype database.
[/removeall][/ra]Removes complete selection for data extraction
[/createNew][/create][/c]Creates a new settings file or overwrites the existing
[/save][/s]Saves the modifications of the settings file.
[/run][/r]Runs db extract after configuration is finished
[/exit][/e]Exits db extract after configuration and extraction
[/verbose][/v]Shows warnings and additional information
[/windowstate:{minimized|maximized}][/ws:{minimized|maximized}]Defines the window state on start-up
/checkpid:<ProcessID>If given, db extract checks for the existence of this ProcessID and will exit when it doesn’t exist anymore. Only during extraction.
[/resetOpFilter][/rof]Resets all operation filter
[/opPath:"<path>,[filterNumber]"]Defines the path pattern for an operation filter. The comma is mandatory for paths that include commas (or unknown paths that could include commas). It is recommended to use a trailing comma if the optional filter number is not used. Wildcards are supported.
[/opType:"<type1>[,filterNumber]"][/opType:"<type1>+<type2>[,filterNumber]"]Sets operation type(s) for a filter, supported module names:
AUR – AuralizationCAL – CalculatorDIS - 3D DistortionLPM - Linear ParametersLSI - Tweeter DriverLSI - Woofer DriverLSI - Woofer + BoxMAT – MathScriptPWT - Power TestQC - Quality ControlSIM - Simulation 2.0TRF - Transfer FunctionUsing only the short notation is also possible (AUR, CAL, DIS, LPM, LSI, MAT, PWT, QC, SIM, TRF)[/opType:"AllowAll[,filterNumber]"]Deactivates the type selection for a filter
[/opCmt:"<comment>[,filterNumber]"]Activates comment-based filtering for operations
[/opDUT:"<DUTname>[,filterNumber]"](only for PWT operations) Activates DUT selection for a filter
[/opTime:"<tokens>[,filterNumber]"](Only for LSI and PWT operations) Activates the selection of points of time for the extraction. Multiple tokens are catenated with +
Supported tokens:Start (first position)Middle=N (N: number of points, equally distributed between start and end)End (last position)[/opTime:"Preselected[,filterNumber]"](Only for LSI and PWT operations)
[/transpose:{Y|N}][/t:{Y|N}]Set transpose on or off
[/filenamepattern:"<pattern>"][/fnp:"<pattern>"]Set File Name Pattern for Curves
[/resultcurve:"<selectedCurve>"][/rc:"<selectedCurve>"]Select Curve for export Supports * as Wildcard, i.e.
/rc: "Impedance Magnitude"/*[/resultvalue:"<selectedValue>"][/rv:"<selectedValue>"]Select Single Values for export Supports * as Wildcard, i.e.
/rv:"Results/*"[/columnprefixx:"<ColumnPrefixX>"][/cpx:"<ColumnPrefixX>"]Set Column Prefix (X)
[/columnprefixy:"<ColumnPrefixY>"][/cpy:"<ColumnPrefixY>"]Set Column Prefix (Y)
Prefetch mode#
/prefetchSilently runs db extract in background and exits. This shortens the startup time on next calls.
No wildcards (*, ?) are supported when specifying multiple files. If this is needed, a batch file shall be used to convert the selection with wildcards into a file list. This list can be imported using the /addlist parameter.
Filter Number#
As shown in the picture below more than one operation filter can be applied. To add filters via
command line or to change the settings of one certain filter the filter number has to be specified
when using the commands /opPath, /opType, /opCmt, /opDUT or /opTime.
If the specified filter number does not exist new filters are added. If it does already exist the filter is changed.
If no filter number is specified the first filter is changed.
Please do not leave out a filter number. Empty filters will be initialized to match everything.
- Example
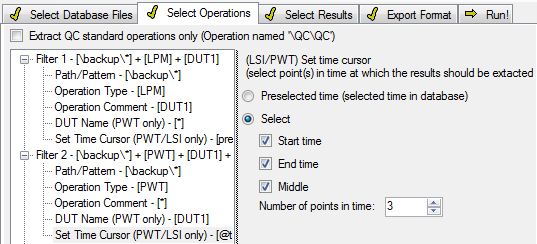
The below listed example uses two operation filters to extract certain LPM and PWT results. A settings file is loaded. Then the operation filter is reset using
/resetOpFilter. Both filters allow operations from the folder backup only. Note that all commands for the second filter need to have the filter number specified explicitly:/opPath:"\backup\*,2*".Filter 1 is setup to handle LPM ‘s only while Filter 2 is used for PWT ‘s.
The LPM s are selected by their comment
/opCmt:"DUT1"while PWT ‘s are being switched to the equally named DUT/opDUT:"DUT1,2".Finally PWT ‘s are extracted with several different time cursor positions.
    "PWT_ExtractDemo.kdbextract" /resetOpFilter
/opPath:"\backup\*" /opType:"LPM" /opCmt:"DUT1" /opPath:"\backup\*,2" /opType:"PWT,2"
/opDUT:"DUT1,2" /opTime:"start+end+Middle=3,2"
That’s how the settings look in DB Extract:
Note
The command line parameter/QcOnly is deprecated and is not interpreted. The functionality can be imitated with the parameters /opPath and /opType.
Install Paths#
To call db extract from any arbitrary software it might be necessary to locate the DB Extract installation on the current PC. This is easily done using the Windows registry.
The DB Extract installation path can be requested from:
The standard settings files location can be requested from:
Note
These Registry keys and values are correct for Windows © 32 applications. For 64 bit applications use:
Prototype database#
The prototype database is used to select the results to be extracted. If a file list or a folder is defined as input item, the database is selected automatically. If it is needed to select a specific database in a folder, it needs to be added separately as database. Then this item can be selected as database. This database is not extracted twice.
How to Extract Power Test Results#
Multiple DUT’s#
Power Test operations may contain measurement data of multiple DUT’s.
When viewing those results in dB-Lab it is necessary to select one DUT to show its results.
In dB Extract it is possible to select which DUT’s are selected for extraction by the “DUT Name - Operation Filter” (see: Filter Operations DUT Name).
Each DUT has its own curves and tables hence each DUT is treated like an individual measurement Operation.
This means in an extract txt file one line per DUT is written instead of one line per operation. Furthermore the MAT filter (if enabled) will be called multiple times for one operation.
To be able to distinguish the results add the <DUT> or <DUTName> token as Column Prefix (Y) on the Define Export Format form (see: Column Prefix Definition).
Multiple points in time#
Power Test operations do not only contain multiple DUT’s they also show each DUT’s performance over time. In dB Lab one can select a point in time to check the results at this instant. Each point in time may contain different results.
In dB Extract use the Set Time Cursor filter to select a certain point in time.
Each Point in time has its own curves and tables hence each Point in time is treated like an individual measurement Operation.
This means in an extract txt file one line per Point in time is written instead of one line per operation. Furthermore the MAT filter (if enabled) will be called multiple times for one operation.
Troubleshooting#
Frequently asked questions#
What happened to the kxdbsettings extension?#
The extension was changed in the transition from version 1 to 3. Old files (kxdbsettings) may be opened and converted with db extract v3.
What happened to the MAT filter?#
The MAT filter was removed in version 3. All applications provided by KLIPPEL will be replaced by separated modules. Until the module is released as a separate module db extract v1 may be used and supports those applications. The same applies for custom filter scripts. Version 1 and 3 can be installed parallel on one system.
Getting help#
If you can’t resolve a problem using the information in this manual, please let us know. When contacting KLIPPEL support, please provide:
- A minimal reproduction of the problem including:
- - A minimal settings file (kdbextract file) where the settings for db extract are stored- A minimal set of source databases (KDBX files) necessary to reconstruct the problem.- If you use command line arguments to call db extract, please also provide a batch wrapper
- Support information about the versions of KLIPPEL software:
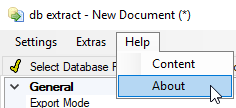
- - A screenshot of db extract ’s About window, available via the menu:
- Open dB-Lab via the link provided in the About dialog, then use the yellow envelope button and check
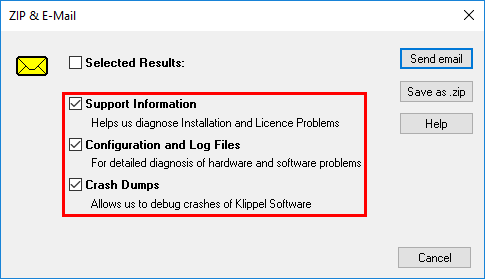
- - Support Information- Configuration and Log Files- Crash Dumps (only if you face crashes in the software)