
Automation#
Introduction#
Automation Overview#
The Automation Interface of the Klippel Analyzer System opens a door to access the functionality of the Klippel Software Modules like TRF, LSI, MAT from your own software.
The Automation Interface is a compound of ActiveX components helping you to establish measurements, to visualize the results like charts, tables and text and to store or load the setup and measurement data.
This enables using Klippel Automation in a variety of programming environments, from C# to python to even Excel.
Requirements#
We assume the reader is familiar with fundamental terms and aspects of the Component Object Model. An introduction can be found e.g. here:
The Component Object Model, Windows Dev Center
https://docs.microsoft.com/en-us/windows/win32/com/the-component-object-model
The reader should also be familiar with consuming COM objects in the programming environment of their choice. While the general idea is always the same, there are differences in how to create and access COM objects, their methods and properties.
Additional Documentation#
Beginning with Release 202, everything you need to run automation-based applications is included in the dB-Lab installation. However, if you want to start creating your own utilities, you need additional material.
Automation Interface included with dB-Lab#
The Klippel Automation Interface included with dB-Lab contains:
- Dynamic libraries
Scripting framework (KlAutomation.dll)
- Klippel Modules prepared for automation:
MAT Mathscript and CAL Calculator
LSI (LSI Woofer, LSI Woofer+Box, LSI Tweeter)
- Auxiliary ActiveX Components
Chart Result View
Table Result view
Text/HTML Result View
Release notes
Klippel Automation Documentation#
The Klippel Automation Documentation package contains
- Step-by-Step Tutorials for implementing a simple TRF measurement application in C Sharp, Visual
Basic, VBS and VBA
A reference of the automation components and interfaces
Software samples
TRF Simple (VB6 and C#)
MAT sample (VB6 and C#)
Documentation of module-specific behavior
Reference chart for setup and result parameters
The automation documentation package is available free of charge. If you received a CD, you will find the setup in the Automation\ subfolder. Otherwise, please contact KLIPPEL support for a download location.
Supported Environments#
We support all programming environments that can consume COM Automation (IDispatch) interfaces. Good candidates are Python for quick and simple scripts, and C# or another .NET-based language for complex applications with significant user interface, our samples will focus on these.
Since dB-Lab and its components is a x86 (32 bit) application, your application or script also needs to run in an x86 environment.
A very basic TRF example#
A very basic program like the following can be created with a few dozen lines of code in a common development environment such as C Sharp or Visual basic:
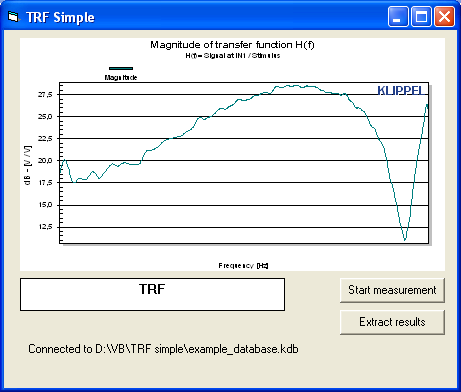
Clicking Start measurements runs a TRF Transfer Function measurement and displays the Magnitude H(f) result
Double-clicking TRF allows to see and modify the TRF settings
The chart automatically updates when settings or results of the attached TRF operation change. It provides largely the same functionality you already know from dB‑Lab.
The TRF module can be bound to a Klippel Database, to display results of a previous operation, and also to automatically store any changes made to settings or results.
For a serious application, you probably want to add more functionality, like selecting the database, or providing access to more result windows.
Supported Functionality#
Overview#
Note
The features described here may be implemented differently or not available for some Modules. For details, refer to the specification and the Automation manual, which is distributed separately.
See also
The Klippel Automation Interface provides a Software API to access individual components of the Klippel Analyzer System in a variety of client programming environments and scripting containers.
Through a Module component, added to the client software programmatically or as a visual component, the client gets access to setup and results of an operation, either new or stored in a Klippel database. The client can also modify the settings and run the measurement or simulation again. Display components known from dB-Lab can be used to show results automatically.
Automation offers separate module classes for the different operation types you know from dB-Lab, e.g. ModuleMAT and ModuleTRF.
Results can be stored in a database file, which can be analyzed in dB-Lab in detail with all results available.
Through the Database component, the client application gets full access to the objects and operations stored in a Klippel database (.kdb file). The client application can explore the contents and add, copy, move and delete elements programmatically.
A lot of the functionality is very similar to what you know from dB-Lab. However, there are some differences in implementation and availability. Please refer to the Automation manual for details.
Extract Results#
The Module object offers a sub-object Results, which contains a list of Result Windows similar to dB-Lab. The Result Windows give type specific access to:
cell based access for tables
plain text for Text and HTML result windows
These result data may be evaluated in the client software and exported to any format suitable for preferred post-processing tools (e.g. Excel).
A separate Results.Values object gives access to numeric values that are not displayed in a window. In dB-Lab they are usually accessible through the clipboard export.
Display results in the client application#
The result window display components of dB-Lab can be reused in a client application to display results immediately. By adding e.g. a KaDAGraphView visual component to the client application, and connecting it to a Result Window, creates an automatically updated display identical to dB-Lab, with the same interaction features.
Access to Setup#
A Module.Setup object gives access to the setup parameters available in the dB-Lab Property Pages. Measurement settings can be modified before running the operation, and analysis settings affect the accessible result data as they do in dB-Lab.
Running Operations#
The Module provides full control over the measurement: start, stop, checking state, and pausing the operation, if applicable for the module.
Module data exchange#
Client applications can connect different modules, and e.g. use the results of the first operation to calculate the settings for the next.
Cooperation with dB-Lab#
Both dB-Lab and Scripting Database API work with the database files.
An operation may be configured interactively in dB-Lab, and then used as a template for a simple automation client
The automation client may allow to modify a limited set of the setup parameters. These changes can be made visible in dB-Lab again.
The client application can create new operations with different settings, and run measurements. After measurement finished the results may be analyzed using db-Lab as browser.
Orientation#
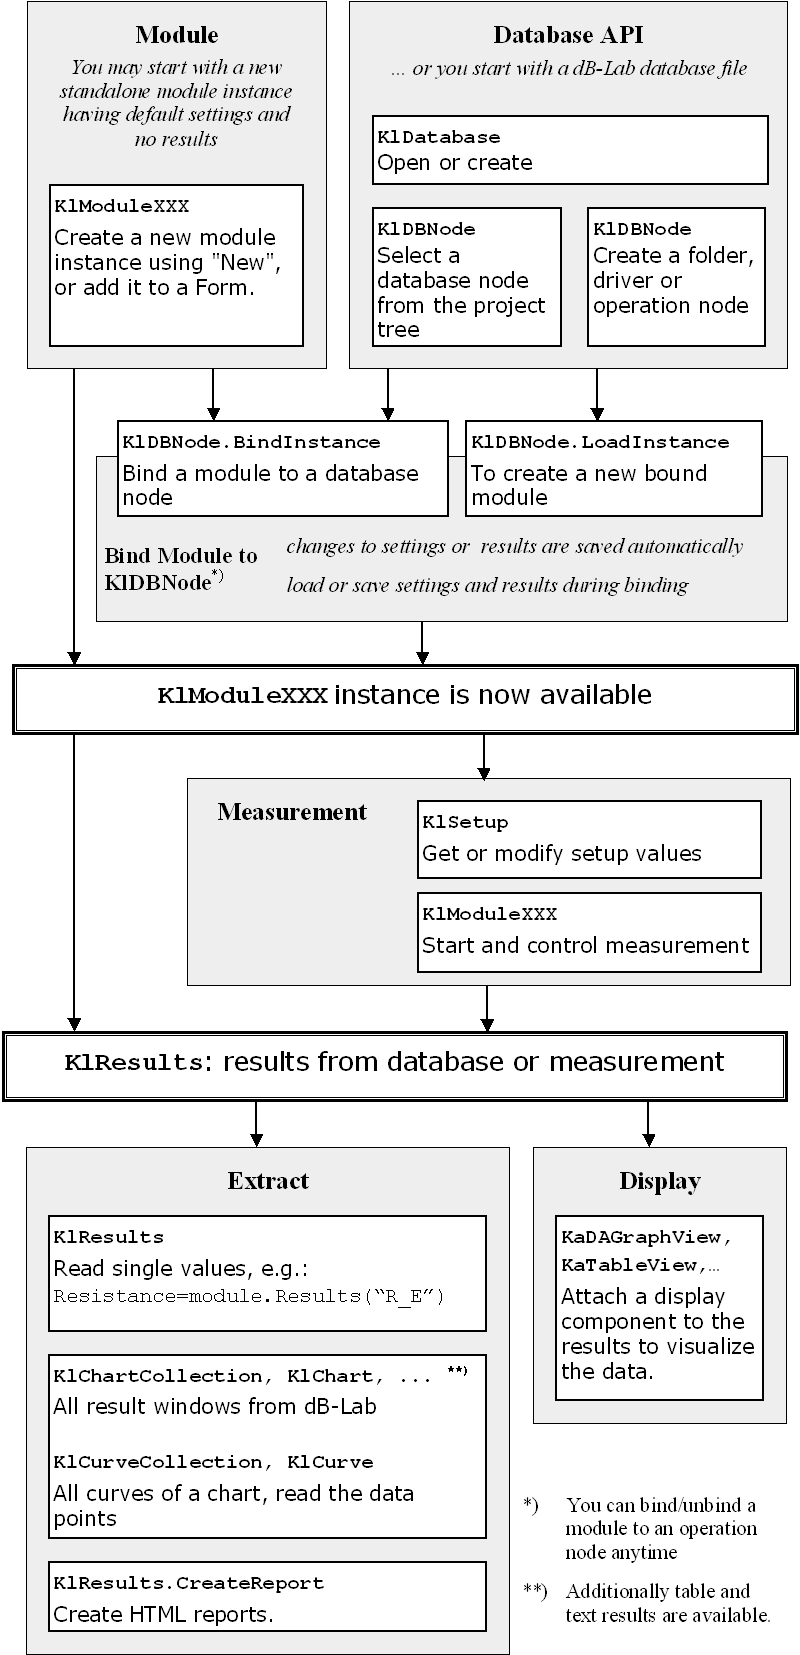
The flowchart below illustrates common tasks in using the API, and should give you a starting point to use the reference.
Limitations#
IMPORTANT NOTE: With the initial release, some of the Klippel Analyzer System modules do not fully support all functionality of the Automation interface.
For currently available functionality, please refer to the Specification “S 12 – Automation”, or contact Klippel support.
Requires knowledge of an applicable programming tool set or environment
Automation is not accessible from within dB-Lab
Automation of dB-Lab is not supported
- Functionality in Office applications and Windows Scripting Host is limited due to the host application. They are of limited use for larger projects.Example: WSH does not support access to the individual values in data curves.
Automation does not provide a complete user interface, only components that have to be connected
Client application is responsible for handling errors that occur during processing. Detailed error information is available.
No “visual” or “drag & drop” programming beyond the support provided by your development environment
No SQL / Query API for selecting operations in a database
Object / Operation shortcuts cannot be created
Display components show only results from the attached Module result window. Custom data can only be imported manually
Configuration of display settings is not possible directly. The MAT MathScript module allows a limited set of customizations and can be used for this purpose
Access to result window or curve can be done via name or index, both of which can break when changes are made to the underlying module. A Future release will provide “stable” result window and curve names that are independent of customizations.
Display customizations made in a client application are currently not visible in dB-Lab
The report generation relies on templates created with dB-Lab report generator
Reports can be created only for a single operation, merging results from multiple operations is possible but rather complicated
No enumeration of connected devices
No selection of sensor calibration
dB-Lab specific functionality, if not mentioned explicitly above, is not available
No support for DCOM / COM+ network access to the components
No explicit data binding support
